Process Information for Hand-Calculations CmONMOS
CN20PMOS
CMOSI4NMOS
CMOSI4PMOS
App.A
App.A
App.C
App.C
VDD(VSS=O)
5V
5V
3.3 V
3.3V
minimum Ldrawn
2.0~
2.0~
0.6~
0.6~
0.6~
0.8 urn
0.06~
0.09~
Process Information
DL = Ldrnw•
-
L'ff
minimum Wdrawn DW = Wdrawn- Weti' VTHNor
VTHP
KP, J1AfV' A, V-I
3.0~m
3.0~m
0.9~m
0.9~
0.14~
0.16~
0.35~m
0.35~
0.83 V
0.91 V
0.7V
0.9V
50
17
170
50
380 (typ.)
190 (typ.) 3.7 tF/~'
0.06 for L~ 5 urn 0.06 for L~ 5 urn
I dri" (~/~)
C~
R. or Rp 'til
or 'tp
800 aF/~'
800aF/~'
3.7 tF/~'
12kQ·(UW)
36kQ·(UW)
(9kQ·~m)IW
38 ps
114 ps
20ps
Multipliers Name
Symbol
Value
terra
T
10"
giga
G Mor(MEG)
10' 10' 103 10-3 10-0
mega kilo
k
milli
m
micro
~
(or u)
nano
n
pico
p
femto
f
alto
a
10-' 10-" 10-15 10-18
(18 kQ·
~m)IW
40ps
\ CJ" Physical Constants Name
Symbol
ValuelUnits
Vacuum dielectric constant
Eo
8.85 aF/!J.l1l
Silicon dielectric constant
E.
11.7£,
SiO, dielectric constant
E"
3.97£,
SiN, dielectric constant
E,,;
l6Eo
Boltzmann's constant
k
1.38 x 10⁻²³ IlK
Electronic charge
q
1.6 x 10⁻¹⁹ C
Temperature
T
K
Thermal voltage
VT
kT/q =26mV@300K
Equations Parameter
NMOS equations in terms of BSlMl parameters for PMOS use Vsn, VSG ' VBS ' and VTRP
VTHN
VFB+PHl+Kl . jPHl+ VSB -K2. (PHI+ VSB)
C~x
EoxlTOX
KP
MUZ· C~x
j3
KP·(WIL)
o (triode) VDS '::;; VGS - VTHN
2 ) (for Long L) j3 ( (VOS-VTHNlVDS-T
In (saturation)
~(Vos -
VDS~
VGS - Vr HN
V DS
VTHN)2[l
+ A(VDS-
VDS."')] (for Long L)
gm
j3(Vos-VTHN)=j2j3ID orIDI(VT·NO)
~
Kl.(2jpHI+VSB) l-K2andgmb=gm'T\
r,
1/(A./D)
..
IEEE Press 445 Hoes Lane, P.O. Box 1331 Piscataway, NJ 08855-1331
Editorial Board John B. Anderson, Editor in Chief P. M. Anderson M.Eden M. E. El-Hawary S. Furui A. H. Haddad
R. Herrick G. F. Hoffnagle R. F. Hoyt S. Kartalopoulos P. Laplante
R. S. Muller W.D.Reeve D. J. Wells
Kenneth Moore, Director ofIEEE Press John Griffin, Senior Editor Linda Matarazzo, Assistant Editor IEEE Circuits & Systems Society, Sponsor CAS-S Liaison to IEEE Press, Phillip Allen IEEE Solid-State Circuits Society, Sponsor SSC-S Liaison to IEEE Press, Stuart K. Tewksbury
Technical Reviewers Jeff Bruce, Micron Technology, Inc. Alan Buchholz, Comlinear Corporation Ian Galton, University of California, Irvine Bruce Johnson, University of Nevada, Reno Joseph Karniewicz, Micron Technology, Inc.. Brent Keeth, Micron Technology, Inc. William Kuhn, Kansas State University Wen Li, Micron Technology, Inc. Brian P. Lum Shue Chan, Crystal Semiconductor Corporation Alan Mantooth, Analogy, Inc. Adrian Ong, Stanford University Terry Sculley, Crystal Semiconductor Corporation Don Thelen, Analog Interfaces Axel Thomsen, Crystal Semiconductor Corporation Kwang Yoon, Inha Universiti, Korea
CMOS Circuit Design, Layout, and Simulation
R. Jacob Baker, Harry W. Li and David E. Boyce Department of Electrical Engineering Microelectronics Research Center The University of Idaho
IEEE Press Series on Microelectronic Systems Stuart K. Tewksbury, Series Editor
IEEE Circuits & Systems Society, Sponsor IEEE Solid-State Circuits Society, Sponsor
IEEE PRESS
The Institute of Electrical and Electronics Engineers, Inc., New York
:1
·-1 (\
i
L
\
Ii:",,~
e,
I-
This book and other books may be purchased at a discount from the publisher when ordered in bulk quantities. Contact: IEEE Press Marketing Attn: Special Sales Piscataway, NJ 08855-1331 Fax: (732) 981-9334 For more information about IEEE PRESS products, visit the IEEE Home Page: http://www.ieee.org/
© 1998 by the Institute of Electrical and Electronics Engineers, Inc. 345 East 47th Street, New York, NY 10017-2394
All rights reserved. No part ofthis book may be reproduced in any form, nor may it be stored in a retrieval system or transmitted in any form, without written permission from the publisher. Printed in the United States of America 10 9 8 7 6 5 4 3
ISBN 0·7803·3416·7 IEEE Order Number: PC5689
Library of Congress Cataloging-in-Publication Data
Baker, R. Jacob (date) CMOS circuit design, layout, and simulation I R. Jacob Baker, Harry W. Li, and David E. Boyce. p. em. -- (IEEE Press series on microelectronic systems) Includes bibliographical references and index. ISBN 0-7803-3416-7 I. Metal oxide semiconductors, Complementary-Design and construction. 2. Integrated circuits--Design and construction. 3. Metal oxide semiconductor field-effect transistors. I. Li, Harry W. II. Boyce, David E. III. Title. IV. Series TK7871.99.M44B35 1997 621.3815--DC21 97-21906 CIP
To Julie and Melanie
Contents
Preface
xix
Part I CMOS Fundamentals
1
Chapter 1 Introduction
3
1.1 The CMOS IC Design Process 1.1.1 Fabrication 1.2 Using the LASI Program 1.2.1 Cells in LASI
3 5 5 7
1.2.2 Navigating LASI
10
1.2.3 Adding Objects
10
1.2.4 Editing Objects
11
1.2.5 Placing Cells
12
1.2.6 Common Problems
14
1.3 MOSIS
15
Chapter 2 The Well
23
2.1 The Substrate
23
2.1.1 Patterning
24
2.1.2 Patterning the N-well
27
2.2 Laying out the N-well
27
. viii
Contents 2.2.1 Design Rules for the N-well
28
2.2.2 Using the LASIDRC program
30
2.3 Resistance Calculation
30
2.3.1 The N-well Resistor
32
2.4 The N-well/Substrate Diode
32
2.4.1 Depletion Layer Capacitance
33
2.4.2 Storage Capacitance
35
2.4.3 SPICE Modeling
37
2.5 The RC Delay Through an N-well
Chapter 3 The Metal Layers 3.1 The Bonding Pad
38
45 45
3.1.1 Laying out the Pad
45
3.1.2 Design Rules for Pads
48
3.2 Design and Layout Using the Metal Layers
, 50
3.2.1 Design Rules for the Metal Layers
50
3.2.2 Parasitics Associated with the Metal Layers
50
3.2.3 Current Carrying Limitations
54
3.2.4 Parasitics Associated with the Via
55
3.3 Crosstalk and Ground Bounce 3.3.1 Ground Bounce 3.4 Layout Using Cell Hierarchy
Chapter 4 The Active and Poly Layers 4.1 Design Rules
56 57 59
65 66
4.1.1 Design Rules for the n+/p+ Active Layers
66
4.1.2 Design Rules for Polyl
69
4.2 Layout of a Standard Cell Frame
71
4.3 Patterning the Active Layers
71
4.4 Layout of the MOSFET
77
4.4.1 Parasitics Associated with the Active Layers
Chapter 5 The MOSFET
77
83
5.1 The MOSFET Capacitances
84
5.1.1 Case I: Accumulation
84
5.1.2 Case II: Depletion
85
Contents
ix
5.1.3 Case III: Strong Inversion
86
5.1.4 Summary
87
5.2 The Threshold Voltage
88
5.3 IV Characteristics of MOSFETs
93
5.3.1 MOSFET Operation in the Triode Region
94
5.3.2 The Saturation Region
96
5.4 SPICE Modeling of the MOSFET
98
5.4.1 Levell Model Parameters Related to VTHN
98
5.4.2 Levell Model Parameters Related to Transconductance
99
5.4.3 SPICE Modeling of the Source and Drain Implants
100
5.4.4 Layout of the MOSFET
102
Chapter 6 The 8SIM SPICE Model
107
6.1 BSIMI Model Parameters 6.2 BSIMI DC Equations
109 " . . . . . . . . . . . . . .. 111
6.2.1 The Threshold Voltage
III
6.2.2 The Drain Current
113
6.2.3 The Subthreshold Current
116
6.3 Short Channel MOSFETs
119
6.3.1 MOSFET Scaling
120
6.3.2 Short Channel Effects
122
6.4 The BSIM3 SPICE Model
124
6.5 Convergence
127
Chapter 7 CMOS Passive Elements
131
7.1 The Second Poly Layer (poly2)
131
7.1.1 Design Rules for Capacitor Formation
131
7.1.2 Parasitics of the Poly Cap
132
7.1.3 Other Types of Capacitors
134
7.2 Temperature and Voltage Dependence of Capacitors and Resistors
134 .
7.2.1 Resistors
134
7.2.2 Capacitors
140
7.3 Noise in Resistors
Chapter 8 Design Verification with LASICKT 8.1 Fundamentals of LASICKT
141
149 150
x
Contents 8.1.1 The Inverter
151
8.1.2 Running LASICKT
157
8.1.3 Higher-ranking Cells; The OR Gate
160
Chapter 9 Analog MOSFET Models
165
9.1 Low-Frequency MOSFET Model
165
9.1.1 Small-Signal Model of the MOSFET in Saturation 9.2 High-Frequency MOSFET Model 9.2.1 Variation of Transconductance with Frequency
166 171 173
9.3 Temperature Effects in MOSFETs
175
9.4 Noise in MOSFETs
178
Chapter 10 The Digital Model 10.1 The Digital MOSFET Model
185 185
10.1.1 Capacitive Effects
187
10.1.2 Process Characteristic Time Constant
188
10.1.3 De1ay- and Transition-Times
189
10.2 Series Connection of MOSFETs
192
10.2.1 DC Behavior of Series-Connected MOSFETs
192
10.2.2 Delay Through Series-Connected MOSFETs
194
Possible Student Projects
196
Part II CMOS Digital Circuits
199
Chapter 11 The Inverter
201
11.1 DC Characteristics
202
11.1.1 Noise Margins
203
11.1.2 Inverter Switching Point
204
11.2 Switching Characteristics
,. . . . . . . . . .. 205
11.2.1 The Ring Oscillator
209
11.2.2 Dynamic Power Dissipation
210
11.3 Layout of the Inverter 11.3.1 Latch-up 11.4 Sizing for Large Capacitive Loads 11.4.1 Distributed Drivers
, 212 212 216 221
Contents
xi
11.4.2 Driving Long Lines
223
11.5 Other Inverter Configurations
224
11.5.1 N-Channel Only Output Drivers
224
11.5.2 Inverters with Tri-State Outputs
226
11.5.3 The Bootstrapped NMOS inverter
226
Chapter 12 Static Logic Gates
231
12.1 DC Characteristics of the NAND and NOR Gates
231
12.1.1 DC Characteristics of the NAND Gate
231
12.1.2 DC Characteristics of the NOR Gate
234
12.2 Layout of the NOR and NAND Gates 12.3 Switching Characteristics
235 . . . . . . . . . . . . . . . . . . . . . . . . . . .. 236
12.3.1 NAND Gate
238
12.3.2 Number oflnputs
242
12.4 Complex CMOS Logic Gates
243
12.4.1 Cascode Voltage Switch Logic
247
12.4.2 Differential Split-Level Logic
247
12.4.3 Tri-State Outputs
252
Chapter 13 The TG and Flip-Flops
255
13.1 The Pass Transistor
255
13.2 The CMOS TG
257
13.2.1 Layout of the CMOS TG
258
13.2.2 Series Connection of Transmission Gates
260
13.3 Applications of the Transmission Gate
260
13.4 The Flip-Flop
265
13.4.1 Clocked Flip-Flops
266
Chapter 14 Dynamic Logic Gates
275
14.1 Fundamentals of Dynamic Logic
275
14.1.1 Charge Leakage
276
14.1.2 Simulating Dynamic Circuits
277
14.1.3 Nonoverlapping Clock Generation
279
14.1.4 CMOS TG in Dynamic Circuits
281
14.2 Clocked CMOS Logic
281
xii
Contents
Chapter 15 VLSI Layout 15.1 Chip Layout
,
15.2 Layout Steps
289 290 301
Chapter 16 BiCMOS Logic Gates
313
16.1 Layout of the Junction-Isolated BIT
314
16.2 Modeling the NPN
316
16.3 The BiCMOS Inverter
320
16.4 Other BiCMOS Logic Gates
323
16.5 CMOS and ECL Conversions Using BiCMOS
326
Chapter 17 Memory Circuits 17.1 RAM Memory Cells
331 332
17.1.1 The DRAM Cell
333
17.1.2 The SRAM cell
337
17.2 The Sense Amplifier
338
17.3 Row/Column Decoders
341
17.4 Timing Requirements for DRAMs
343
17.5 Modern DRAM Circuits
345
17.5.1 DRAM Memory Cell Layout
345
17.5.2 Folded/Open Architectures
347
17.6 Other Memory Cells
Chapter 18 Special-Purpose Digital Circuits 18.1 The Schmitt Trigger
350
355 355
18.1.1 Design of the Schmitt Trigger
356
18.1.2 Switching Characteristics
359
18.1.3 Applications of the Schmitt Trigger
359
18.1.4 High-Speed Schmitt Trigger
361
18.2 Multivibrator Circuits
362
18.2.1 The Monostable Multivibrator
362
18.2.2 The Astable Multivibrator
363
18.3 Voltage Generators
364
18.3.1 Improving the Efficiency
366
18.3.2 Generating Higher Voltages
367
18.3.3 Example
368
Contents
Chapter 19 Digital Phase-Locked Loops 19.1 The Phase Detector
xiii
373 375
19.1.1 The XOR Phase Detector
375
19.1.2 Phase Frequency Detector
379
19.2 The Voltage-Controlled Oscillator
383
19.2.1 The Current-Starved VCO
384
19.2.2 Source Coupled VCOs
387
19.3 The Loop Filter
391
19.3.1 XOR DPLL
391
19.3.2 PFD DPLL
398
19.4 System Considerations 19.4.1 Clock Recovery from NRZ Data 19.5 Delay-Locked Loops
403 407 417
Part III CMOS Analog Circuits
425
Chapter 20 Current Sources and Sinks
427
20.1 The Current Mirror
" 427
20.1.1 The Cascode Connection
433
20.1.2 Sensitivity Analysis
438
20.1.3 Temperature Analysis
439
20.1.4 Transient Response
442
20.1.5 Layout of the Simple Current Mirror
444
20.1.6 Matching in MOSFET Mirrors
446
20.2 Other Current Sources/Sinks
Chapter 21 References 21.1 Voltage Dividers
450
463 463
21.1.1 The Resistor-MOSFET Divider
464
21.1.2 The MOSFET-On1y Voltage Divider
465
21.2 Current Source Self-Biasing
469
21.2.1 Threshold Voltage Referenced Self-Biasing
469
21.2.2 Diode Referenced Self-Biasing
470
21.2.3 Thermal Voltage Referenced Self-Biasing
474
xiv
Contents 21.3 Bandgap Voltage References 21.3.1 Bandgap Referenced Biasing 21.4 Beta Multiplier Referenced Self-Biasing
477 478 480
21.4.1 A Voltage Reference
481
21.4.2 Operation in the Subthreshold Region
483
Chapter 22 Amplifiers 22.1 Gate-Drain Connected Loads
489 489
22.1.1 Common Source Amplifiers
489
22.1.2 The Source Follower
498
22.1.3 Common Gate Amplifiers
500
22.2 Current Source Loads
500
22.2.1 The Cascode Connection
506
22.2.2 The Push-Pull Amplifier
510
22.3 Noise and Distortion in Amplifiers
512
22.3.1 Modeling Amplifier Noise
515
22.4 A Class AB Amplifier
Chapter 23 Feedback Amplifiers
517
525
23.1 The Feedback Equation
526
23.2 Properties of Negative Feedback on Amplifier Design
527
23.2.1 Gain Desensitivity
527
23.2.2 Bandwidth Extension
528
23.2.3 Reduction in Nonlinear Distortion
529
23.2.4 Input and Output Impedance Control
530
23.3 Recognizing Feedback Topologies
532
23.3.1 Input Mixing
533
23.3.2 Output Sampling
533
23.3.3 The Feedback Network
534
23.3.4 Calculating Open-Loop Parameters
537
23.3.5 Calculating Closed-Loop Parameters
539
23.4 The Voltage Amp (Series-Shunt Feedback)
540
23.5 The Transimpedance Amp (Shunt-Shunt Feedback)
547
23.5.1 Simple Feedback Using a Gate-Drain Resistor
555
23.6 The Transconductance Amp (Series-Series Feedback)
558
23.7 The Current Amplifier (Shunt-Series Feedback)
562
Contents 23.8 Stability 23.8.1 The Return Ratio
Chapter 24 Differential Amplifiers 24.1 The Source Coupled Pair
xv 564 568
579 579
24.1.1 Current Source Load
582
24.1.2 Common-Mode Rejection Ratio
591
24.1.3 Noise
592
24.1.4 Matching Considerations
594
24.2 The Source Cross-Coupled Pair
596
24.2.1 Current Source Load
599
24.3 Cascode Loads
602
24.4 Wide-Swing Differential Amplifiers
605
24.4.1 Current Differential Amplifier
607
24.4.2 Constant Transconductance Diff-Amp
608
Chapter 25 Operational Amplifiers 25.1 Basic CMOS Op-Amp Design
617 618
25.1.1 Characterizing the Op-Amp
630
25.1.2 Compensating the Op-Amp Without Buffer
634
25.1.3 The Cascode Input Op-Amp
636
25.2 Operational Transconductance Amplifiers
637
25.2.1 Wide-Swing OTA
642
25.2.2 The Folded-Cascode OTA
654
25.3 The Differential Output Op-Amp
664
25.3.1 Fully Differential Folded-Cascode OTA
666
25.3.2 Gain Enhancement
674
Part IV Mixed-Signal Circuits
683
Chapter 26 Nonlinear Analog Circuits
685
26.1 Basic CMOS Comparator Design 26.1.1 Characterizing the Comparator
685 691
26.2 Adaptive Biasing
699
26.3 Analog Multipliers
704
xvi
Contents 26.3.1 The Multiplying Quad
705
26.3.2 Level Shifting
710
26.3.3 Multiplier Design Using Squaring Circuits
715
Chapter 27 Dynamic Analog Circuits
719
27.1 The MOSFET Switch
719
27.2 Switched-Capacitor Circuits
728
27.2.1 Switched-Capacitor Integrator 27.3 Circuits
Chapter 28 Data Converter Fundamentals
731 745
755
28.1 Analog Versus Discrete Time Signals
755
28.2 Converting Analog Signals to Digital Signals
756
28.3 Sample-and-Hold (S/H) Characteristics
759
28.4 Digital-to-Analog Converter (DAC) Specifications
762
28.5 Analog-to-Digital Converter (ADC) Specifications
772
28.6 Mixed-Signal Layout Issues
783
Chapter 29 Data Converter Architectures 29.1 DAC Architectures
791 791
29.1.1 Digital Input Code
791
29.1.2 Resistor String
792
29.1.3 R-2R Ladder Networks
797
29.1.4 Current Steering
800
29.1.5 Charge Scaling DACs
805
29.1.6 Cyclic DAC
810
29.1.7 Pipeline DAC
811
29.2 ADC Architectures
813
29.2.1 Flash
813
29.2.2 The Two-Step Flash ADC
818
29.2.3 The Pipeline ADC
823
29.2.4 Integrating ADCs
827
29.2.5 The Successive Approximation ADC
832
29.2.6 The Oversampling ADC
837
Appendix A Orbit's CN20 Process
855
A.l Process Specifications
857
Contents
xvii
A.l.l Electrical Specifications
857
A.l.2 N-Channel SPICE Models
859
A.I.3 P-Channel SPICE Models
861
A.2 Hand Calculations
862
A.2.1 The N-channel MOSFET Equations
862
A.2.2 The P-channel MOSFET Equations
865
A.3 Design Rules
867
Appendix B MOSIS Scalable Design Rules
873
Appendix C HP's CMOS14TB
885
Index
893
About the Authors
903
LASI Software
904
Preface
Over the last ten years the electronics industry has exploded. A recent report by the Semiconductor Industry Association (SIA) [1] proclaimed that in 1995 alone, world chip revenues increased by 41.7 percent and for the past five years the growth had been exponential. By the year 1999, the report estimates that world chip sales will surpass $234.5 billion, up from $154 billion in 1996. The largest portion of total worldwide sales is dominated by the MOS market. Composed primarily of memory, micro and logic sales, the total combined MOS revenue contributed approximately 75 percent of total world-wide sales ($114.2 billion), illustrating the strength of CMOS technology. The percentage of MOS sales relative to all chip revenues is expected to remain constant through 1999, when MOS sales will total $178 billion. CMOS technology continues to mature, with minimum feature sizes now approaching 0.1 lim. Texas Instruments recently announced a 0.18 lim process [2] in which the equivalent of 20 high-performance microprocessors could exist on the same substrate, with a transistor density of 125 million transistors. This high density allows for true system-level integration on a chip, with digital signal processors, microprocessors or microcontroller cores, memory, analog or mixed-signal functions all residing on the same die. As educators we are often asked by our students, "Isn't analog dead? I thought everything was going digital!" How untrue! The prediction of the future demise of analog electronics has been around since the mid-1970s. According to the SIA report [1], the revenues generated by analog products closely parallel the MOS logic market and achieved a 22.5 percent increase in 1995. The analog market expects to reach $18.2 billion in 1996 (a 9.5 percent increase) with double-digit growth projected for the next three years. In 1999, the total revenues generated by analog sales is forecasted to peak at $26.6 billion (11.3 percent of total chip sales!). However, while there is still
Preface
xx
demand for analog designers, their role is definitely changing. As was communicated by Paul Gray in [3], the days of pure analog design are over, meaning that very few systems remain purely analog. More and more systems are integrated, with increased functionality being performed in the digital domain. He goes on to state that the analog designer should become broad-based, with analog transistor-level design as the core skill. This means that the analog designer should also Have a good understanding of digital very large scale integration (VLSI) and be competent at using the latest computer-aided design (CAD) tools. know how to apply digital signal processing (DSP), analog signal processing (ASP), and filtering concepts to system-level design. possess insight into system implications of component-level performance. For example, DSP and transistor-level analog design skills are needed for oversampling applications such as data converters, filtering, and a host of relatively new circuit topologies based on sigma-delta modulation. Being able to design both analog and digital circuits, as well as understand the interactions between the two domains, will provide an added dimension to a designer's portfolio that is difficult to match. Analog designers are in demand more than ever, simply because the end limitations of digital electronics need to be examined under the "analog" microscope to fully understand the mechanisms that are occurring. Therefore, this text attempts to combine digital and analog IC design in one complete reference. Layout is the process of physically defining the layers that compose an integrated circuit. Typically, layouts are constructed using a computer-aided design program. CAD companies such as Mentor Graphics, Synopsis, and Cadence specialize in providing extremely powerful CAD software for the entire integrated circuit (Ie) design process, including design, synthesis, simulation, and layout tools within an integrated framework. These workstation-based software tools can literally cost millions of dollars, but provide convenient and powerful features found nowhere else. CAD tools also exist for the PC. Tanner Tool's L-Edit provides a complete IC design CAD program for the personal computer. The program discussed in this book, LAyout System for Individuals (LASI) (pronounced "LAZY"), also provides the student with the ability to layout ICs on a PC and includes design rule checking and design verification capability. It is distributed as shareware, free for educational purposes. With decreases in feature size come added complexities in the design. Layouts must now be considered heavily in the design process as matching and parasitic effects become the limiting factors in many precision and high-speed applications. The more the designer knows about the process with respect to layout and modeling, the more performance the engineer can "squeeze" out the design. However, performance is not the only reason to consider the layout. The economic impact of IC layouts can be detrimental to the circuit's marketing potential. In some cases a 20 percent increase in chip area can reduce the profits of a chip by several hundreds of thousands of dollars. Chip area should be considered as premium real estate. Therefore, much of the first ten
xxi
Preface
chapters of this book is devoted to fundamental layout issues, with other issues presented as the need arises. Modeling is also a key issue. A simulation is only as accurate as its model. Although the Berkeley Short-channel IGFET Model (BSIM) model has become the industry standard its relatively nonintuitive structure makes hand analysis using BSIM model parameters an intimidating process. To many students (and engineers), the BSIM parameters are nothing more than sets of numbers at the end of their SPICE decks. However, some very useful information can be gleaned from the BSIM model which helps make the hand analysis more closely resemble the simulated result. Chapter 6 provides a great deal of information that relates the BSIM model to first-order hand-analysis equations. A successful CMOS integrated circuit design engineer has knowledge in the areas of device operation, circuit design, layout, and simulation. Students learning CMOS IC design should be trained at a fundamental level in these areas. In the past, courses on CMOS integrated circuits dealt mainly with circuit design or analysis. Little to no time was spent on layout of the integrated circuits. This may have been justified. It is difficult to find a reason to layout an entire chip and then not have the chip fabricated. However, through the use of the MOSIS 1 program, students can submit their chip designs for fabrication through one of the MOSIS contracted vendors. In approximately ten weeks the chips are returned to the university for evaluation. The MOSIS program is an outstanding way of introducing students to the design of ICs. Although many texts [4-32] are available covering some aspects of CMOS analog or digital circuit design, none integrates the coverage of both topics with layout and includes layout software as is done in this text. Our focus, when writing this text, was on the fundamentals of custom CMOS integrated circuit design. It was our goal that a student who studies and masters the material in this text will possess the fundamental skills needed to design high-performance analog and digital CMOS circuits and have the basic understanding and problem-solving skills needed to enhance the performance of an IC or to determine why an IC doesn't function as simulated. Use of This Text This text can be used for two courses. Both courses can be offered at the senior/firstyear graduate level. The first course concentrates on the physical design of CMOS digital integrated circuits with prerequisites of junior level Electronics I and a course on digital logic design. A possible semester course outline is as follows. Week I
Chs. I & 2, introduction, course requirements, layout and SPICE demonstrations, the n-well, sheet resistance.
Week 2
Chs. 2 & 3, the n-well, pn junction, capacitance, resistance, delay through the well, introduction to the metal layers.
1 MOSIS - MOS Implementation System through the Information Sciences Institute at the University of Southern California, (310) 822-1511 or http://www.mosis.org
Preface
xxii Week 3
Chs. 3 &4, the metal layers, parasitics, electomigration, layout of the padframe, active/poly layers, layout of the MOSFET and standard frame.
Week 4
Ch. 5, MOSFET operation
WeekS
Chs. 5 & 6, completion of MOSFET operation, discussion of modeling using the BSIM model.
Week 6
Chs. 6 & 7, completion of BSIM model, layout of a capacitor, MOS temp dependence.
Week 7
Chs. 10 & 11, digital models and the inverter.
Week 8
Ch. 11, the inverter, switching point voltage and switching times, layout, latch-up, and design.
Week 9
Ch. 12, static logic gates, switching point voltages, speed, and layout.
Week 10
Chs. 13 & 14, the transmission gate, flip-flops, and dynamic logic gates.
Week 11
Chs. 15 & 16, VLSI layout and BiCMOS logic.
Week 12
Ch. 17, memory circuits, basic memory cells, and organization.
Week 13
Ch. 18, special-purpose digital circuits.
Week 14
Ch. 19, introduction to digital phase locked loops, phase detectors, VCOs.
Week 15
Ch. 19, digital PLL design.
The second course concentrates on CMOS analog circuit design. A possible semester course outline is as follows. Weeks 1 & 2 Review ofChs. 1-6. Week 3
Chs. 7, CMOS passive elements, noise characteristics.
Week 4
Ch. 9, analog MOSFET models.
WeekS
Ch. 20, current sources and sinks.
Week 6
Ch. 21, references.
Week 7
Ch. 22, amplifiers.
Week 8
Ch. 23, selected topics in feedback amplifier design.
Week 9
Ch. 24, differential amplifiers.
Weeks 10-12 Ch. 25, operational amplifiers. Week 13
Ch. 26, nonlinear analog circuits.
Week 14
Ch. 27, dynamic analog circuits.
Preface
XXIII
Week 15
Chs. 28 &29, selected topics in data converter design.
This text can also be used as an accompanying text in a VLSI systems course that focuses on the implementation of systems rather than circuits. Use of the text in this manner is benefited by inclusion of the LASI layout software.
REFERENCES [1]
Revised Forecast for World Chip Market Shows Growth of 6.7% in 1996, 19% by 1999, Semiconductor Forcast Summary 1995-1998, Semiconductor Industry Association.
[2]
"New TI Technology Doubles Transistor Density," Texas Integration Newsletter, Vol. 13, No.5, July 1995.
[3]
P. Gray, "Possible Analog IC Scenarios for the 90's," http://kabuki. eecs.berkeley.edu/slides.html
Instruments
Digital Circuits and VLSI System Design
[4]
C. Mead and L. Conway, Introduction to VLSI Systems, Addison-Wesley, 1980.
[5]
Glasser and Dopperpuhl, The Design and Analysis of VLSI Circuits, Addison Wesley, 1985.
[6]
M. Annaratone, Digital CMOS Circuit Design, Kluwer,1986.
[7]
A. Mukherjee, Introduction to NMOS and CMOS VLSI Systems Design, Prentice-Hall Publishers, 1986. ISBN 0-13-490947-X
[8]
D. A. Hodges and H. G. Jackson, Analysis and Design of Digital Integrated Circuits, McGraw-Hill, 2nd ed., 1988. ISBN 0 - 07 - 029158 - 6.
[9]
M. Shoji, CMOS Digital Circuit Technology, Prentice-Hall, 1988. 0-13-138850-9.
[10]
J. P. Uyemura, Fundamentals of MOS Addison-Wesley, 1988. ISBN 0-201-13318-0.
[11]
R. L. Geiger, P. E. Allen, and N. R. Strader, VLSI - Design Techniques for Analog and Digital Circuits, McGraw-Hill, 1990. ISBN 0-07-023253-9.
[12]
J. Y. Chen, CMOS Devices and Technology for VLSI, Prentice-Hall, 1990. ISBN 0-13-138082-6.
[13]
Fabricius, Introduction to VLSI Design, McGraw-Hill, 1990.
[14]
M. I. Elmasry, Digital MOS Integrated Circuits II, IEEE Press, 1992. ISBN 0-87942-275-0.
[15]
N.H.E. Weste and K. Eshraghian, Principles of CMOS VLSI Design, Addison Wesley, 2nd ed., 1993. ISBN 0-201-53376-6.
Digital
Integrated
ISBN
Circuits,
xxiv
Preface
[16]
J. P. Uyemura, Circuit Design for Digital CMOS VLSI, Kluwer, 1992.
[17]
D. A. Pucknell and K. Eshraghian, Basic VLSI Design, 3rd ed., Prentice Hall Publishers, 1994. ISBN 0-13-079153-9
[18]
D. Pucknell, Basic VLSI Design: Systems and Circuits, 3rd ed., Prentice Hall, 1994. ISBN: 0-13-079153-9
[19]
W. Wolf, Modern VLSI Design: A Systems Approach, ISBN: 0-13-588377-6
[20]
S. Kang and Y. Leblebici, CMOS Digital Integrated Circuits - Analysis and Design, McGraw-Hill, 1996. ISBN 0-07-038046-5.
[21]
K. Gopalan, Introduction to Digital Microelectronic Circuits, Irwin, 1996. ISBN 0-256-12089-7.
[22]
J. M. Rabaey, Digital Integrated Circuits - A Design Perspective, Prentice Hall, 1996, ISBN 0-13-178609-1.
Prentice Hall, 1994.
Analog Circuits [23]
A. B. Grebene, Bipolar and MOS Analog Integrated Circuit Design, John-Wiley, 1984. ISBN 0-471-08529-4
[24]
R. Gregorian and G. C. Ternes, Analog MOS Integrated Circuits for Signal Processing, John Wiley, 1986. ISBN 0-471-09797-7.
[25]
P. E. Allen and D. R. Holberg, CMOS Analog Circuit Design, Holt, Rinehart and Winston, 1987. ISBN 0-03-006587-9.
[26]
P. R. Gray, B. A. Wooley and R. W. Broderson, Analog MOS Integrated Circuits II, IEEE Press. ISBN 0-87942-246-7.
[27]
R. L. Geiger, P. E. Allen, and N. R. Strader, VLSI - Design Techniques for Analog and Digital Circuits, McGraw-HilI, 1990. ISBN 0-07-023253-9.
[28]
P. R. Gray and R. G. Meyer, Analysis and Design ofAnalog Integrated Circuits, 3rd ed., John Wiley, Inc., 1993. ISBN 0-471-57495-3.
[29]
M. Ismail and T. Fiez, Analog VLSI - Signal and Information Processing, McGraw-HilI, Inc. 1994. ISBN 0-07-032386-0.
[30]
K. R. Laker and W. Sansen, Design of Analog Integrated Circuits and Systems, McGraw-HilI, 1994. ISBN 0-07-036060-X.
[31]
G.A.S. Machado, Low-Power HF Microelectronics a unified approach, lEE, 1996. ISBN 0-85296-874-4.
[32]
D. Johns and K. Martin, Analog Integrated Circuit Design, John Wiley, 1997. ISBN 0-471-14448-7.
Acknowledgments We would like to thank the reviewers, contributors, and colleagues who helped make this book possible; Dr. Phil Allen, Savoula Amanatidis, Ben Ba, Jan Bissey, Dr. William Black, Jeff Bruce, Alan Buchholz, Dr. Joseph Cavallaro, Brian P. Lum Shue Chan, Irfan Chaudhry, Lisa Dayne, Dr. Ian Galton, Dr. Randall Geiger, John Griffin, Wes Hansford, Aaron Huntsinger, Dr. Bruce Johnson, David Kao, Dr. Joe Karniewicz, Brent Keeth, Dr. William Kuhn, Wen Li, Dr. H. Alan Mantooth, Dr. Richard Marks, Dean Moriarty, Dr. Ken Noren, Dr. Adrian Ong, Dr. James Rochelle, Dr. Terry Sculley, Dr. Stuart Tewksbury, Dr. Don Thelen, Dr. Axel Thomsen, Dr. Vance Tyree, Scott Ward, Veronica Wilson, Dr. JeffWu, and Dr. Kwang S. Yoon. The authors would also like to thank Orbit Semiconductor, MOSIS and HP for allowing us to include their process information and design rules with the text. R. Jacob Baker Harry W. Li David E. Boyce
Part
I CMOS Fundamentals
Chapter
1 Introduction
This chapter discusses the CMOS (complementary metal oxide semiconductor) integrated circuit (IC) design process, how to set up the LASI (LAyout System for Individuals) layout software, and fabrication of CMOS integrated circuits through MOSIS (MOS Implementation Service).
1.1 The CMOS IC Design Process The CMOS circuit design process consists of defining circuit inputs and outputs, hand calculations, circuit simulations, layout of the circuit, simulations including parasitics, reevaluation of the circuit inputs and outputs, fabrication, and testing. A flowchart of this process is shown in Fig. 1.1. The circuit specifications are rarely set in concrete; that is, they can change as the project matures. This can be the result of tradeoffs made between cost and performance, changes in the marketability of the chip, or simply changes in the customer's needs. In almost all cases, major changes after the chip has gone into production are not possible. This text concentrates on custom IC design. A custom-designed chip is often called an ASIC (application-specific integrated circuit). Other (noncustom) methods of designing chips, including field-programmable-gate-arrays (FPGAs) and standard cell libraries, are used when low volume and quick-design turnaround are important. Most chips that are mass produced, including microprocessors and memory, are examples of chips that are custom designed. The task of laying out the IC is often given to a draftsman. However, it is extremely important that the engineer be able to layout a chip (and direct the draftsman on how to lay the chip out) and understand the parasitics involved in the layout. Parasitics are the stray capacitances, inductances, pn junctions, and bipolar transistors, with the associated problems (breakdown, stored charge, latch-up, etc.). A fundamental understanding of these problems is important in precision/high-speed design.
Part I CMOS Fundamentals
4
Define circuit inputs and outputs (Circuit specifications)
Hand calculations and schematics
Circuit simulations
No
Layout
Re-Simulate with parasitics
No
Does the circuit meet specs? Yes Prototype fabrication
Testing and evaluation
No, Fab Problem
Does the circuit meet specs?
No, Spec Problem
Yes Production
Figure 1.1 Flowchart for the CMOS IC design process.
5
Chapter 1 Introduction
1.1.1 Fabrication CMOS integrated circuits are fabricated on thin circular slices of silicon called wafers. Each wafer contains several individual chips or "die" (Fig. 1.2). For production purposes each die on a wafer is usually identical. Added to the wafer are test structures and process monitor plugs (sections of the wafer used to monitor process parameters).
A dice fabricated with other die on the silicon wafer --""
D
~ D =
Wafer diameter is typically 5 to 8 inches.
Top view Side view
Figure 1.2 CMOS integrated circuits are fabricated on and in a silicon wafer.
The ICs we design and layout using LASI can be fabricated through MOSIS [1] on what is called a multiproject wafer; that is, the wafer consists of chip designs of varying sizes from different sources (educational, private, government, etc.). MOSIS combines multiple chips on a wafer to split the fab cost among several designs to keep the cost low. MOSIS subcontracts the fabrication of the chip designs out to one of many commercial manufacturers, including Orbit and HP. The view we see when laying out an IC is always a top view of the die. When laying out the chip, we draw boxes or polygons on differing layers indicating how to assemble the circuit. We may specify a box on layer 1 (n-well) from the coordinates (0,0) to the coordinates (10,10). The coordinates of this box and other shapes defining the circuitry are specified in a binary file using Calma Stream Format (abbreviated CSF, GDSII, or simply GDS). This file describes the completed chip design. When using the LASI program, TransportabLe LASI Cell files (TLC files) are used to store the design information. When the design is finished, the TLC files can be converted to a GDS file and sent via the Internet to MOSIS for fabrication.
1.2 Using the LASI Program The LASI program discussed in this text is a powerful CAD (Computer-aided design) package used in the design of integrated circuits. This section discusses the installation and operation of LASI in the DOS environment. Installing LASI
To install LASI, place the LASI disk accompanying this text or downloaded from the Internet into the a: floppy. From the DOS prompt type:
6
Part I CMOS Fundamentals C:\>a:2install
Answer the installation instructions, selecting "yes" for installing the setups and modifying the autoexec.bat file, and run the tutorial supplied with the program. When finished, reboot the computer. Note that a DOS mouse driver must be installed if not running under Windows. After the installation is complete, your hard disk should have a directory C:\LASIS containing all executable files and directories C:\LASIS\CN20, C:\LASIS\MOSIS, and C:\LASIS\2UCHIP containing the setups for the CN20 process, MOSIS and MOSIS 2 urn processes, respectively. The autoexec.bat file should have had C:\LASIS added to the beginning of the PATH statement. To verify that the path is set correctly, type "set" at the DOS prompt (after rebooting the computer). If the path is not set correctly, use the edit autoexec.bat command to manually add C:\LASIS to the PA TH statement. If your autoexec.bat file does not have a PATH statement, simply add PATH C:\LASIS; at the beginning of the file. The PATH statement permits LASI or any LASI program to run from any directory on the hard disk. Drawing Directories Under the C:\LASIS directory should be a directory \TUTOR containing the example of a bipolar op-amp supplied with LASI. All chip designs should reside in a directory other than the LASIS directory. The \LASIS directory is used only for the executable programs in the layout system. The directory of a chip design can be a subdirectory of \LASIS, similar to \TUTOR above, or a directory somewhere else on the hard disk. Throughout the book we will be using Orbit's CN20 CMOS process. Change directories into the \LASIS\CN20 directory and verify that the setups were successfully copied into the directory. Starting LAS! Weare now ready to run the LASI program. At the DOS prompt, from within the drawing directory, type "lasi" or C:\LASIS\CN20>lasi The screen shown in Fig. 1.3 should appear (in color). Help The LASI layout system comes with a complete on-line manual. To use the manual at any time, while LASI is running, press Fl. Pressing F1 while the mouse cursor is over a command button will give information related to the command button. The manual can also be accessed without LASI running by typing, within the directory shown, the following: C:\LASIS\>lhi
Chapter 1 Introduction
7
I Ib PRHPLOI PGLPLOI
GDS2ILC ILC2GDS
a:u ~ IT
I
PRO
CIF2ILC ILC2CIF
5. Z
I
I
LASIDRC LASICIli
DXF2ILC FLAIILC
r- EnvironMent
Current CeII Is PADFRAHE Drawing Directory is C:,LASI5,CN20 Running Under Windows 2048K XNS/267K DOS Bytes Free
Cell List Attach IPlport Copy ForM Scale
r-r-
Dialog Area
-:-
Show Kill ReHafll8
ReSize
ReRanlt CelSort ILCin ILCout DOS Quit
FI=Help
ESC=Cancel
Virtual Object Managed
Figure 1.3 LASI startup screen.
1.2.1 Cells in LASI Complex IC designs are made from simpler objects called cells. A cell might be a logic gate or an op-amp, To show a listing of the cells in this drawing directory, select List from the commands. LASI will show that the drawing directory is empty. Click, with the mouse, anywhere on the screen to return to the previous screen (the system screen). TLC Files
Cells in LASI are backed up using transportable LASI cell files (or TLC files for short). The setup files that were copied into the CN20 directory during installation contain several TLC files. By selecting the TLCin command (running LASI from the C:\LASI5\CN20 directory), we can convert these TLC files into a binary format (files with the *.BP5 and *.CL5 extensions) for use with the LASI program. Pressing the TLCin command button will begin this process (do this now). Specifying "." for the source path indicates the current drawing directory. Specifying "*" for the cell names will convert all TLC files in the directory into *.BP5 and *.CL5 format. The cells in the LASI drawing directory are backed up, normally on a floppy, using the TLCout command button. In Fig. 1.4, pressing "y" to "All Correct & Ready," and then "y" to overwrite any existing cells in the drawing directory (at this point, none should exist) will cause several cells to be changed into LASI binary format. Using the List command button and clicking on the cell "rulel" puts us into the drawing display (cell mode). Using the Fit command button will center the contents of the cell in the window. The result is seen in Fig. 1.5.
8
Part I CMOS Fundamentals
I Ib.
i,-,-_om
~ ~ Jr
GDSZTLC TLCZGDS
PRO
CIF2TLC TLC2CIF
5.2
I
I
LASIDIIC LASICKT
DXFZTLC FLATtLC Cell List Attach I..port Copy
Current Cell is PADFRAME Drawing Directory is C:,LASIS,C"ZO Running Under Windows Z048K XHS/Z61K DOS Bytes Free
For" r-
Scale Show Kill
Dialog Area
TLC -) Drawing Source Path ? . Cell "a.... (s) if Any? • All Correct a Ready? (yor
HeMa....
n)
ReSize ReRonl< CelSort TLCin I TLCout DOS I Quit
III
Virtual Object Managed
Figure 1.4 Using the TLCin command.
RULE I (I) I 0 Cells Using Layer Table
2 BolCes
22 Paths sDrw IDrw Info Show
.. f1:lcrons
J-:.1
?O
WIDTH
i'.O
J-.2 SPACE:
,
,
: :"""".(j-.-, :... ~1·2": ..---,r: f
l
,
: I
I
Sort Arc Attr Hcpy
.,. :-1"':
J
l
cCel cStz
cLyr cwth Layr Wdth sUin rWin Fit Xpnd
+ +
.. 0&-
Zoo.. Cntr Draw Grid wGrd dGrd View Open Obj TelCt Add Del Get Put fGet fPut tGet tput cCet. cPut aPut wGet
JD
N·.. '_.[. L·. .
I"
~"J "-,--,., •
~
.....
~
••.••
Y=]2.45 Get (pt. I ) I -,X>.:=,-,2",4,;-.","5-==--;-=~=~ wGrd=1u.. dGrd 1UM Obj=BQX Layr=COIIT
qMou Hou Cpy pBeg Cut - : List
Figure 1.5 LASI display after opening the file containing rule 1.
cHou uStp pReu pEnd Join
Cell
Chapter 1 Introduction
9
Toggling Menus
Notice, in Fig. 1.5, that clicking the RIGHT mouse button causes some of the menu items to change or toggle between different commands. Again, a menu item can be selected using the LEFT mouse button. Return to the System menu by selecting the Sys command in the bottom left corner of the command buttons. If the Sys command is not shown, click the RIGHT mouse button once. Creating a Cell
To begin the layout of a new cell, the Cell command is used. The cell is assigned a name, for example, AND, and a rank. Since the AND gate is a basic building block, we will assign a rank of 1 (the lowest rank). If a cell is created that uses the AND gate cell, then the new cell will be assigned a rank of 2 or higher. That is, a cell with a rank of 2 can contain cells with a rank of 1. If the cell has a rank of 5, then it can contain any cell with a rank of 4 or lower. Another analogy is to consider a chip, a printed circuit board, and a computer. A chip can be put on a circuit board, and the circuit board can be put into a computer. Using the ranking analogy, the chip has a rank of 1, the circuit board has a rank of 2, and the computer has a rank of 3. Therefore, the computer with rank 3 cannot be put into the chip with rank 1. Create a cell called "test" for experimentation by selecting the command Cell and entering the name "test" with a rank 1. The bare test cell is shown in Fig. 1.6. Notice in the top left corner that the cell name and rank are displayed. TEST I I ) I 0 Cells Using Layer Table
0 BDxes
0 Paths
I
0 Vb
Iiw
ulcIDllINIOIR!T
sDrw Info Sort Attr cCel cLy.Layr
IDrw Show
Arc Hcp!! cSI", cWth Wdth sWin rWin Fit Xpnd 4l'
.. ,j.
Zoo .. Cntr
~:-: ..
"
.•
"
Cet IPt.1) I X=31.5 wCrd=lu" dGrd=lu" Obj=BOX
Y=11.25 Layr=COHT
Draw Crld wGrd dCI'd View Open Obj Text Add Del Get Put fCet fPut tGet tPut cGet cPut aPut wGet qHou cHou Hou uStp Cpy pAeu pBeg pEnd Cut Join List Cell
Figure 1.6 LASI display using the layer table, CONT selected as the current layer, Box selected as the current object. and grids are set at 1 !lID.
10
Part I CMOS Fundamentals
1.2.2 Navigating LASI Notice in Fig. 1.6 that the cross-hairs show the location of the origin. Pressing R in the top right corner (or typing r on the keyboard) of the display turns this reference designator on or off. Now hit the Draw command. This command redraws the screen with (or without) the reference cross-hairs showing. Press r so that the reference designator is showing. Placing the mouse cursor over the origin causes the distance indicator at the bottom of the display to read (0,0). The distance indicator shows the distance away from the origin. If the indicator is showing distances of 106 or larger (l06 urn is 1 meter), you are viewing the entire drawing universe. Selecting the Fit command with nothing drawn could easily result in this situation. To get back to a display that shows tens of microns, simply select the Zoom command and then double click, with the LEFT mouse button, on the reference designator. If you cannot find the reference designator, select Fit, keeping in mind that R in the top right of the display should be highlighted. One other useful command is the Orig command. This command allows the user to set the origin at any location in the drawing display. Grid
The grid can be turned on and off by clicking on the Grid command button. The grid will not display when "zoomed out." Cursor
The cursor can be changed between a small-cross and full-screen cross-hairs by pressing the Tab button on the keyboard. Measurements
By pressing z on the keyboard, a zero reference point is established independent of the origin. When the spacebar is pressed, the distance between the mouse cursor and the zero reference point is displayed. Pressing w causes the mouse to snap to the working grid.
1.2.3 Adding Objects Select the Layr' command to display the layer table used in this process. From the layer table with the LEFT mouse button, select layer 1, the n-well. Notice that the selected layer is displayed at the bottom of the screen. Now select Obj or the object command. The object command will accept three arguments, "b" for box, "p" for path (or polygon), or the name of a cell if we want to add a lower ranking cell to the current cel!. Type "b" for box and hit Enter. Now the bottom of the drawing display should show that the working and dot grids are 1 urn, the object is a Box, and the layer "nwel." We are now ready to begin drawing the layout.
I Again, remember that if the command is not showing, pressthe RIGHT mouse button to toggle between menus.
Chapter 1 Introduction
11
Click on the Add command with Obj = BOX and Layr = NWEL. Click the LEFf mouse button in the drawing area over the origin once. Move the mouse toward the top right corner of the display until you get a box similar to the one shown in Fig. 1.7 and click the LEFf mouse button again. Using the arrow keys on the keyboard or the command buttons, change the display view. Now select Fit and notice that the n-well is centered in the drawing display. The Xpnd command will expand the view. Notice how the viewing area increases. Use the Zoom command to zoom in on the corner of the n-well box by drawing an imaginary box around one of the corners of the n-well box. When drawing, it is often useful to show a grid in the drawing area. The commands wGrd and dGrd are used to change between the working (the grid the cursor snaps to) and dot (the one you see) grids. For the setups included with this book, both grids are set to 111m. Using the Set command, the user can set the number of working and dot grids as well as the grid spacing. It is not recommended that any of the settings be changed until the user becomes very familiar with LASI. TEST (I) I 0 Ce II s Using Layer Table
I Boxes
0 Paths
I
0 \/tx
Iiw
UICIDiIlltjOjRIT
sDrw IDrw Show Arc IIcpy cSiz cLyr cWth Layr Wdth sWln rWln Fit Xpnd
Info Sort Attr cCel
. : : :-·_~--~-~---_·-.--_·_-~_·_-~-.-:'_-~~-:--~--·-r· ..•
I
.••
. i , , ,.
I
l : , ,,i '" .
I
"
:. . :. , :.
.,
...
"
..
I
. . . i
. . . • .- - --- - ---. _.- - - _.• - --- - .-- - ----_.- - ••._! .
Add (Box Pt. Il I X=25 wGrd=luM dGrd=luM Obj=BOX
Y=24 Layr=ItWEL
.....
-+ .j.
Cntr Draw Grid wGrd dGrd
ZOOM
View Obj Add Get fGet tGet cGet aPut qHov Mov Cpy pBeg Cut List
Open
Text Del
Put fPut tPut cPut wGet cHou vStp pReu
pEnd Join
Cell
Figure 1.7 Drawing a box in LASI.
1.2.4 Editing Objects Only one basic operation, moving, can be performed on a Box after it has been added to a cell. The entire box or any of the four sides can be moved. This operation consists of getting the object or side to be moved and performing the move, and then putting the object back (de-selecting the object).
12
Part I CMOS Fundamentals
Using the previously generated n-well layout as an example, use the Get command and select the right side of the n-well box using the mouse. This is done by clicking the LEFT mouse button on the left of the side and then again on the right, ensuring the box drawn by the mouse intersects the side. Objects that are selected using Get should be highlighted. Next, select the Mov command. Using the LEFT mouse button, click once somewhere in the display. Move the mouse a small distance to the left and click the LEFT mouse button again. Notice that the highlighted side moved an equal distance to the left of its original position. Use the Put command to unselect the highlighted side. A simpler method of unselecting all of the active elements is to use the aPut (all put) command. Sometimes we may want to get the entire box. The fGet (full get) command allows dragging the mouse through a portion of the object to select the entire object. Try selecting the entire box using fGet and then unselecting it using aPut. LASI also has the feature that allows the user to execute a set of commands by pressing a single key. This is easily accomplished by adding a line to the form.dbd file. For more information, read the on-line help (by pressing Fl).
Viewing and Editing Specific Layers Suppose that it is desired to view only a few layers of a complicated layout. This can be accomplished by selecting the desired layers using the View command. The user needs to be warned, however, that if the invisible layers are not made visible again, frustration could abound. The Open command determines which layers can be selected using the Get command. This feature allows the user to make certain layers uneditable. In the current drawing, select the Open command and unselect the n-well layer. Return to the drawing area by clicking the RIGHT mouse. Attempt to get any part of the n-well box and notice that none of the sides can be highlighted or edited in any fashion. Highlighting the n-well layer under the Open command will then allow any editing operations on that layer. This command could also be frustrating if the user forgets that certain layers are unselectable.
1.2.5 Placing Cells Select Cell from the command button and make another cell. Call the new cell test2 and assign a rank of 2. Next, using the Obj command, use the previously laid out cell (test) as the new object. Using the Add command, add the cell, test, to the cell test2 by simply clicking the LEFT mouse button in the drawing area. Repeat this several times until the layout is similar to Fig. 1.8. Remember that if a cell has a rank equal to or greater than the cell you are currently editing, nothing will happen if the cell is Added to the current one.
13
Chapter 1 Introduction
TEST2 (2) I 4 Cells Using La....r Tablo
0 Boxes
0 Paths
I
0 Utx
IIw
ulclDlllHlolRIT
,
..
__... 1. ••••
~
lDrw Info Show Sort Arc Attr Hcp"" cCol cSlz cL..,r cWth L....,r Wdth sWin rWin Fit Xpnd -+ sDrw
l'
-;
- - ---- - --- ----
ZOOM
...
Cntr
Draw Grid
+-- - - - -- - - - --
wGrd dGrd
View Obj Add Get fGet tGet cGet ..Put
-1-········
Open
Toxt Del Put fPut tPut cPut wGet
qHou cHou
+- - - -- - - - - -- - - - --
Add (Cell pt.) I X=-15 Y=30 wGrd=luft dGrd=lUft Obj=TEST
+- - - - - - -- - - - - - - - --'
Hou uStp Cpy pReu pBeg pEnd Cut Join List Cell
Figure 1.8 Inserting the cell, test, using the Add command.
Viewing Complex Layouts Cells can be drawn as outlines using Outl (Fig. 1.9). The mouse is used to enclose the cell you want drawn as an outline. Using the Full command draws the entire cell. This becomes helpful when a large number of cells are present and the redraw time is long. Also, cells will be drawn as outlines if the ESC key is pressed when LASI is redrawing the screen or the Dpth command is used. The Dpth command is used to draw cells as outlines if they are nested deeper than the cells depth setting. Moving Cells Moving a cell consists of getting the cell using the cGet (cell get) command, moving the cell using the Mov command, and putting the cell using the aPut (all put) or cPut (cell put) commands. Displaying Cells When cells are drawn as outlines, using the Outl command, the names, on the outline, can be displayed or hidden by pressing n on the keyboard (indicated by N in the top right corner of the drawing display). If the cells are not drawn as outlines, pressing i on the keyboard draws a dotted line around the cell. This is useful as a reminder of which parts of the layout are cells and which parts are boxes or polygons. A Note on Editing Only objects that are drawn in the current cell can be edited. The objects resulting from adding a cell to the current (open) cell cannot be edited. Trying to change the size of
14
Part I CMOS Fundamentals
any of the n-well boxes of Fig. 1.8 from the test2 cell (the open cell) would result in frustration. To change the size of these boxes, we must first open the test cell. TESt2 (2) I 4 Cells Usi!!!l La.... tahle
0 Boxes
0 Paths
0 Vb
Iiw
UICID III" 10 IRIr
DD DO Out! (Pt.!) I X=70.35 wG..d=!uM dGrd=!UM Obl=tESt
Y=9.75
I rDrw DOS
Out! Set Hake Step Dpth tLy.. .Win Fit
Full FOrM SMsh Res Cap tSiz ..Win Xpnd
ZOOM
Cnt..
...,. .....
Draw Grid wGrd dGrd
View Obj Add Cat fGet tGet CGet aPut '1Hou "ou Rot ReSz OuSz Sys
OPen text Del Put fPut tPut cPut aGet wHou uDup Flp Snap Orig
UnDo
Figure 1.9 Using the Outl command.
Saving Your Work LASI can automatically generate a TLC file in the drawing directory each time the cell mode is entered or exited. This is specified by including the line "mise = autoTLCout" in the form.dbd file in the drawing directory. A backup to floppy should also be made periodically using the TLCout command button on the system mode.
Understanding the UnDo Command Using the UnDo command with argument "c" restores the cell to the state it was in when it entered the cell mode. It does not simply undo the last command executed. This command can cause major loss of information if the cells are not backed up periodically. More information regarding this command can be found in the on-line manual. Normally, an argument of "d" can be used to undo a delete or move.
1.2.6 Common Problems After adding an object, the object cannot be seen. Check the View layers in the drawing display to ensure that the layer is not in hidden mode. The Draw command must be used after using View.
Cannot Get an object.
Chapter 1 Introduction
15
(1) Check, using the Open command, that the layer can be opened (or moved). (2) Verify that the object is not part of another cell. (3) When trying to get an object made using the path or polygon object, make sure the cursor encompasses a vertex.
The menu doesn't redraw when the Layr button is pressed.
The layer table is not being used. Press CNTRL-ENTER so that the top left corner of the display shows "Using Layer Table." Cells are drawn as outlines, or the perimeter of a cell has a dashed line.
(1) Use the Full command to show the contents of a cell. (2) Use the Dpth command to limit the depth of the cells shown. Increasing the depth to the rank of the cell shows all cells. (3) Press i on the keyboard to force an outline to be drawn around a cell. This is indicated by the I in the top right corner of the drawing display. The Fit command causes the drawing window to expand much larger than the current cell.
There is an unknown object someplace in the cell. Use the fGet command to get any objects outside the main cell area. Use the Del command to delete the unknown object. LAS! or any other LAS! program that uses XMS memory when run under DOS does not use XMS memory when run under Windows 3.1.
Use Windows PIP editor to allocate at least 2048 KB of XMS memory in the PIP file for that program. The cursor movement is not smooth.
The cursor may be in the octagonal mode. Press "0" on the keyboard or the button "0" in the top right portion of the display to toggle this mode on and off.
1.3 MOSIS The MOSIS 2 IC fabrication service is available to universities provided they have access to the Internet, software for layout and simulation, and the capability to test the completed designs. The instructor must contact MOSIS and submit a proposal for funding. If the proposal is funded, the university will have an account set up with the dollar amount determined by the number of students in the CMOS course. At the present time, funding from NSP 3 for introductory classes is $620 per two students. This is the cost of one "tiny chip" fabricated in a 2.0 11m process measuring 2.2 mm by 2.2 mm edge to edge. A minimum quantity of four chips is supplied with each order. Commercial companies and non-US univerisities may also fabricate ICs through MOSIS but receive no US government funding. MOSIS - MOS Implementation Service through the Information Sciences Institute at the University of Southern California, (310) 822-1511 or http://www.mosis.org
2
3
National Science Foundation
16
Part I CMOS Fundamentals
After an account has been established by MOSIS and the university has an account number, completed chip designs can be submitted in UUEncoded GDS (UUGDS 4 ) format or CIF (CalTech Intermediate Form). This text will only describe the fabrication process using GDS format. For information regarding CIF, contact MOSIS. To translate a TLC file into GDS format, simply select the TLC2GDS command button on the LASI system menu. The screen shown in Fig. 1.10 will appear. Here, the name of the highest ranking cell, that is, the cell to be fabricated, is QCELL.TLC. All cells used in QCELL.TLC will be converted into GDS format and placed in the binary file QCELL.GDS (this is transparent to the user). Of course, the TLCout command must be executed prior to calling the TLC2GDS utility. The conversion process is started by selecting "Go" on the screen in Fig. 1.10. Additional information concerning a TLC to GDS conversion can be found by pressing the Help button in Fig. 1.10. LASI TLC to GDSII Converter
Help
Version 5.2
Text
Conversion Setup - - - - - - - - - - - Hain ILC File to be Converted Ha"e of GDS File to Hake GDS
Librar~
~QC~E=L~L.~I~LC~
Datat~pe
I -;-
Ha"e DEFAULT.DBD
to Use
2....J
La~er!!....J
~
~QC~E=LL~.~G~DS~
Ph~sical Unit (u" or "ill!!!!..-.J LASI Units per Phys Unit ~
Layer 64 to
,
~
Scale Unit LSB Correction
2....J
Default Line Width "-0.'-Layer Filter _-
Sort in Ascending Rank Order Convert Ha"es to Lowercase
!J ~
Hafte of Report File or Printer
I I
La"bda Size in u" I. GDS Units per Ph~s Unit 1000
Hake
_ _
Convert An~ Iext In Onl~ Proper Poly !J
~IL~C~2G~D~S~.R~P;I
___
l' 01-
IAB=Houe
Figure 1.10 Converting TLC files to GDS format.
To translate the binary GDS file (QCELL.GDS) into an ASCII file (QCELL.UUE) suitable for transmitting to MOSIS, the following command is used: C:\LASI5\1DAHO> uuen -j qcell.gds qcell.uue The executable file UUEN.EXE is located in the C:\LASI5 directory. The switch "j" creates a Unix-compatible ASCII file. UUEncoding is used to change a binary file such as the GDS file generated with the TLC2GDS into an ASCII file for transmission over the Internet. Here UUGDS is a UUEncoded GDS file.
4
17
Chapter 1 Introduction
The final step, before submission of the file to MOSIS, is to run the checksum program (CKSUM.EXE) located in C:\LASI5 on QCELL.UUE, or C:\LASI5\IDAHO> cksum qcell.uue The result is two numbers; the layout-checksum and the byte count. These numbers are used in the submission process discussed below. Submission of Chips to MOSIS
The basic submission of chips to MOSIS consists of requesting an ID for a new project, submitting the project for check, and requesting the project be fabricated. Checking the status of the chips and changing or canceling project parameters can also be performed before the chips are sent out, from MOSIS, for fabrication. A project ID can be requested from MOSIS by sending an appropriate e-mail address to
[email protected] for each of the chip designs that will be fabricated. The MOSIS command language syntax is used when communicating with MOSIS. When making this request, the user must specify several items, as illustrated in the following example. The project check is used to ensure that the ASCII file containing the UUGDS specifications of your chip does not get corrupted when transmitted over the Internet. If the GDS file is accepted, the users will be notified. The user can then instruct MOSIS, via the Internet, to fabricate the chip. Example 1.1 Submit a chip to MOSIS for fabrication using Orbit's 2.0 11m n-well process (CN20). Information on this process is given in Appendix A and is used throughout the text. Step I: Request New Project ID
Assuming that MOSIS specified an account number of l23-ABC, the password is WINFECT, and the instructor's name is SMITH, note that the first step in submitting a chip for fabrication is to send MOSIS an e-mail requesting a new project ID (the e-mail message is shown below). Again the e-mail address is
[email protected]. REQUEST:
NEW-PROJECT
ACCOUNT:
123-ABC
D-NAME:
SMITH
D-PASSWORD:
WINFECT
P-NAME:
CHIP1
P-PASSWORD:
UNIVER
PHONE:
(123) 456-7890
TECHNOLOGY:
FORESIGHT-CN20
18
Part I CMOS Fundamentals SIZE:
2160 X 2160
PADS:
40
PACKAGE:
DIP40
QUANTITY:
4
DESCRIPTION:
HIGH SPEED OP-AMP
REQUEST:
END
The part name and password are defined by the user. It was assumed that the pads were designed by the students and measured 180 urn square; that is, the outline of the pads is 180 urn, while the actual pad is 100 urn on a side (see Ch. 3). The resulting padframe measures 2160 11m by 2160 11m. The "PADS:" line specifies the number of pads on the chip. The description line of the request file is also defined by the user. MOSIS replies to the above request with an ID number such as 876543. The MOSIS system is automated so that precise syntax is required. Step 2: GDS File Submission
To submit the chip for project check, send the message shown below. The final cell that references all the other cells is the "TOP-STRUCTURE" cell. This cell is the chip that will be fabricated. REQUEST:
SUBMIT
ID:
876543
P-PASSWORD:
UNIVER
LAYOUT-CHECKSUM:
1234561234
LAYOUT-FORMAT:
UUGDS
TOP-STRUCTURE:
QCELL
LAYOUT: Insert UUGDS file here REQUEST:
(qcell.uue). Do not add characters. END
If the file is received uncorrupted, MOSIS responds by sending an e-mail
message to the user stating that the project is ready to be queued for fabrication. For some chip designs, the UUGDS ASCII file will be very large. MOSIS has the capability to FTP large design files from the user. The LAYOUT statement can be changed, in the submission above, so that this is possible. The general form of the LAYOUT statement is LAYOUT-FTP-PATH: !hostname!usemame!password!filename
Chapter 1 Introduction
19
where "!'' is used as a delimiter and hostname is the name of the computer connected to the Internet where the design file resides. An example is LAYOUT-FTP-PATH: !mycom. univ.edu!anonymous!guestlpu b/chips/qcell. uue
where the entire statement must fit on one line. Step 3: Queuing the Projectfor Fabrication
Queuing the project for fabrication occurs by sending REQUEST:
FABRICATE
ID:
876543
P-PASSWORD:
UNIVER
REQUEST:
END
MOSIS will respond a short time after receiving the message, showing that the chip is in the queue for fabrication. When the chip is actually sent to the foundry, the user will be notified. Information about the status of the chip while being fabricated is available via anonymous FTP or the WorId Wide Web (http://www.mosis.org). Consult the MOSIS user's guide and the on-line information for additional information on submitting a chip for fabrication and the fabrication schedule. • To summarize the procedure for submitting a chip to MOSIS for fabrication, begin with a LASI-generated TLC file. Then 1.
Using the command button TLC2GDS on the LASI system menu, generate a Calma Stream Format (GDS) binary file.
2.
UUENCODE the GDS file. The result is a UUGDS (ASCII) file.
3.
Next, the checksum program, cksum.exe, is run on the UUGDS file. results in the generation of two numbers: checksum and byte count.
4.
Send MOSIS a request for a new project ID (assuming you already have an account).
5.
Submit the UUGDS file to MOSIS for syntax check (not a design rule check).
6.
After MOSIS replies that the file has no syntax errors, submit the fabrication request.
This
Other Information
The MOSIS user's manual with additional information and extensive examples is located at http://www.mosis.orglmanual.html. A postscript file containing the MOSIS scalable design rules is located at ftp://ftp.mosis.org/pub/mosis/designrules/ scmos-rules-rev7.ps
20
Part I CMOS Fundamentals
REFERENCES [I]
W. Tanner, MOSIS User Manual, Release 4.0, August 1994. Also located at http://www.mosis.org/manual.html.
[2]
D. E. Boyce, LASI Users Manual, available by pressing FI while running LASI or may be printed by running the MANUAL.EXE program included with the LASI system files.
PROBLEMS For the following problems, use the LASI setups given in Appendix A and in the C:\LASI5\CN20 directory for the CN20 process. 1.1
Create a cell called test3 with a rank of I using LASI. In this cell, draw a 10 11m by 10 11m box using the poll layer. Place the lower left corner of the box at the origin. Use the "z" (used to set the zero point) and the spacebar to measure the distance between opposite corners.
1.2
Explain how the qMov command can be used to edit the box in Problem I so that it measures 5 x 8 f.lID2. How would this be accomplished using Get, Mov, and Put?
1.3
What functions do the sWin and rWin commands perform?
1.4
What functions do the cGet and cPut commands perform?
1.5
The Text command allows text to be used for labeling in LASI. The tLayr selects which layer the text will be written in, while the tSiz sets the size of the text in 1.5 urn increments. Write the word "test" on the metl layer with sizes of 3, 9, and 24 urn in the test3 cell of Problem 1. Show the result without using the reference mark. (The reference mark is removed by pressing t on the keyboard or by selecting the T in the top right corner of the drawing display, remembering to execute a Draw command afterward.) Labeling is extremely important in layout.
1.6
Create a cell named test4 with a rank of 1. Generate the layout shown in Fig. PI.6a in this cell. The text and boxes are written using the metl layer. Next create a cell named test5 with a rank of 2. Add the test4 cell into the test5 cell five times as shown in Fig. P1.6b. The cGet and Mov commands may come in handy at this point. Next draw the cells as outlines, shown in Fig. Pl.6c, using the Outl command. Note that we could have used the Cpy command to copy the layout in test4 five times and avoid adding the test5 cell. The problem with this is that as the layout becomes complicated the memory required in a "flat" cell increases dramatically. The hierarchical layout using the nested cells keeps memory usage to a minimum. The Cpy command should be used as little as possible.
21
Chapter 1 Introduction
B
(a)
(b)
(c)
Figure Pl.6 1.7
Polygons or paths can be drawn using LASI by setting the Obj to "p" (instead of "b" for box). Setting the Wdth size to 0 causes LASI to draw polygons, while setting the width greater than 0 causes LASI to draw paths. When finished drawing a path or polygon, use the aPut command. Using LASI, copy the layout shown in Fig. P1.6a using the polygon object.
1.8
What part of an object made using the polygon or path must be encompassed to Get the object?
1.9
Using the poll layer, draw a triangle that measures nominally 10 urn on each side. How many vertices does the object have?
1.10
Circles can be drawn using a polygon (path with zero width) and the Arc command. Consider the layout shown in Fig. Pl.IO. Copy this layout in LASI. Begin by adding a vertex at point A using the Add command. This is followed by selecting the Arc command, moving and clicking the mouse in the desired center of the circle, and returning and clicking the mouse at point A. The
22
Part I CMOS Fundamentals bottom of the display will then inquire how many segments should be used and which direction to draw, that is, counterclockwise or clockwise. Hit the Enter key to both of these questions, and LASI will draw the following circle.
A>!:
Figure P1.10
1.11
Pressing Fl on the keyboard within the LASI program calls the LASI help file. What would be added to the end of the form.dbd file in a drawing directory so that F2 performs the LASI command Fit and F3 performs an aPut? Frequently used commands can be executed using function keys to help speed up layout time.
1.12
Using the Dpth command, show how the cells in Fig. P1.6b can be drawn as outlines. What does the depth level mean? Show that, by pressing i on the keyboard (or top right corner of the drawing screen), the cells are also drawn as outlines.
1.13
What do the keyboard buttons w, D, a, z, and space do in LASI?
1.14
Describe how to add text in LASI and how to set the text size and layer.
1.15
Using LASI, show example layouts that show the difference between path objects and the poly objects. Use polyl in your examples. How do you Get a poly or path object?
Chapter
2 The Well
In order to develop a fundamental understanding of CMOS integrated circuit layout and design, we begin with a study of the n-well. This approach will build a solid foundation for understanding the performance limitations and parasitics (the pn junctions, capacitances, and resistances inherent in a CMOS circuit) of the CMOS process.
2.1 The Substrate CMOS circuits are fabricated on and in a silicon wafer as was discussed in Ch. 1. This wafer is doped with donor atoms, such as phosphorus for an n-type wafer, or acceptor atoms, such as boron for a p-type wafer. Our discussion will center around a p-type wafer. When designing CMOS integrated circuits with a p-type wafer, n-channel MOSFETs (NMOS for short) are fabricated directly in the p-type wafer, while the p-channel transistors, PMOS, are fabricated in an "n-well." The substrate or well are sometimes referred to as the bulk or body of a MOSFET. CMOS processes that fabricate MOSFETs in the bulk are known as "bulk CMOS processes." The well and the substrate are illustrated in Fig. 2.1, though not to scale. Often an epitaxial layer is grown on the wafer. We will not make a distinction between this layer and the substrate. Some processes use a p-well or both n- and p-wells (sometimes called twin tub processes). A process that uses a p-type substrate with an n-well is called an "n-well process." The process described in Appendix A, CN20, is an n-well process. The n-well acts as the substrate or body of the p-channel transistors. Another important consideration is that the n-well and the p-substrate form a diode (Fig. 2.2). In CMOS circuits, the substrate is usually tied to the lowest voltage in the circuit to keep this diode from forward biasing. Ideally, zero current flows through the substrate connection.
24
Part I CMOS Fundamentals
n- ell Flip chip p-type epi layer (p-)
)
on its side and enlarge p-type substrate (p+)
MOSFETs are not shown. n-well p-substrate
Usually, we will not show the epitaxial layer. Many processes don't use the epi layer.
Figure 2.1 lllustration of the top and side view of a die.
Besides being used for fabricating p-channel transistors, the n-well can be used as a resistor. The voltage on either side of the resistor must be large enough to keep the substrate/well diode from forward biasing.
2.1.1 Patterning CMOS integrated circuits are formed by patterning different layers on and in the CMOS wafer. Consider the following sequence of events that apply, in a fundamental way, to any layer we need to pattern. We start out with a clean, bare wafer as shown in Fig. 2.3a. The distance given by the line A to B will be used as a reference in Figs. 2.3b-j. Figures 2.3b-j are cross-sectional views of the dashed line shown in (a).
_ - - - - - Resistor leads
n-well
p-substrate
Figure 2.2 The n-well can be used as a resistor.
Chapter 2 The Well
25
B
A
_FDr_ cross section cut along dotted line
I
p-type
(b) Cross-sectional view of (a)
(a) Unprocessed wafer
A
B
I Photoresist Oxide
p-type (c) Grow oxide (glass or Si021 on wafer.
A
'
. : : : : : ~L~ . :SPACE: : : .... : il:· O :: ::::
.
:_~
l .
: :. 1(-:"':1.:{ :: . , '0 . . . . . .
.: .. :~.).•...
.
'-'·-'-"1
.
i
.
..
i
·:"'::·2·~·
..
: .. ; .
.... :1· ..'. .. N. ~~JELl •
G
•
Figure 2.7 Design rules for layout of the n-well.
30
Part I CMOS Fundamentals
2.2.2 Using the LASIDRC Program To perform a design rule check (DRC) of a layout, simply select the LASIDRC at the LASI system menu. Enter the name of the cell (see below) to be checked and type cn20.drc as the name of the check file. Since we only know two design rules at this point, that is, from Fig. 2.7 checks 1 and 2, the beginning check should be I and the ending check should be 2. To start the program, select Go on the top of the LASIDRC screen. If there is an error, a bit map of the n-well in blue will be displayed with the error in white. You can exit LASIDRC and go to LASI to fix the problem. When you return to LASIDRC, you can continue your checking at the check you failed.
DRCArea The design rule check will be performed on the section of layout shown in the drawing display just prior to calling the LASIDRC program. To DRC the entire cell, press the Init command button on the LASIDRC screen shown below. This feature can be used to decrease the time it takes to perform a DRC by DRCing only the specific areas of interest. LASI
La~er
I
Help
Logic Design Rule Checker
I
Read
I
I
DOS
x
Version 5.2 Init
I
He..
Quit
Go
Checking Setup - - - - - - - - - - - - - - - - - - . lIa..e of Cell to DRC
iIiIIf9-
11_ of Check File "'CII2"""'O."'D""RC"----
Starting Check lIu..ber
!-J
Resolution:
--'
Distance·
--'
-:-
Scan Window Left -48.55u.. Scan Window Botto" -4.140" Enable HCPY Operator HCPY CO....and Line
~
11_ of Report File or Printer
---' Finishing Check
"u~er ~
Check Area Left Chock Area Botto.. - - - - - - !
I Scan WI ndow RIght 118. 05u .. I Scan WI ndow Top 129. 14u.. Enable PAUSE Operator
!J
-'I
~
.,.. ,a.. TAB=Moue
2.3 Resistance Calculation In addition to serving as a region in which to build PMOS transistors, n-wells are sometimes used to create integrated resistors. The resistance of a material is a function of the materials resistivity, p, and the materials dimensions. For example, the slab of material in Fig. 2.8 between the two leads has a resistance given by
31
Chapter 2 The Well
etWb.
R
(2.2)
Figure 2.8 Calculation of the resistance of a rectangular block of material.
In semiconductor processing, all of the fabricated thicknesses, such as the n-well, are constant. We only have control over Wand L. Also notice that the Wand L are what we see from the top view, that is, the layout view. We can rewrite Eq. (2.2) as R
Rsquare
=
L
(2.3)
Rsquare' W
is the sheet resistance of the material in Q/square.
Example 2.2 Calculate the resistance of an n-well that is 10 11m wide and 100 11m long. From the Orbit electrical parameters in Appendix A for CN20 we see that the sheet resistance of the n-well varies from a minimum of 2,000 Q/square to a maximum of 3,000 Q/square, with a typical number of 2,500 Q/square. So the typical resistance between the ends of the n-well is
R
=2
,
500. 100 11m 10 11m
= 25kQ
•
When laying out resistors using the "path" object, n-well, poly, or some other layer, LASI has a resistor calculator that will help in the calculation of nonrectangular resistances. Often, to minimize space, resistors are laid out in a serpentine pattern. The corners, that is, where the layer bends, are not rectangular. This is shown in Fig. 2.9a. All sections in Fig 2.9a are square, so the resistance of sections 1 and 3 is Rsquare' The equivalent resistance of section 2 between the adjacent sides, however, is approximately 0.6 RsqUllre' The overall resistance between points A and B is therefore 2.6 Rsquare' The layout shown in Fig. 2.9b uses wires to connect separate sections of a resistor avoiding corners. Avoiding corners in a resistor is the generally preferred method of layout in analog circuit design where the ratio of two resistors is important.
32
Part I CMOS Fundamentals
..---B
Layout (top view) 2
B
3
(a)
(b)
A
A
Figure 2.9 (a) Figure for the calculation of the resistance of a comer section and (b) layout to avoid corners.
2.3.1 The N-well Resistor At this point, it is appropriate to show the actual cross-sectional view of the n-well after all processing steps are completed (Fig. 2.10). The n+ and p+ implants are used to increase the threshold voltage of the field devices; more will be said on this later in Ch. 4. Notice in Appendix A, the Orbit electrical parameters, that the sheet resistance of the n-well is measured with the field implant in place, that is, with the n+ implant between the two metal connections in Fig. 2.10. Not shown in Fig. 2.10 is the connection to substrate. The field oxide (FOX; also known as ROX or recessed oxide) will be discussed in Ch. 4 when we discuss the active and poly layers.
...-------. .--
Metal
Metal
FOX
FOX
.J
n+ active implant
p+ field Implant n+ field implant
p-substrate
Figure 2.10 Cross-sectional view of n-well showing field implant. The field implantation is sometimes called the "channel stop implant".
2.4 The N-well/substrate Diode Placing an n-well in the p-substrate forms a diode. Therefore, it is important to understand how to model a diode for hand calculations and in SPICE simulations. In particular, let's discuss diodes using the n-well/substrate pn junction as an example [2]. The DC characteristics of the diode are given by the Shockley diode equation, or
33
Chapter 2 The Well
ID =
Is(e~
(2.4)
- 1)
The current ID is the diode current; Is is the scale (saturation) current; Vd is the voltage across the diode where the anode (p-type material) is assumed positive with respect to the cathode (n-type); and VT is the thermal voltage which is given by ~ where k = Boltzmann's constant (1.3806 x 10⁻²³ joules per degree kelvin), T is temperature in kelvin, n is the emission coefficient (a term that is related to the doping profile and affects the exponential behavior of the diode), and q is the electron charge of 1.6022 x 10⁻¹⁹ coulombs. The scale current and thus the overall diode current are related in SPICE by an area factor. The SPICE circuit simulation program assumes that the value of Is supplied in the model statement was measured for a device with a reference area of 1. If an area factor of 2 is supplied for a diode, then Is is doubled in Eq. (2.4).
2.4.1 Depletion Layer Capacitance N-type silicon has a number of mobile electrons, while p-type silicon has a number of mobile holes (a vacancy of electrons in the valence band). Formation of a pn junction results in a depleted region at the p-n interface (Fig. 2.11). A depletion region is an area depleted of mobile holes or electrons. The mobile electrons move across the junction, leaving behind fixed donor atoms and thus a positive charge. The movement of holes across the junction, to the right in Fig. 2.11, occurs for the p-type semiconductor as well with a resulting negative charge. The fixed atoms on each side of the junction within the depleted region exert a force on the electrons or holes that have crossed the junction. This equalizes the charge distribution in the diode, preventing further charges from crossing the diode junction and also gives rise to a parasitic (depletion) capacitance.
Anode
--w
Cathode n-type
p-type 00000
o ---i o
0
0
0
0
0
0
0
0
000 0
0
eGGS
e e
••••••• ••••••• ••••••• • ••••••
Depletio region
Geee
Two plates of a capacitor
Figure 2.11 Simple illustration of depletion region formation in a pn junction.
The depletion capacitance, Cj , of a pn junction is given by CjO
(2.5)
34
Part I CMOS Fundamentals
CjO is the zero-bias capacitance of the pn junction, that is, the capacitance when the voltage across the diode is zero. Vd is the voltage across the diode, m is the grading coefficient (showing how the silicon changes from n- to p-type), and f 2 , when the current in the diode becomes 10 percent of ~ , we can define the diode reverse recovery time, or (2.10)
2.4.3 SPICE Modeling The SPICE (simulation program with IC emphasis) diode model parameters are listed in Table 2.1. The series resistance, R, ' deserves some additional comment. This resistance results from the finite resistance of the semiconductor used in making the diode and the contact resistance, the resistance resulting from a metal contact to the semiconductor. At this point, we are only concerned with the resistance of the semiconductor. For a reverse-biased diode, the depletion layer width changes, increasing for larger reverse voltages (decreasing both the capacitance and series resistance, of the diode). However, when we model the series resistance, we use a constant value. In other words, SPICE will not show us the effects of a varying R;
Example 2.4 Using SPICE, explain what happens when a diode with a carrier lifetime of 30 ns is taken from the forward-biased region to the reverse-biased region. Use the circuit shown in Fig. Ex2.4 to illustrate your understanding. We will assume a zero-bias depletion capacitance of 1 pF. The SPICE netlist for this circuit is shown below.
38
Part I CMOS Fundamentals
10k
Figure Ex2.4 Diode storage time. 10TRR D1 R1 31 10k Vin 30 DC 0 PULSE(10 -10 SOn .1n .tn SOn .ModeITRR D + IS=1.0E-15 TT=30E-9 CJO=1E-12 VJ=.7 M=0.33 .probe .tran 1 n 1oon .end
ioom
Figure 2.16 shows the current through the diode (scaled), the input voltage step, and the voltage across the diode. One of the interesting things to notice about this circuit is that current actually flows through the diode in the negative direction, even though the diode is forward biased. During this time, the stored minority carrier charge is removed from the junction. The storage time is given by t
s
= 30 ns . In 0.93 rnA + 1.07 rnA = 18 8 ns . 1.07 rnA
which is close to the simulation results. Note that the input pulse doesn't change until 50 ns after the simulation starts. This ensures a steady-state condition when the input changes from 10 to-1O V. • Name
SPICE
Is Rs
IS
Saturation current
RS
Series resistance
n
N
Emission coefficient
Vbd
BV
Breakdown voltage
Ibd
mv
Current which flows during Vbd
CiQ
CJO
Zero-bias pn junction capacitance
,----------Insulator Insulator Insulator
(
Figure 3.2 Layout of a metal2 pad with pad opening for bonding connection.
Pad layer Metall same size as meta12
Via _ _-Jo
100 urn
< Metall
"
100~m
:>
Overglass opening
Insulator Insulator Insulator FOX
Figure 3.3 A bonding pad using metall and metal2.
48
Part I CMOS Fundamentals
·metall and 2:
Figure 3.4 Expanded comer view of a pad.
3.1.2 Design Rules for Pads Figure 3.5 shows the design rules for the bonding pads. The bonding pad size we will use is 100 urn by 100 urn. The ovgllayer (cuts in the passivation) should be a square, 90 urn on a side, centered in the pad, that is, 5 urn from the metal edge. The pad-to-pad spacing must be at least 75 urn, Note that the bonding pad design rules are not checked byLASIDRC. Example 3.1 Layout a 40-pad frame for a MOSIS tiny chip. The size of the tiny chip, from Ch. I, is 2.2 mm by 2.2 mm. If we assume that ten pads are on each of the four sides and the corners are open, that is, contain no pads (see Fig. 3.6), then we can divide the length of a side by the sum of the number of pads and the corner areas to get the pad cell size, or 3
Cell size
to =2.2 X1210- =183 urn rounded ~ 180 urn
The chip, or die size, that we will have using a pad cell size of 180 urn is 2160 urn by 2160 urn, Figure 3.7 shows the pad placed in a box, made using the outline layer (layer 58), of 180 urn square. The outline layer has no effect on fabrication. This layer is used to help align the cells when we place them in a higher ranking cell. Figure 3.6 shows the entire padframe. •
Chapter 3 The Metal Layers
~.1
o
~.3
o
49
MAXIMUM PAD OPEN1NG IN A lOOX100 mloron METAL PAD 1000RGLASSl
~Ox90
METALl AND METAL2 PAD 51ZE
JOOxl00
M[NIMUM PAD METAL TO PAD METAL SEPARATlON
J5
~.
6'0t
t •• t .. d
PAD
Figure 3.5 Design rules for the bonding pads.
2160 urn
2160 urn Figure 3.6 Layout of a 40-pad padframe. Final dimensions 2160 urn by 2160 urn,
50
Part I CMOS Fundamentals
180 m Outline layer for alignment
8
:::1.
o
..... 00
40 urn
Figure 3.7 Layout of a pad using the outline layer.
3.2 Design and Layout Using the Metal Layers As mentioned earlier, the metal layers are used to connect the resistors, capacitors, and MOSFETs in a CMOS integrated circuit. We had a taste of the metall and 2 layers in the last section. In this section, we begin by discussing the design rules for the metal layers. The parasitic resistances and capacitances of these metal layers are then discussed. 3.2.1 Design Rules for the Metal Layers
The metal and via design rules are shown in Figs. 3.8 through 3.10. The complete set of design rules is given in Appendix A. The minimum width and spacing of metals I and 2 is 311m. Also shown in these figures is the contact layer. This layer connects metall to p+, n+ or the poly layers. At this point, we will concern ourselves with metal I , metal2, and the via layers. 3.2.2 Parasitics Associated with the Metal Layers
The basic parasitic resistances and capacitances associated with the metal layers can be calculated from the information given in Appendix A. The main parameters we are interested in are the sheet resistances of the layers, the capacitance between the metal layers and active, poly, substrate, and between one another. Also, there is a finite contact resistance of the via. The following examples illustrate some of the unwanted parasitics associated with these layers.
Chapter 3 The Metal Layers
51
QlicrOn'i
~h"ck"
g..1 WroTH
;J.O
~3
g..2 SPACrNG
.)3.0
g..3 OVERLAP OF CONTACT
,,1.0
J.4 J.5
g..4 OVERLAP OF VIA
.7.0
.76
6.
METAL 1
o
Figure 3.8 Metall design rules.
~lcron.
J.1 SPACE TO CONTACT J.2 SIZE (EXCEPT FOR J.3 SPACING !,cllv" or
PADS)
J. .0
J.7
.f.Ox2.0
'-8
.)3.0
J.9
poly
J
D
"
A pnp transistor with possible substrate injection.
p-substrate
Figure 4.3 Layout of a 10 urn by 10 urn diode using the n-well as the cathode. 811cronlii
Ghel:~
J.X2 J..o
P
§.2 SPACING §.3
J..O
§.l
CONTACT SIZE (EXACTLY)
POLY OVERLIlP
J8 J9
§.4
ACTIVE lJVER-AP
J.O
JO
§.5
POLY CCNTACT TO ACTIVE EDGE
.;J.O
Jl
¢>.6
ACTIVE CONTACT TO GATE
J.O
J2
.
. . ..... ...............
;;;::::::;:::::::::;:;:::;:
n.:.:ilL .----
-
,
.
-.I 14- -.I 14- ~. 4 §.2 -.I 14- §.5
p.
CONTACT
Figure 4.4 Contact design rules.
69
Chapter 4 The Active and Poly Layers
ln
Diodemade
VDD
g
the n-well/p-
Bonding pad
Bonding pad
~
Diodemade usingsubstrate/n+ (a)
Parasitics of n+ (b)
Figure 4.5 Two methods of protecting againstESDdamage.
limit the current through the pad and the n-e/substrate diode to protect against negative transients and the breakdown voltage of the diode to protect against positive transients. Positive transient protection can also be achieved by adding the p-i/n-well diode of Fig. 4.5a. This scheme can be thought of as a distributed resistor/diode, difficult to analyze analytically. Normally, a combination of both schemes are used together with good power and ground busses to provide a low-resistance path for removal of the unwanted charge.
Example 4.2 Modify the pad discussed in Ex. 3.1 to include the diode protection given in Fig. 4.5a. Also include power (VDD) and ground (VSS) busses on the pad. The completed pad is shown in Fig. 4.6. Note that VSS is connected to the substrate via p+ and that VDD is connected to the n-well under part of the pad by way of n+. Also notice that the n+ and p+ areas extend beyond the boundary of the outline of the cell. This is used when the cells are abutted together. The n+ and p+ areas overlap, giving a continuous connection around the die. At least two of the bonding pads must be connected to the VDD and VSS busses. •
4.1.2 Design Rules for Poly1 The design rules for polyl are shown in Fig. 4.7. Polyl is used in making the MOSFET gates and with poly2 capacitors. As we will see in Chapter 7, there is an additional layer of poly named poly2. This layer is used for making capacitors with polyl. Poly2 can also be used to form MOSFETs. However, in order to keep the design rule checks to a minimum, we will assume that only poly! can be used to make MOSFETs and that poly2 use is limited to capacitors.
70
Part I CMOS Fundamentals
J
I
Figure 4.6 Pad with ESD diodes and power busses.
",.1
WIDTH
s
J.2
SPACE
JO
:).3
GATE OVERLAP OF ACTIVE
:).+
ACTIVE OVERLAP
,;l.5
FIELD POLYI TO ACTIVE
;3_
OF GATE
POLYl
Figure 4.7 Design rules for poly!.
Jl ¢lot t.e s ted
¢lot t.e e ted
Chapter 4 The Active and Poly Layers
71
Consider the layout shown in Fig. 4.8. Polyl is drawn over the n+ active area. As we will see later in the chapter, the poly will block n+ diffusion, keeping the area under the poly (gate of the MOSFET) from becoming n+. The width of the poly intersecting with the active area is called the drawn width, while the length of the poly over active is the drawn length. The drawn width and length are the Wand L used to specify the size of a MOSFET. Notice that the n+ regions are implanted through the thin gate oxide (GOX). Also note that the poly over the field oxide (FOX) forms a MOSFET called the field MOSFET, an unwanted parasitic. The FOX is the field MOSFETs gate oxide. An implant is used (see Fig. 2.10) to increase the threshold voltage of the field device so that it cannot turn on.
4.2 Layout of a Standard Cell Frame When laying out n-channel and p-channel transistors, as shown above, it is easy to forget about the bulk connection, that is, the p-substrate for the n-channel transistors and the n-well for the p-channel transistors. Complicating things is the need for VDD and VSS connections throughout the circuits. Using a standard cell frame can solve both of these layout requirements. The frame provides VDD and VSS busses in addition to tying down the substrate and well. The drawback of the standard cell frame is increased layout size. Figure 4.9 shows a standard cell frame that can be used for layout. The width of the outline in this figure is 60 urn, while the height is 120 urn. The metall labeled VSS is connected to p+ (under metall), which makes an ohmic contact to the p-substrate. This connection sets the substrate potential to VSS. Using the standard cell frame, we won't have to concern ourselves with the substrate connection of the n-channel transistors. The n-well in the top portion of the standard frame cell is connected to VDD by the n+ under the metal 1 labeled VDD. The p-channel transistors are drawn in the n-well, while the n-channel transistors are drawn in the bottom portion of the frame. If, while doing layout, the width of the frame is too narrow, we simply add the frames end to end. Similarly, when laying out a system, we can place the cells end to end, which automatically routes VDD and VSS.
4.3 Patterning the Active Layers In Ch. 2 we described how to pattern the n-well. This can be thought of as making the substrate for the p-channel transistors (unless we are using the n-well as a resistor or as part of a diode). The region outside the active regions as defined by the n+ and p+ masks is called the field region. The field region is used to isolate the active regions. The oxide in this region is called Field OXide (FOX) or Recessed OXide (ROX). Using oxide to isolate the active regions is called LOCal Oxidation of Silicon, or LOCOS for short. Figure 4.10 shows the general patterning steps used in creating the active areas and MOSFETs. We assume that the n-well locations on the die have already been
72
Part I CMOS Fundamentals
pol ld
1 n+
Cross section shown below
Drawn length
Poly!
Gate oxide {
n+ p-substrate Poly!
,/
p-sub Angled view without other insulating layers.
Figure 4.8 Layout of a MOSFET, cross-sectional and angled view.
Chapter 4 The Active and Poly Layers
73
Figure 4.9 Standard cell frame. processed (Figs. 4.1Oa and b). The first step is to cover the active areas in the p-substrate and n-well with a stress relief oxide. Nitride, SiN3 , is deposited on top of the stress relief oxide (Figs. 4.10c and d). This thin oxide acts like a cushion for the nitride. The areas not covered by the nitride, that is, the p-substrate areas, are implanted with a p field implant, (Fig. 4.1Oe), for increasing the threshold voltage of the field devices. This implant is used to increase the threshold voltage of the field MOSFETs, the devices formed by poly over the FOX. Not shown in Fig. 4.10 are the steps involved in implanting the n-type field implant used to raise the threshold voltage of the field MOSFETs in the n-well region. After the field implants are in place, the FOX is grown (Fig. 4. l Of), and the nitride and stress relief oxides are removed. At this point we should point out an unwanted characteristic of LOCOS, namely, bird's beak. Consider Fig. 4.11a. This figure shows the layout of a 10 urn by 10 urn n+ active area with a poly gate. Figure 4.11b shows the cross-sectional area with field oxide in place. (This is a 90° rotation from the cross-sectional view shown in Fig. 4.8.) Notice that the oxide has encroached upon the area defined by the n+ active mask. The shape of this encroachment is sometimes referred to as bird's beak. We will refer to this attribute of LOCOS as simply oxide encroachment. This encroachment will affect the width of the MOSFETs. In other words, the width of the MOSFET will be decreased by two times the length of the oxide encroachment. The BSIM SPICE model discussed in Ch. 6 gives the parameter DW, or delta width, to describe the oxide
74
Part I CMOS Fundamentals
. Fpc cross section
A
~
\
p-type cut along dotted L1 -=---'-.:...line (a) Wafer with n-well defined (b) Cross-sectional view of (a)
A
____
B
defi ed by n+ and p+ active areas
i
p-type (c) Define n+ and n-well areas and grow thin/stress relief oxide
p-type
r
(d) Deposit nitride over stress relief oxide
(1) Growth of the field oxide
(e) Implant of p+ in field region
'-Yi::>~l
p+ implant
~
I
J
Gate oxide p-type
p-type
(g) Remove nitride and stress relief oxide
r,._ .
(h) Deposit gate oxide and poly Resist
~.~~-:J -channel MO ..S..FE.T
\t
n+ active areas source and drain areas
p.
p-type
(i) Implant n+ source and drain regions
(j) Implant p+ source and drain regions
Figure 4.10 Sequence of events used in MOSFET formation.
75
Chapter 4 The Active and Poly Layers
encroachment. If the drawn width of the MOSFET gate is W, then the effective width is given by Weff= Wdrawn -DW
(4.1)
The parameter DW is equal to twice the oxide encroachment. The BSIM SPICE model will automatically subtract DW from the drawn width. (The drawn width is the W specified by the engineer in the SPICE simulation.)
Example 4.3 Assuming the drawn width of the MOSFET in Fig. 4.11 is 10 urn, estimate the effective width after oxide encroachment. From the BSIM model parameters for the n-channel MOSFET in Appendix A, DW (dw) = 0.1355 urn; therefore, the actual or effective width of the MOSFET shown in Fig. 4.11 is 9.87 urn. Notice that the smaller the drawn width of the device, the larger effect the oxide encroachment has on the effective width. • Let's return to the sequence of events in Fig. 4.10. The next step in the process is to grow the thin gate oxide and deposit the poly (Fig. 4.10h). This is followed by depositing resist, to isolate the n+ areas, and n+ implant. The result is shown in Fig. 4.lOi. This is our basic MOSFET structure. From a circuits point of view, several important events occur during these last steps of MOSFET fabrication. When the poly is deposited, it is doped "in situ" to decrease its resistivity. For CN20 the gate is an n+ doping. When the n+ implant is applied to the wafer, the poly, which is used as a mask to keep the n+ from going under the gate region', is doped further. The Il-l- poly gate also acts as a mask for the p-channel transistors. The doping introduced by the p+ implant is not sufficient to significantly change the doping levels in the polysilicon gate. Typically, sheet resistances for poly are on the order of 20 Qlsquare. In order to lower the sheet resistance of the poly, a refractory metal and poly mixture called silicide is deposited to the top of the polysilicon. This silicide/poly sandwich is referred to as a polycide gate. Typical sheet resistances of polycide gates are 2-3 Qlsquare. The Orbit process (CN20) we are using does not silicide the gate regions. Another important thing happens when we implant n+ and p+. The dopant atoms diffuse under the gate of the MOSFET. This effect is shown in Fig. 4.12. As can be seen in this figure, the lateral diffusion (LD) subtracts from the drawn gate length. The level 2 SPICE model uses LD to define the lateral diffusion. The BSIM model defines DL (dl), or delta length, to be two times LD. The effective channel length is given by L eff = Ldrawn - 2 . LD = Ldrawn - DL
(4.2)
This is termed a "self-aligned" CMOS process because the gate automatically becomes aligned to the drain and the source regions of the MOSFET.
2
76
Part I CMOS Fundamentals
Cross section shown below
:~t,~~n:w~g~:·:.::::···,
. . :i:»»'·
(a)
DWI2
II
This distance is the oxide encroachment
DIWI~
poly FOX
FOX
Gate oxide Surface of the wafer before oxidation
(b)
Bird's beak
FOX (c)
Angled view Figure 4.11 Layout used to illustrate oxide encroachment
Example 4.4 Assuming the drawn length of the MOSFET in Fig. 4.12 is 2 urn, estimate the effective length of the MOSFET after lateral diffusion. From the BSIM model parameters for the n-channel MOSFET given in Appendix A, DL = 0.64 urn and therefore the effective length of the device is 1.36 urn.•
77
Chapter 4 The Active and Poly Layers
n+ cross section shownbelow
FOX
FOX
p-substrate
LD
LD
Lateral diffusion underthe gate
Figure 4.12 Layout used to illustratelateraldiffusion.
The BSIM model will automatically calculate the effective width and length of the MOSFET when given the drawn lengths and widths. The level 2 model will only calculate the effects due to lateral diffusion. (We!! must be given by the designer.)
4.4 Layout of the MOSFET The layout of the MOSFET without contacts (connections to a circuit) was shown in Figs. 4.8, 4.11, and 4.12. Consider the layout shown in Fig. 4.13 of a MOSFET with connections to the source, drain, and gate. Note that the source and drain of the MOSFET are interchangeable. The substrate connection of the MOSFET is not shown in this figure. Placing the MOSFET in the bottom of the standard cell frame of Fig. 4.9 provides the substrate connection. Using the pad of Fig. 4.6 in a padframe anchors the substrate to VSS around the die. P-channel MOSFETs, which are laid out in the n-well, must have a well tie down, that is, an n+ region connected to VDD or the source of the MOSFET. 4.4.1 Parasitics Associated with the Active Layers
Associated with the source and drain implants (n+ and p+) is a sheet resistance. We can get the sheet resistance from the tables in Appendix A or directly from the BSIM model parameters. The n-channel transistor has n+ source and drain regions, while t~e p-channel transistor has p+ source and drain regions. The sheet resistance of the n+ implant is given in the n-channel BSIM model by "rsh" (= 27.9 Q).
78
Part I CMOS Fundamentals
G
•
Figure 4.13 Layout of a 211m (= L) by 311m (= W) n-channel MOSFET with metall wire connections. Substrate connection not shown.
Example 4.5 Estimate the resistance of the following layout (311m wide and 100 11m long) made using the n+ implant. Neglect corner effects.
This layout is an n+ resistor with a value of R = 27.9· 1~0 '" 930 Q . • The depletion capacitance of the n+ and p+ regions consists of a bottom component and a sidewall component (see Fig. 4.14). The zero-bias depletion
Chapter 4 The Active and Poly Layers
I
79
capacitances are given in the BSIM model by cj (bottom, F/m 2) and cjsw (sidewall, F/m). The built-in potential of the bottom and the sidewall is pb and pbsw respectively, and the grading coefficients of the bottom and sidewall are mj and mjsw, respectively. These parameters are given in the BSIM model. The depletion capacitance can be calculated knowing the area of the drain (or source) and the perimeter, for the n+ to bulk, by C
cj· AD jdep
= (
1+ V
DB
cjsw· PD
)mj
+(
ph
"=
1+
(4.3)
)mjs>
qNA
=
2€.s;l4>s-4> FI qNA
(5.7)
where NA is the number of acceptor atoms in the substrate, 4>s is the electrostatic potential at the oxide-silicon interface, and the electrostatic potential of the p-type substrate is given by
kT NA thF=--ln't' q n,
(5.8)
where n i is the intrinsic carrier concentration of silicon (= 14.5 x 10⁹ atoms/em'), The depletion region in the p-type semiconductor is void of mobile holes. The absence of holes in this region leaves a net negative charge due to the immobile acceptor atoms that remain behind. This charge is equal to the charge attracted under the gate. The charge/unit area is given by (5.9) If the surface electrostatic potential at the oxide interface, 4>s, is simply the same as the bulk electrostatic potential o» (i.e., 4>.1 = 4>F and then Q~ = 0), the MOSFET is operating
in the accumulation mode, or the MOSFET is OFF in circuit terms. At this point both The number of holes at the oxide-semiconductor surface is NA , the same concentration as the bulk.
4>.1 and 4>F are negative numbers.
Chapter 5 The MOSFET
89
As VGS is increased, the surface potential becomes more positive. When G>s = 0, the surface under the oxide has become depleted (the carrier concentration is n). When G>s = -G>F (a positive number), the channel is inverted (electrons are pulled under the oxide forming a channel), and the electron concentration at the semiconductor-oxide interface is equal to the substrate doping concentration. The value of VGS when G>s = -G>F is arbitrarily defined as the threshold voltage, VTHN • Note that the surface potential changed a total of 2G>F between the strong inversion and depletion cases. For VGS = VTHN (G>s given by
=- G>F), the fixed negative charge in the depletion region is (5.10)
with units of coulombs/m'. Up to this point we have assumed that the substrate and source were tied together to ground. If the source of the n-channel MOSFET is at a higher potential than the substrate, the potential difference is given by VSB ; the negative charge present in the depletion region then becomes (5.11) Example 5.2 For a substrate doping of 1015 atoms/em', VGS = VTHN and VSB = 0, estimate the electrostatic potential in the substrate region and at the oxide-semiconductor interface, the depletion layer width, and the charge contained in the depletion region and thus the inverted region under the gate.
The electrostatic potential of the substrate is G>F =
kT
NA
lOIS
-q- In 1ii = -26 mV . In 14.5 x 109 = -290 mV
and therefore the electrostatic potential at the oxide semiconductor interface (VGS e., is 290 mY. The depletion layer width is given by
= VTHN) ,
2· 11.7· (8.85 x 1O-18F/Jlm)(2· 0.29V) (1.6 X 1O-19....£...)(1015!!!£!!!:!)(~)
1---"'-------=----=----;:-----'- = atom
em3
0.866 Jlm
1012~m3
and the charge contained in this region, from Eq. (5.10) or (5.9) with G>s = -G>F by Q'
bo
3
= qN A X d = (1.6 x 1O-19---L) (1015 atoms) ( cm )(0.866I1m) atom em" 1012Jlm3 r= 139 aC
Jlm2
which is the charge contained in the depletion region or oxide-semiconductor interface. Note that this is true only when VGS = VTHN • •
90
Part I CMOS Fundamentals Consider the MOSFET shown in Fig. 5.7. We will assume that the applied Vos
= VTHN so that the preceding discussions and assumptions hold. The potential across the
gate-oxide capacitance, C~x, is simply
Q~ Cox
(5.12)
VBC = - ,
The surface potential change, Vc (= ~s), from the equilibrium case is 2F. (The absolute voltage of the channel is 0 V; that is, the source, drain, and channel are at ground.) The potential needed to change the surface potential and overcome the depletion layer charge is given by Q~ Cox
(5.13)
VB=-, - 2F
An additional positive charge exists at the silicon-oxide interface due to imperfections during growth of the gate oxide or as the result of an ion implantation used to adjust the threshold voltage of the MOSFET. We will call this positive charge Q~s with units of coulombs/area. Equation (5.13) may be rewritten including these surface charges as (5.14)
The final component needed to determine the threshold voltage is the contact potential between point D (the bulk) and point A (the gate material) in Fig. 5.7. The potential difference between the gate and bulk (p-substrate) can be determined by summing the difference between the materials in the MOS system shown in Fig. 5.8.
Gate
Vos = V THN
A
-Q~
p-sub
-VSB Figure 5.7 Calculation of the threshold voltage.
Chapter 5 The MOSFET
91
Adding the contact potentials, we get ($G-$OX)+(OX-F)=G-F. The contact potential between the bulk and the gate poly, we will assume n+ poly with doping concentration ND, poly' is given by ,r.
'I'ms
=,r. _,r. = 'I'G 'I'F
kT I [ND,PO!y] kT I NA q n n, + q n n,
(5.15)
The threshold voltage, VTHN , is given by VTHN
=
Q~-Q~s 21t. It. C' - 'I'F- 'I'ms ox
(5.16) Q~-Q~
(5.17)
C~x
=-$ms-2$F+
Q~-Q~s C~x
+
J2qEsiNA
C~x
When the source is shorted to the substrate, VSB or simply zero-bias threshold voltage as VTHNO
fh:IJ
[J 12G>FI+vSB -t I2G>FI
(5.18)
=0, we can define a zero substrate bias
=-ms- 2$F+
Q~C'- Q~s
(5 19) .
ox
We can define a body effect coefficient or body factor by
Y= Metal1
J2qEsi NA , Cox
(5.20)
Metal 1
Bulk (substrate connection) Polvsilicon
Si02
p-substrate
Gate
G>G
ox
G>F
Figure 5.8 Determining the contact potential between poly and substrate.
92
Part I CMOS Fundamentals
Equation (5.18) can now be written as VTHN = VTHNO+~ I2
Q~ - Q~s + Q~ C'
(5.25)
ox
Example 5.5 Estimate the dose required to change the threshold voltage, in Ex. 5.4 without sodium contamination, to 1 V.
From Eqs. (5.24) and (5.25) and the results of Ex. 5.4 qN]
VTHNO
This gives N[ =563
X
=-126 mV + -,= 1 V Cox
9
10 atoms/em'. •
These calculations lend some insight into how the threshold voltage is affected by the different process parameters. In practice, the results of these calculations do not exactly match the measured threshold voltage. From a circuit design engineer's point of view, the threshold voltage and the body factor are measured in the laboratory. Measurements are performed when the BSIM model parameters (discussed in the next chapter) are extracted. The design engineer then has measured data available in the form of the BSIM model parameters.
5.3 IV Characteristics of MOSFETs Now that we have some familiarity with the factors influencing the threshold voltage of a MOSFET, let's derive the large-signal IV (current/voltage) characteristics of the MOSFET, namely operation in the triode and the saturation regions. The following
94
Part I CMOS Fundamentals
derivation is sometimes referred to as the gradual-channel approximation. The charge distribution in the channel is assumed to be essentially constant.
5.3.1 MOSFET Operation in the Triode Region Consider Fig. 5.9 where VGs > VTHN , so that the surface under the oxide is inverted and Vvs > 0, causing a drift current to flow from the drain to the source. In our initial analysis, we will assume that Vvs is sufficiently small so that the threshold voltage and the depletion layer width are approximately constant. Initially, we must find the charge stored on the oxide capacitance C~x. The voltage, with respect to the source of the MOSFET, of the channel a distance y away from the source is labeled V(y). The potential difference between the gate electrode and the channel is then VGS - V(y). The charge/unit area in the inversion layer is given by Q~h = C~x . [V os- V(y)]
(5.26)
However, we know that a charge Q~ is present in the inversion layer from the application of the threshold voltage, VTHN , necessary for conduction between the drain and the source. This charge is given by Q~ = C~x . VTHN
(5.27)
The total charge available in the channel, for conduction of a current between the drain and the source, is given by the difference in these two equations, or
Q~(Y) = C~x . (V os - V(y) - VTHN)
(5.28)
where Q~ is the charge in the inverted channel.
Gate
Vcs > VTHN
Vvs
Drain
Channel
p-sub
Figure 5.9 Calculation of the large-signal behavior of the MOSFET in the triode (ohmic) region.
Chapter 5 The MOSFET
95
The differential resistance of the channel region with a length dy and a width W is given by ell. sheet Res. r
\
1 . dy JlnQ~(Y) W
dR=
(5.29)
where J..l n is the average electron mobility through the channel with units of cmi/v-sec. The mobility is simply a ratio of the electron (or hole) velocity ern/sec to the electric field, Vfcm. This parameter is used, in the BSIM model parameters, to fit the IV curves of the SPICE models to the measured results. Also, for short channel devices, the mobility decreases when the velocity of the carriers starts to saturate. This causes the effective sheet resistance in Eq. (5.29) to increase, resulting in a lowering of the drain current. The differential voltage drop across this differential resistance is given by dV(y)
=I D . dR =
ID
f'
dy
(5.30)
WJlnQ,(y)
or substituting Eq. (5.28) and rearranging ID' dy = WJlnC~xCVGS - V(y) - VTHN)' dV(y)
At this point, let's define the transconductance parameter for a MOSFET. n-channel MOSFET, this parameter is given by I ~ KP n -- Jln . Cox - u, . TOX
(5.31)
For an (5.3 2)
and for a p-channel MOSFET, it is given by _ , Eox KP p - Jlp . Cox - Jlp . TOX
(5.
33 )
where J..l p is the mobility of the holes in a PMOS transistor. Typical values of KP in the CN20 process are 50 JlA/V2 and 17 JlA/V2 for n- and p-channel transistors, respectively. The current can be obtained by integrating the left side of Eq. (5.31) from the source to the drain, that is, from 0 to L and the right side from 0 to Vvs' This is shown below: L
f
VDS
I D dy = W' KP n o
'
f (V
GS -
V(y) - VTHN) . dV(y)
(5.34)
0
or ID = KP n
.
~'l (VGS -
VTHN)VDS -
V~S Jfor VGs?: VTHN and VDS s VGS - VTHN
(5.35)
This equation is valid when the MOSFET is operating in the triode (linear) region. This is the case when the induced channel extends from the source to the drain.
96
Part I CMOS Fundamentals
Furthermore, we can rewrite Eq. (5.35) by defining the following transconductance parameter: (5.36) or (5.37) The equivalent equation for the p-channel MOSFET operating in the triode region is ID = KPp
.
W L' (Vsa [
VTHP)VSD -
2VS2D]
for Vsa;;::: VTHP and VSD:::;; Vsa - VTHP
(5.38)
where the threshold voltage of the p-channel MOSFET is assumed to be positive (see Appendix A). In fact, all voltages in Eqs. (5.35) and (5.38) are positive.
5.3.2 The Saturation Region The voltage VeL) in Eq. (5.28) is simply VDS' In the previous subsection, we said that VDSis always less than Ves - VTHN so that at no point along the channel is the inversion charge zero. When VDS = Ves - VTHN , the inversion charge under the gate at L (the drain-channel junction) is zero. This drain-source voltage is called VDS,sat (= Ves - VTHN) , and it indicates when the channel charge becomes pinched off at the drain-channel interface. Further increases in VDS do not cause an increase in the drain current', Figure 5.10 shows that the depletion region between the drain and substrate increases, causing the channel to pinch off. If VDSis increased until the drain-substrate depletion region extends from the drain to the source, the device is said to be punched through. Large currents can flow under these conditions, causing device failure. The maximum voltage, for near minimum-size channel lengths, that can be applied between the drain and source of a MOSFET is set by the "punchthrough" voltage (see Appendix A). For long channel lengths, the maximum voltage is set by the breakdown voltage of the drain (n+) implant/substrate diode, also specified in Appendix A. When a MOSFET is operated with its channel pinched off, that is, VDS ~ Ves VTHN and Ves z VTHN , it is operating in the saturation region. Substitution of VDS,mt into Eq. (5.35) yields
KP n .-. W ( Vas - VTHN )2 =-~( Vas - VTHN )2 I D =--
2
L
2
for VDS;;::: Vas - VTHN and Vas;;::: VTHN
(5.39)
We will see that this is not entirely true. An effect called channel length modulation causes the drain current to increase with increasing drain-source voltage.
1
97
Chapter 5 The MOSFET
Gate
VGS> VTHN
VDS
. .. Charge distributi Charge distribution with V DS > VGS - VTHN at VDS = VGS - VTHN
p-sub
Figure 5.10 The MOSFET in saturation (pinched off).
We can define an electrical channel length of the MOSFET as the difference between the drawn channel length, neglecting lateral diffusion, and the depletion layer width, X dl , between the drain n+ and the channel under the gate oxide by Lelee = Ldrawn - Xdl
(5.40)
Substituting this into Eq. (5.39), we obtain a better representation of the drain current ID = KP n . -lL(VGS - VTHN)2 2 Lelee
(5.41)
Qualitatively, this means that since the depletion layer width increases with increasing Vvs the drain current will increase as well. This effect is called channel length modulation. To determine the change in output current with drain-source voltage, we simply take the derivative ofEq. (5.41) with respect to Vvs , or aID =_KPn-lL(VGS- VTHN)2. dLelee =ID' [_l_ dX dl ] 2{ aVDS 2 L eee dVDs LeleedVDS
(5.42)
or if
'A e-
[_1.
dXdl] Lelee dVDS
(5.43)
Typical values for \ ' called the channel length modulation parameter, range from greater than 0.1 for short channel devices to 0.01 for long channel devices. Equation 5.41 can be rewritten, taking into account channel length modulation as ID =
KPn W 2 ' T(VGS -
2
~
VTHN) [1 +/\'e(VDS - VDS,sat)]
(5.44)
98
Part I CMOS Fundamentals
Unless otherwise specified for digital applications, we will assume Ac = O. For analog applications, Ac is normally measured. Also note that in Eq. (5.42) we assumed that the mobility does not vary with VDS ' In the next chapter we will find that this is not true. Figure 5.11 shows typical curves for an n-channel MOSFET. Notice how the device appears to go into saturation earlier than predicted by V DS = V GS - V THN • The actual charge distribution in the channel is not constant but rather a function of VDS • Q'lY) decreases as we move away from the source of the MOSFET, causing Q'lL) to become zero earlier. This is shown in Fig. 5.10. Another reason, especially for short channel devices, why the MOSFET, becomes pinched off earlier is that the mobility is not a constant; that is, the velocity of the electrons saturates above a certain VDS (related to the electric field and channel length), causing VDS,sa, and IDS. sat (the drain current at VDS"va,) to decrease. Shown in Appendix A are the curves for both n- and p-channel MOSFETs of varying sizes, together with the threshold voltage and transconductance parameters for the MOSFETs in the CN20 process, which is what we will use for hand calculations throughout the book.
VDS
=
VGS- V THN
n500uAr--------------------'I;-----------, r a i n
c u r r
e
VGS=5
Triode region or Linear region
n
t
Saturation region VGS=3
VGS=2
'\ Slope of this curve = Ac ' ID
-Ou~=---r-----__..----....,..----...,...---___l
OV a
ID(Ml)
1.0V
2.0V
3.0V
4.0V
5.0V
Vds
Figure 5.11 IV characteristics of a MOSFET.
5.4 SPICE Modeling of the MOSFET In this section we consider the level 1 SPICE model and how it relates to the equations derived in the last section. The level 1 model is a subset of the level 2 and 3 models.
Chapter 5 The MOSFET
99
5.4.1 Level 1 Model Parameters Related to VTHN The following SPICE model parameters are related to the calculation of VTHN , Symbol
Name
Description
VTH NO
VTO
y
Default
IyQ,
Units
Zero-bias threshold voltage 1.0
0.8
Volts
GAMMA
Body-effect parameter
0
0.4
V 112
21(hl
PHI
Surface to bulk potential
0.65
0.58
V
NA
NSUB
Substrate doping
0
lE15 em?
Q',/q
NSS
Surface state density
0
lEIO em?
TPG
Type of gate material
Using Eq, (5.21), we can calculate the threshold voltage, VTHN , given the above parameters. If VTHNO or y is not given, then SPICE will calculate them using the above information and Eqs. (5.20), (5.22), and (5.23). TPG specifies the type of gate material, 1 opposite to SUbstrate, -1 same as substrate, and 0 for aluminum gate. Example 5.6 Using SPICE and the level 2 model given in Appendix A for the n-channel MOSFET, plot ID versus V GS for VSB changing from 0 to 5 V and VDS = 5 V. Assume the device W = L = 5 11m. The circuit schematic, SPICE output and netlist, are shown in Figs. 5.12 and 5.13. Notice that, as we would predict from Eq, (5.21), the threshold voltage increases with increasing source-substrate potential, VSB ' The results of this simulation do not match well with measured results. The inaccuracy of the level 1, 2, or 3 SPICE models in predicting the threshold voltage makes their use limited to basic functionality tests. The BSIM SPICE model of the next chapter should be used in most simulations (see Fig. 6.2). •
5.4.2 Level 1 Model Parameters Related to Transconductance The following SPICE parameters are related to the calculation of the transconductance parameter. Symbol
Name
Description
KP
KP
Transconductance parameter 20E-6
50E-6 AN2
tox
TaX
Gate-oxide thickness
40E-9 m
A
Lambda
Channel-length modulation 0
om
LD
LD
Lateral diffusion
0
2.5E-7 m
/looP
UO
Surface mobility
600
580
Default
lE-7
IyQ,
Units
V-I
cm 2Ns
100
Part I CMOS Fundamentals
••• Top Level Netlist ••• MC5u_5u 2 3 0 4 CMOSN L=5u W=5u VDS20 DC5 VGS30 DCO VSB 04 DCO
vas
.MODEL CMOSN NMOS (level 2 model in App. A) .probe .DC VGS 0 5 .05 VSB 0 5 1 .end
Figure 5.12 Schematic and netlist used in Example 5.6. D lOuA,r----------.----.-----r--r----,--r-----~ r a i n
c u r r
e
n
t
oA,I;o;&;~.iiiiiiii~§§~;::::=---_r_-____r"--,.....--~---l OV D
O.5V l.OV lD(ML5u_5u)
l.5V
2.5V
3.0V
3.5V
4.0V
Figure 5.13 Simulation results for Example 5.6.
The transconductance of a MOSFET is given in terms of SPICE parameters by
/3 = Kp·
Wdrawn Ldrawn - 2 . LD
(5.45)
Eox = U a . c:ox = Ut)> Tax
(5.46)
or, if KP is not specified in the model, KP
The J... parameter was specified above because it affects the large-signal characteristics of the MOSFETs as well as the output conductance.
Chapter 5 The MOSFET
101
5.4.3 SPICE Modeling of the Source and Drain Implants
The following SPICE model parameters are related to calculating the parasitics associated with the source/drain implant regions. Name
Description
Default
Typical
Units
RD
Drain contact resistance
0
40
Q
RS
Source contact resistance
0
40
Q
RSH
Source/drain sheet resistance
0
50
Q/sq.
CGBO
Gate-bulk overlap capacitance
0
4E-1O
F/m
CGDO
Gate-drain overlap capacitance
0
4E-1O
F/m
CGSO
Gate-source overlap capacitance
0
4E-1O
F/m
PB,PBSW
Bottom, sidewall built-in potential
0.8
0.8
V
MJ,MJSW
Bottom, sidewall grading coefficient 0.5
0.5
CJ
Bottom zero-bias depletion capacitance
CJSW Sidewall zero-bias depletion capacitance
0
3E-4
F/m 2
0
2.5E-IO
F/m
IS
Bulk-junction saturation current density
lE-14
lE-14
A
JS
Bulk-junction saturation current density
0
IE-8
Alm2
FC
Bulk-junction forward bias coefficient
0.5
0.5
Example 5.7 Specify the SPICE device statement for the layout shown in Fig. 5.14. Assume that the MOSFET model name is CMOSN.
The width and length of the MOSFET in this figure is 4 and 5 urn respectively. The number of squares in the drain and source regions, NRD and NRS will be calculated next. The number of squares is an approximation, so we neglect the n+ directly under the drain and source contacts. From the figure, the number of squares in the drain (LNRD/W) is 6 firn/4 urn or NRD =1.5. For the source NRS = LNRS/W = 16/4 = 4. If the SPICE model specifies a sheet resistance, RSH, then a resistance, NRD·RSH, due to the n+ (or P+) implant sheet resistance is added in series with the drain of the intrinsic MOSFET model. If the sheet resistance is not specified, then the values of RD or RS are added in series with the MOSFET's drain and source, respectively. One important parameter that is not calculated here is the metal 1 to n+ contact resistance. The value of NRD and NRS can be adjusted to account for this contact resistance, or an external resistor can be added. For a large W/L MOSFET NRD and NRS should always be set to zero.
102
Part I CMOS Fundamentals
.. ·LNRS
L·
Figure 5.14 Layout of Example 5.7.
In order for SPICE to calculate the depletion capacitances of the drain and source, we need to specify the areas and perimeters of these regions. The area of the drain is 6 urn by 6jlm (36 pm') plus 24 pm' (W·LNRD), while the perimeter is 32 urn (neglecting the portion of the drain implant directly adjacent to the gate poly). The area of the source is 100 pm' and the perimeter is 52~. The SPICE statement for a MOSFET, M1 with its drain connected to node 1, gate to node 2, source to node 3, and substrate to node 4 is given by
•
M1 1234 CMOSN L=5u W=4u AD=60p AS=100p PD=32u PS=52u NRD=1.5 NRS=4
5.4.4 Layout of the MOSFET The layouts presented thus far for the MOSFET are for near minimum-size devices. In practice, devices with widths several hundred or even thousand urn are possible. Consider the connection of parallel MOSFETs shown in Fig. 5.15. These MOSFETs Drain
Gate
--tt------1H---~+_--___j
I
Source
Figure 5.15 Parallel connection of MOSFETs used for layout of a large device.
Chapter 5 The MOSFET
103
operate as a single MOSFET with a width equal to the sum of the individual MOSFET's widths, assuming equal lengths. The layout for the circuit of Fig. 5.15 is shown in Fig. 5.16. The drain and source areas are shared between adjacent MOSFETs. Two benefits are achieved with this layout: (1) smaller layout size and (2) reduction of source and drain depletion capacitances. The second benefit is important in analog design or in output driver design where latch-up, discussed in Ch. 11, is a concern. See Ch. 11 for further discussion of layout of large MOSFETs.
Figure 5.16 Layout of a large (width) MOSFET.
REFERENCES [1]
D. A. Hodges and H. G. Jackson, Analysis and Design of Digital Integrated McGraw-Hill Publishing Company, 2nd ed., 1988. ISBN Circuits, 0-07-029158-6.
[2]
R. S. Muller and T. I. Kamins, Device Electronics for Integrated Circuits, 2nd
ed., John Wiley and Sons, 1986. ISBN 0-471-88758-7. [3]
G. Massobrio and P. Antognetti, Semiconductor Device Modeling with SPICE, 2nd ed., McGraw-Hill, 1993. ISBN 0-07-002469-3.
Additional texts covering the operation and modeling of the MOSFET. [4]
Y. P. Tsividis, Operation and Modeling of the MOS Transistor, McGraw-Hill, 1987. ISBN 0-07-065381-X.
[5]
R. F. Pierret, Volume IV in the Modular Series on Solid State Devices-Field
Effect Devices, Addison-Wesley, 1990.
104
Part I CMOS Fundamentals
[6]
D. K. Schroder, Modular Series on Solid State Devices-Advanced MOS Devices, Addison-Wesley, 1987.
[7]
J. Y. Chen, CMOS Devices and Technology for VLSI, Prentice-Hall, 1990. ISBN 0-13-138082-6.
[8]
S. M. Sze, Physics of Semiconductor Devices, 2nd ed., John-Wiley and Sons, 1981. ISBN 0-471-05661-8.
[9]
D. A. Neamen, Semiconductor Physics and Devices-Basic Principles, Richard D. Irwin, 1992. ISBN 0-256-08405-X.
Texts covering MOSFET fabrication. [10]
S. Wolf, Silicon Processing for the VLSI Era-Volume 3: The Submicron MOSFET, Lattice Press, 1995.
[11]
C. Y. Chang and S. M. Sze, ULSI technology, McGraw-Hill, 1996. ISBN 0-07-063062-3.
[12]
R. C. Jaeger, Modular Series on Solid State Devices-Introduction to Microelectronic Fabrication, Addison-Wesley, 1989.
PROBLEMS Unless otherwise stated, use the CN20 process.
5.1
Estimate vout CAC) in the following circuit, Fig. P5.1. Assume that the MOSFET was fabricated using the CN20 process.
1 mV
@
10 MHz
}--../w'-----+----- Vaut 250 k
w= L = 150 urn Figure P5.1
5.2
An n-channel MOSFET is known to have 21F1 = 0.57 V, Y = 0.45 Vln, fl n = 550 cm 2N·sec, and VTHNO = 0.8 V. Assume A = 0, n j = 1.45EI0 atoms/em' and kT/q =26 mY, compute the value of KP. Suppose W/L = 1012. Compute ID when VGS = 2 V, VSB = 1 V and VDS = 1.1V.
5.3
If a MOSFET is used as a capacitor in the strong inversion region where the gate
is one electrode and the source/drain is the other electrode, does the gate overlap of the source/drain change the capacitance? Why? What is the capacitance?
Chapter 5 The MOSFET
105
5.4
Repeat Problem 3 when the MOSFET is operating in the accumulation region. Keep in mind that the question is not asking for the capacitance from gate to substrate.
5.5
If the oxide thickness of a MOSFET is 400
5.6
Repeat Ex. 5.2 when VSB = 2 V.
5.7
Repeat Ex. 5.3 for a p-channel device with a well doping concentration of 1016 atoms/em'.
5.8
What is the electrostatic potential of the oxide-semiconductor interface when VGS
=V
A, what is C~x ?
?
THNO
5.9
Repeat Ex. 5.5 to get a threshold voltage of 0.8 V.
5.10
What happens to the threshold voltage in Problem 9 if sodium contamination of 100 x 109 sodium ions/ern' is present at the oxide-semiconductor interface?
5.11
How much charge (enhanced electrons) is available under the gate for conducting a drain current at the drain-channel interface when VDS = VGS - VTHN ? Why? Assume the MOSFET is operating in strong inversion, VGs > VTHN •
5.12
Derive Eq. (5.35) for the p-channel MOSFET following the same procedure presented in the chapter for the n-channel MOSFET.
5.13
Show that the parallel connection of MOSFETs shown in Fig. P5.13 behave as a single MOSFET with a width equal to the sum of each individual MOSFET's width.
Drain
Gate
WI L
W2 L Source
"'=t ::: --1
WN L
Drain
G"'-1h Source
WI +W2+ ... +WN L
Figure P5.13
5.14
Show that the bottom MOSFET, Fig. P5.14, in a series connection of two MOSFETs cannot operate in the saturation region. Neglect the body effect. [Hint: Show that Ml is always in either cutoff (V GS 1 < VTHN ) or triode (VOS 1< VGS 1 - VTHN ) · ]
5.15
Show that the series connection of MOSFETs shown in Fig. P5.14 behaves as a single MOSFET with twice the length of the individual MOSFETs. Again neglect the body effect.
106
Part I CMOS Fundamentals
Drain Drain
oare-i
W M2 L2 Gate---1
w --L1 +L2
Source Source
Figure P5.14
5.16
Repeat Ex. 5.6 for a CN20 p-channel MOSFET.
5.17
Layout and DRC an n-channel MOSFET with a size of 200 urn l2/lm. Use the standard cell frame. Note that the standard cell frames can be placed end to end to achieve a larger frame; that is, the height is constant, while the width of the frame depends on the number used.
5.18
Specify the SPICE statement for the MOSFET of Problem 17.
5.19
The layout of an n-channel MOSFET is shown in Fig. P5.19. What is this device's width and length?
25 11m
~Gate
poly
• HHYHH
Figure P5.19
Chapter
6 The 851M SPICE Model
The Berkeley Short Channel Igfet (insulated gate field-effect transistor) Model, BSIM, is a SPICE model for both n- and p-channel MOS transistors. Automated parameter extraction and model generation software are used to generate the SPICE model. Most fabrication houses use this model to describe the performance of their devices. The BSIMI SPICE model [1] is adequate for modeling MOSFETs with channel lengths down to 1 urn [2]. Shorter channel lengths require the use of the BSIM2 [2] or BSIM3 [3] model. This chapter will introduce the BSIMI and BSIM3 models. In the past, the levell, 2, or 3 MOS SPICE models were discussed in texts, and thus courses covering CMOS circuit design. Since most fabricators do not supply a levell, 2, or 3 SPICE model (MOSIS does supply a level 2 or 3 in addition to the BSIM model), students making the transition from academe to industry were met with learning the BSIM model. Furthermore, students were faced with trying to determine threshold voltage, transconductance parameter, and so on, using the unfamiliar BSIM model. In order to perform hand calculations, we need to be able to extract some of these simple parameters from the BSIM model statement. This is the goal of the chapter. Figure 6.1 shows a comparison, using Berkeley SPICE3, between the level 2 and the BSIMI (level 4) models for an NMOS transistor with W = 3 urn and L = 2 urn. Below is a SPICE netlist used to generate these plots. *** Top Level Netlist ***
MC3u_2u M2_3u_2u Vdd 20 Vgs 40 VIMTR1 VIMTR2
3400 CMOSN L=2u W=3u AD=18p AS=18p PD=18u PS=18u 5400 CMOSNB L=2u W=3u AD=18p AS=18p PD=18u PS=18u DCO DCO 230V 250V
.MODEL CMOSNB NMOS LEVEL=4
108
Part I CMOS Fundamentals
D500uA,--------------------------, r a W=31lill i VGS=5 n L= 21lill
BSIM
c
u
r r
VGS=4
e
n
t
VGS=3
VGS=2 -Ouyt:;.-----r~---..,..----,....---...,..-----f
OV
o
l.OV
ID(Ml) .ID(M2)
2.0V
3.0V
4.0V
5.0V
Vds Figure 6.1 A comparison between the Level 2 model and the BSIMI model in the CN20 process. +vfb=-9.73820E-01, Ivfb=3.67458E-Q1,wvfb=-4.72340E-02 +phi=7.46556E-01 ,lphi=-1.92454E-24, wphi=8.06093E-24 -kt =1.49134E+OO,lk1 =-4.98139E-01, wk1 =2.78225E-01 +k2=3.15199E-01,1k2=-6.95350E-02,wk2=-1.40057E-01 +eta=-1.19300E-02, leta=5.44713E-02,weta=-2.6n84E-02 +muz=5.98328E+02,dl=6.38067E-001,dw=1.35520E-OO1 +uO=5.2n88E-02, IUO=4.85686E-02,wuO=-8.55329E-02 +u1 =1.09730E-01, lu1=7.28376E-01 ,wu1=-4.22283E-01 +x2mz=7.18857E+OO,Ix2mz=-2.47335E+OO, wx2mz=7.12327E+01 +x2e=-3.00000E-03,lx2e=-7.20276E-03,wx2e=-5.57093E-03 +x3e=3.71969E-04,lx3e=-3.16123E-03,wx3e=-3.80806E-03 +x2uO=1.30153E-03, lx2uO=3.81838E-04, wx2uO=2.53131 E-02 +x2u1 =-2.04836E-02, Ix2u1=3.48053E-02, wx2u1 =4.44747E-02 -rnus« 7.79064E+02, Imus=3.62270E+02,wmus=-2.71207E+02 +x2ms=-2.65485E+OO, Ix2ms=3.68637E+01, wx2ms=1.12899E+02 +x3ms=1.18139E+01, Ix3ms=7.24951 E+01,wx3ms=-5.25361 E+01 +x3u1 =2. 12924E-02, Ix3u1=5.85329E-02,wx3u1 =-5.29634E-02 +tox=4.35000E-002, temp=2. 70000E+01, vdd=5.00000E+OO +cgdo=3.79886E-01 O,cgso=3.79886E-01 O,cgbo=3.78415E-01 0 +xpart=1.00000E+OOO +nO=1.00000E+OOOInO=O.OOOOOE+OOO wnO=O.OOOOOE+OOO +nb=O.OOOOOE+OOO Inb=O.OOOOOE+OOO wnb=O.OOOOOE+OOO +nd=O.OOOOOE+OOO Ind=O.OOOOOE+OOO wnd=O.OOOOOE+OOO Hsh=27.9 cj=1.037500e-04 cjsw=2.169400e-10 js=1.000000e-08 -pbsweo.s mj=O.66036 mjsw=O.178543 wdf=O dell=O
pb=O.8
.MODEL CMOSN NMOS LEVEL=2 PHI=O.600000 TOX=4.3500E-08 XJ=O.200U TPG=1 + VTO=O.8756 DELTA=8.5650E+OO LD=2.3950E-07 KP=4.5494E-05 + UO=573.1 UEXP=1.5920E-01 UCRIT=5.9160E+04 RSH=1.0310E+01 + GAMMA=0.4179 NSUB=3,3160E+15 NFS=8.1800E+12 VMAX=6,0280E+04
Chapter 6 The BSIM SPICE Model
109
+ LAMBDA=2.9330E-02 CGDO=2.8518E-10 CGSO=2.8518E-10 + CGBO=4.0921E-10 CJ=1.0375E-04 MJ=O.6604 CJSW=2.1694E-10 + MJSW=O.178543 PB=O.800000 .probe .DCVds05.1 Vgs151 .end
6.1 BSIM1 Model Parameters All electrical parameters, P', used in the BSIM model are determined using P' =P
+
LP L - DL
WP"
+ W - DW
(6.1)
Land Ware the drawn channel length and width, while DL and DW are the deltalength and deltawidth resulting from lateral diffusion and encroachment discussed earlier. The differences L - DL and W - DW are effective channel length, and widths Le!! and We!!' P, LP, and WP are the electrical parameters associated with the electrical parameter P'. Spice BSIM1 (level 4) parameters in SPICE3. NAME, units
PARAMETER
VFB, V
flat-band voltage
LVFB, WVFB
PHI, V
surface inversion potential
LPHI, WPHI
K1, V1!2
body effect coefficient
LK1, WK1
K2, none
drain/source depletion charge-sharing coeff.
LK2, WK2
ETA, none
zero-bias drain-induced barrier-loweringcoeff.
LETA, WETA
MUZ, cm2Ns
zero-bulk-bias mobility
DL, urn
shortening of channel
DW, urn
narrowing of channel
UO, V·'
zero-bias transverse-field mobility degrad. coeff.
LUO, WUO
U1,!JmN
zero-bias velocity saturation coefficient
LU1, WU1
Wand L dependence
X2MZ, cm2Ns sens. of mobility to substrate bias at Ves = VDD
LX2MZ, WX2MZ
X2E, V·'
sens. of DIBL to substrate bias
LX2E, WX2E
X3E, V·'
sens. of DIBL a drain bias at Vdsevdd
LX3E, WX3E
X2UO, V·2
sens. of trans. field mobility degrad. eff. subs. bias
LX2UO, WX2UO
X2U1, !JmN2
sens. of velocity saturation effect to substrate bias
LX2U1, WX2U1
MUS, cm2Ns
mobility at zero substrate bias and at Vds=Vdd
LMUS, WMUS
110
Part I CMOS Fundamentals
X2MS, cm2Ns sens. of mobility to substrate bias at Vds=Vdd
LX2MS, WX2MS
X3MS, cm2Ns sens. of mobility to drain bias at Vds=Vdd
LX3MS, WX3MS
X3U1, IJmN2
sens. of vel. sat. eff. on drain bias at Vds=Vdd
LX3U1, WX3U1
TOX,lJm
gate oxide thickness
TEMP, Co
temperature at which parameters were measured
VDD,V
measurement bias range
CGDO, F/m
gate-drain overlap capacitance per meter channel width
CGSO, F/m
gate-source overlap capacitance per meter channel width
CGBO, F/m
gate-bulk overlap capacitance per meter channel length
XPART
gate-oxide capacitance-charge model flag
NO
zero-bias sub threshold slope coefficient
LNO, WNO
NB
sens. of sub threshold slope to substrate bias
LNB, WNB
NO
sens. of sub threshold slope to drain bias
LND, WND
RSH, Q/sq.
drain and source diffusion sheet resistance
JS, Alm 2
source drain junction current density
PB, V
built in potential of source drain junction
MJ, none
grading coefficient of source drain junction
PBSW, V
built in potential of source drain junction sidewall
MJSW, none
grading coefficient of source drain junction sidewall
CJ, F/m 2
source drain junction capacitance per unit area
CJSW, F/m
source drain junction sidewall capacitance per unit length
WDF, m
source drain junction default width
DELL, m
source drain junction length reduction
XPART = 0 selects a 40/60 drain/source charge partition in saturation, while XPART=1 selects a 0/100 drain/source charge partition. NO, NG, and NS are the drain, gate, and source nodes, respectively. MNAME is the model name, AREA is the area factor, and OFF indicates an (optional) initial condition on the device for dc analysis. If the area factor is omitted, a value of 1.0 is assumed. The (optional) initial condition specification using I=VOS, VGS is intended for use with the UIC option on the .TRAN control line, whe'l fl transll~nt analysis is desired starting from other than the quiescent . ~ " operating point. ~~~.._ . ~
••
~
.. '~(~l -Ie.
~':'$ ~, ..
~"":'_,
.'
~~
",..
/,~I
,,,,"
Chapter 6 The BSIM SPICE Model
111
BSIMI Model Parameters in SPICE2G6
The BSIM model parameters used in SPICE2G6 are slightly different from the BSIM model parameters used in SPICE3. Many commercial suppliers of SPICE, including Metasofts, HSPICE, have based their models on SPICE2G6. To change the BSIM models in the file C:\LASI5\CN20\spice.inf from SPICE3 to SPICE2G6, change the following: LMUS WMUS CJSW JS PB PBSW MJSW dell
to to to to to to to to
LMS WMS CJW IJS PJ PJW MJW DL
Keeping in mind the order of the variables is important. The BSIMI model in SPICE3 is known as the level 4 model, whereas in HSPICE it is known as the level 13 model.
6.2 BSIM1 DC Equations The following subsections give the equations and examples for determining the threshold voltage, drain current, and subthreshold drain current from the BSIMI model parameters.
6.2.1 The Threshold Voltage The threshold voltage is calculated in the BSIMI model using VTHN = VFB'
+ PHI' + Kl' . JPHI' + VSB - K2' . (PHI' + VSB) - ETADB' . VDS (6.2)
The voltages VSB and VDS are the substrate-to-source and drain-to-source voltages. The model parameters are calculated using Eq. (6.1). ETADB is given by ETADB' = ETA' - X2E'· VSB + X3E'· (Vvs - VDD)
(6.3)
It is not practical to calculate the threshold voltage by hand using Eq. (6.2). For hand
calculations, assuming the device we are modeling is large so that the second and third terms in Eq. (6.1) are negligible,a simple method of determining the threshold voltage is VTHN = VFB + PHI + Kl.JPHI
+ VSB - K2·(PHI + VSB)
(6.4)
We arrived at this simplification by neglecting the effect of the device sizes and the lowered drain-induced barrier resulting from nonzero VDS •
Example 6.1 Compare the exact equation (6.2) for VTHN with the approximate equation (6.4) when the substrate potential is -5 V, the source is grounded, and the drain is at 2V. Use the BSIMI model parameters for the CN20 process with W/L =312.
112
Part I CMOS Fundamentals
First, let's calculate the simple approximation for the threshold voltage using Eq. (6.4). This is given by VTHN = -0.97 + 0.75 + 1.49· JO.75 + 5 - 0.315·(0.75 + 5) = 1.54
Or a generic equation in terms of VSB for this process is V THN = -0.22 + 1.49· JO.75 + VSB - 0.315·(0.75 + VSB)
To calculate the threshold voltage used in the BSIM model, we calculate the primed variables in Eq. (6.2). VFB' = VFB + PHI' = PHI +
LVFB + WVFB = -0.97 + 0.37 + -0.047 = -0.713 V L - DL W - DW 2 - 0.64 3 - 0.14 LPHI + WPHI = 0.75 + 0 + 0 = 0.75 V L - DL W - DW 2 - 0.64 3 - 0.14
Kl' =Kl +
LKI + WKI = 1.49+ -0.5 + 0.28 = 1.212 vi L - DL W - DW 2 - 0.64 3 - 0.14
K2'=K2 +
LK2 + WK2 =0.32+ -0.07 + -0.14 =0.224 L - DL W - DW 2 - 0.64 3 - 0.14
ETA' = ETA +
LETA + WETA =-0.012+ 0.054 + -0.027 =0.02 L - DL W - DW 2 - 0.64 3 - 0.14
X2E' =X2E +
LX2E + WX2E =-0.003+ -0.0072 + -0.0056 =-0.01 L - DL W - DW 2 - 0.64 3 - 0.14
X3E' =X3E +
LX3E + WX3E =-0.0004+ -0.003 + -0.004 =-0.003 L - DL W - DW 2 - 0.64 3 - 0.14
ETADB' = 0.02 +(-0.01)(-5) +(-0.003)(2- 5) = 0.079
Now we substitute these values into Eq. (6.2) to yield, V THN = -0.713 + 0.75 + 1.212· JO.75 + 5 - 0.224·(0.75 + 5) - 0.079·2 = 1.5 V
We see a difference of 40 mV for this minimum-size device between the exact calculation (6.2) and the hand calculations using Eq. (6.4). The above results should also emphasize that considerably more work is required for performing the full calculations. These results are not representative of submicron device sizes where the BSIM1 parameters may lose their physical significance. They may behave like curve-fitting parameters. • We will use Eq (6.4) for threshold calculations in this book (see Appendix A). The next example illustrates how a potential difference between the source and substrate (or well) affects the threshold voltage. Example 6.2 Using the CN20 BSIMI model parameters, plot the drain current of a minimum-size MOSFET against gate-source voltage when VSB varies from 0 to 5 V and the VDS of the MOSFET is 5 V.
113
Chapter 6 The BSIM SPICE Model The plot and SPICE netlist are shown below. Notice that the threshold voltage increases as the substrate potential becomes more negative (the body effect). Also notice that the threshold voltage tends to change less as VSB is decreased. This fact is used to get better threshold matching in analog CMOS design. The accurate representation of the body effect shown in Fig. 6.2 should be compared to the poor representation given in Fig. 5.13. •
o lOOuAr------------.--r--r-T-rr-----------, r a i n
c u r r
e
n
t
OA.+----....:::;.---""----,-------,,..------.---------j 5.0V 3.0V 4.0V 1.0V OV a
ID(Ml)
VGS
Figure 6.2 Threshold voltage change with substrate bias. ••• Top Level Netlist ••• M1_3u_2u 3405 CMOSNB L=2u W=3u VBB 50 DCO Vdd 20 DC5 Vgs 40 DCO VIMTR1 230V ••••• Spice models and macro models ••••• .MODEL CMOSNB NMOS LEVEL=4 +vfb=-9.73820E-01, Ivfb=3.67458E-01,wvfb=-4.72340E-02 ...same model parameters as before -pbsweo.s mj=0.66036 mjsw=0.178543 wdf=O dell=O .probe .DC Vgs 0 2.05 Vbb 0 -5-1 .end
6.2.2 The Drain Current When VGS < VTHN , the MOSFET is in the cutoff region and zero drain current (neglecting the subthreshold current) flows, that is, Iv =0. When Vvs < VGS - VTHN > 0, the MOSFET is in the triode or linear region. The drain current in this region is given by
114
Part I CMOS Fundamentals
W-DW C'ox . [;:jjL MUO' [ a 2 ] IDS = [l + UOZ' . (VGS - VTHN)] . (1 + UIZ' . V ). (VGS - VTHN)VDS -'2VDS L-DL DS
(6.5)
where Cox' in units of F/1lffi2, is given by
C~x = ;~~
and
tox =
35.1
X
10- 18 F/Ilm
(6.6)
a is given by a= 1 +
s
Kl'
r==:::;:===-
(6.7)
2 JPHI' + VSB
and g is given by g= 1 -
(6.8)
1.744 +0.8364(PHI' + VSB)
The parameter MUO' is obtained by a quadratic interpolation through three data points: MUO(@ Vvs = 0), MUO(@ Vvs = VDD), and the sensitivity of MUO around the point Vvs =VDD, or
MUO(@VDS=O)=MUZ' - X2MZ'· VSB
(6.9)
MUO(@VDS=VDD)=MUS' -X2MS'· VSB
(6.10)
and
The parameters UOZ' and UlZ' account for mobility degradation effects and are given by
UOZ' = UO' - X2UO' . VSB
(6.11)
and
UlZ' = Ul' - X2Ul'· VSB + X3Ul'· (VDS - VDD)
(6.12)
Equation (6.5) is not suitable for hand calculations. We can use the following equation for describing the IV characteristics of a MOSFET in the linear region:
IDS =
M~'C~'W[ L (VGS
- VTHN)· VDS -
2~s]
(6.13)
Here we use Wand L as the drawn width and length to simplify hand calculations. It should also be pointed out that MUZ· C~x is approximately the parameter KP used in the level 1-3 models discussed in Ch. 5.
Example 6.3 Compare KP obtained using the BSIMI model parameters (Eq. [6.13]) for nand p- MOSFETs, with the value of KP given in the level 2 model.
Chapter 6 The BSIM SPICE Model
115
From the SPICE listings given in the Appendix, we can determine the transconductance parameters. For the n-channel BSIMl, KP is given by
KP = MUZ· C~x = (600 cm
2N·s)
.
35.1 x 1O- 18F/J..Lm 10 8 J..Lm 2 2 0.0435J..Lm . cm 2 = 48.4 J..LAN
This is compared with 45 J..LAN2. For the p-channel, the BSIMI model gives a KP of 17 J..LAN 2, while the level 2 model supplied gives 15 J..LAN2. • The drain current of the MOSFET in the saturation region, Vos > VGS - VTHN' is calculated by
IDs =
MUO'
(6.14)
----i=~----
[1 + UOZ'· (VGS- VTHN)]
where (6.15) and Vc
UIZ'
(VGS- VTHN)
= L-DL'
a
(6.16)
Again, Eq. (6.14) is not very useful for hand calculations. The simple solution is
IDs
W = MUZ·2 .Cox' L . (V GS -
VTHN)
2
«r W . (VGS = 2T
VTHN
)2
(6.17)
This equation will work well for DC hand calculations when Vos is close to VGS - VTHN . However, this equation shows no Vos dependence. Figure 6.1 showed an increase in drain current with increasing Vos at a constant VGs' We showed earlier that the drain current was dependent on the channel length modulation effect. The mobility in Eq. (6.14) is also dependent on Vos' something we neglected earlier. We can write the mobility, MUO, neglecting length and width dependence by using a linear interpolation between the mobility at Vos = 0 (MUZ) and the mobility at Vos = VDD (MUS) as
MUO=MUZ + MUS-MUZ. VDD VDS
(6.18)
The output resistance of the MOSFET is given by -1 d (MUO.Cox.W ro = dVDS 2· L (vGS - VTHN)
2)
dMUO Cox·W
= dVDS . 2T(VGS - VTHN
)2
(6.19)
where the dependence of L on Vos has been neglected. (Channel length modulation is discussed in Ch. 5.) The output resistance is then given by
r- 1 = ( MUS - MUZ ) CoxW(V -V )2= (MUS-MUZ)MUZ. CoxW(v -V )2 o VDD 2L GS THN VDD . MUZ 2L GS THN (6.20)
116
Part I CMOS Fundamentals
From Eq. (6.17) this is written as
T~I = (~~~~:~;) . IDS =I-m ' IDS
(6.21)
The parameter I-m is called the mobility modulation parameter. The curve-fitted mobility at Vns = VDD can be less than the mobility at Vns = O. This mobility change has the effect of increasing or decreasing the output resistance of the MOSFET depending on the operating point. When MUS < MUZ, Eq. (6.21) gives a negative value for I-m , which may be close to zero. In this case, we will assume I-m = 0, and the channel length modulation will dominate the output resistance. Equation (6.17) may now be written as IDS
Cox' W 2 (I- '1) = MUZ·2.L . (VGS-VTHN) [1+ c+J\,m (VDS-VDS,sat)]
(6.22)
where \ is the channel length modulation parameter discussed earlier. This equation is very useful in analog applications where the output resistance is important. For digital applications we assume that both modulation parameters are zero. For short channel lengths, the channel length modulation will dominate the output resistance, whereas for long channel lengths the mobility modulation parameter will dominate. It is also important to note that increasing the channel length will increase the output resistance of the MOSFET to a point. Appendix A shows, for several sizes of MOSFETs, the variation of To with Vns and Vas' Notice that To for an n-channel MOSFET can change by a factor of 4 in some cases. Hand calculations often give ballpark answers when compared with SPICE. This is understandable given the complexity of the modern MOS device. Example 6.4 Estimate the I-m obtained using the BSIMI model parameters for both the n- and p-channel MOS transistors. For the n-channel MOSFET BSIM gives I-m = 779 ~i98 = 0.061 V-I while for the p-channel I-m
= 20~.;1;11 =- 0.005 V-I
5·
8
which we assume is zero.
Again, it should be emphasized that these equations are useful for hand calculations. They are heavily dependent on the measurement of the BSIM parameters. After hand calculations are performed, we can simulate the circuit using SPICE to get a more accurate representation of performance. •
6.2.3 The Subthreshold Current The current that flows when Vas < VTHN is called the subthreshold current. When the MOSFET is operating in this region, it is said to be in the weak inversion region. This current is due mainly to diffusion current between the drain and the source, similar to the bipolar junction transistor (BIT). The total drain current IDS,tot is the sum of the
Chapter 6 The BSIM SPICE Model
117
weak inversion component and the strong inversion component. From the previous subsection we know that the strong inversion component is zero when VGS < VTHN • The weak inversion component is modeled by I exp . I Limit I DS,weak = - " - - - I Limit + I exp
(6.23)
where I
exp
=MUO'.C . W-DW(kT)2e1.8eQ(VGS-VTHNlIN'kT(I_e-QVDslkT) ox L-DL q
(6.24)
and I .. - MUO'· Cox. W-DW(3kT)2 LImit 2 L-DL q
(6.25)
The subthreshold slope parameter N' is given by
N ' = NO' - NE '· VSB + ND '· An expression useful for hand calculations is
VDS
I exp = MUZ· Cox . W(kT)2 e 1.8eQ(vGS-vTHN)/N'kT(I_ e-qVDSlkT) L q
(6.26)
(6.27)
When VDS > 2kT/q (kT/q = 26 mV at room temp), Eq. (6.24) can be written as I exp -- I DO . WeQ(vGs-VTHNlINO.kT L
(6.28)
where
kT ) 2e1.8=KP· (kT)2 IDO =MUZ· Cox' ( q q e1.8
(6.29)
Notice the similarity to the BIT. Example 6.5 For a CN20 NMOS transistor with W = L = 5 11m, use SPICE to plot IDS versus VDS for VGS ' changing from 0.65 to 0.75 V. Comment on the usefulness of Eq. (6.28). SPICE results are shown in Fig. 6.3. Notice that the curves flatten out when VDS is approximately 50 mY. Although Eq. (6.28) eliminates the VDS dependence on the drain current, in practice the drain current increases with increasing VDS ' • The output resistance of a MOSFET operating in the subthreshold or strong inversion can be characterized using the early voltage parameter, VA' The output resistance is given by (6.30)
118
Part I CMOS Fundamentals D 1.2nA
(
r
a i
VGS=.75
n
c ~ O.8nA r
e n t
VGS=.725
OAnA
(
VGS=.7 VGS=.675
OA OV D
I(VIMTR3)
1.0V
2.0V
3.0V
4.0V
5.0V
Vds
Figure 6.3 Subthreshold characteristics of an n-channel MOSFET with L = W = 5 urn,
Figure 6.4 presents a graphical interpretation of this equation. Subthreshold operation can be very useful for low-power operations. The main problem that plagues circuits designed to operate in the subthreshold region is matching. Since the drain current is exponentially related to the gate-source voltage, any mismatch in these voltages can cause significant differences in the drain current. Another problem relating to the matching of devices is the relative difference between the subthreshold slope parameter, N' , of different devices. One over the slope of these lines is tho output =i"""~
ID
Figure 6.4 Early voltage and its relation to the output resistance of a MOSFET.
The subthreshold region is often characterized using the log ID plotted against VGS (see Fig. 6.5). We can write the drain current of the MOSFET in the subthreshold region, assuming f exp « f Limit , by
119
Chapter 6 The BSIM SPICE Model
I D = IDO . W.
eq(VGS-VTHN)IN'.kT)
(6.31)
L
Taking the log of both sides, we get
.
10gID = log
subthreshold slope
.
~ +logIDo+ k/N,(-VTHN).IOge+[k/N,·IOge]
·Vas
(6.32)
= kT. _1_. N' = kT. _1_. (NO' +NB'· VBS +ND'· VDs)
(6.33)
The reciprocal of the subthreshold slope is given by sub. slope:"
q
loge
q
loge
If kT/q = 0.026 V = VT
, and N' =1, the reciprocal of the subthreshold slope is 60 mY/decade. From Appendix A, Table A.5, the subthreshold slope is typically 100 mY/decade. The slope parameter N' is used to adjust the model subthreshold slope so that it matches measured data, that is, measured data in the form of Fig. 6.5. Reviewing the BSIM models given in the Appendix reveals that the subthreshold region was not characterized when the models were extracted. The model uses the default 60 mV /decade, which is the result when NO = 1, with the remaining eight subthreshold parameters equal to zero.
"Square law operation" Subthreshold operation Strong inversion
10- 11
Figure 6.5 Drain current plotted from weak to strong inversion.
6.3 Short Channel MOSFETs The CN20 process used throughout the text is useful in illustrating the fundamentals of CMOS design. However, modern CMOS transistors have channel lengths that are well below the 2 urn minimum length of the CN20 process. The gradual channel approximation used in the last chapter to develop the current-voltage characteristics of the MOSFET falls apart for modern short channel devices. The electric field under the gate oxide can no longer be treated in a single dimension. In addition, the velocity of the carriers drifting between the source and drain of the MOSFET saturates, an effect
120
Part I CMOS Fundamentals
called carrier velocity saturation. The result is a reduction in mobility of the electron, Iln' and thus an increase in the channel's effective sheet resistance [see Eq. (5.29)]. Since the mobility of the electron decreases with increasing temperature,' this effect is sometimes referred to as the hot-carrier effect. A cross section of a modern MaS device using a lightly doped drain (LDD) structure, used to reduce the effects of hot carriers, is shown in Fig. 6.6. This structure is formed by implanting a shallow n-, forming the spacer adjacent to the poly, and implanting the n+.
FOX
FOX
p-substrate
n-
Figure 6.6 LDD MOSFET.
6.3.1 MOSFET Scaling Reducing the channel length of a MOSFET can be described in terms of scaling theory [5]. A parameter S (S < I) is used to scale the dimensions of a MOSFET. New technologies typically use an S in the neighborhood of 0.7. If a process uses VDD of 5 V, a scaled process would use a VDD' of 3.5 V. In other words VDD' = VDD·S
(6.34)
The channel length of the scaled process is reduced to L' =L· S
(6.35)
W'=W·S
(6.36)
while the width is reduced to
Table 6.1 [5] describes how S affects the MOSFET parameters. The main benefits of scaling are (l) smaller device sizes and thus reduced chip size (increased yield and more parts per wafer), (2) lower gate delays, allowing higher frequency operation, and (3) reduction in power dissipation. Associated with these benefits are some unwanted side effects referred to as short channel effects. These unwanted effects are discussed in the next section. Trends in MOSFET scaling are shown in Fig. 6.7[5]. Notice that the slopes of the curves in this figure are equal to the scaling parameter S.
!
See Ch. 9 for a discussion of the temperature dependence of the mobility.
Chapter 6 The BSIM SPICE Model
121
Parameter
Scaling
Supply voltage (VDD)
S
Channel length
S
Channel width (W)
S
Gate-oxide thickness (tox) Substrate doping (NA)
S S-I
Drive current (ID)
S
Gate capacitance (Cox)
S
Gate delay
S S3
Active power
Table 6.1 Scaling relationships.
~ 15
n-channel
~25
'"
:g.,'"
-.; -e 9 £ CJ
'"
p-channel
;>-.
;>-.
'iii CJ
3 0.1
15 5
0.3 0.5 0.7 Channel length (urn)
0$
~.,
'" '" ] 12
.,
I
>
3
:g
OIl
l:::
9
....
8
%J
CJ
0.1
0.5 0.3 0.7 Channel length (urn)
Figure 6.7 Trends in MOS device scaling.
122
Part I CMOS Fundamentals
6.3.2 Short Channel Effects The average drift velocity, v, of an electron plotted against electric field, E', is shown in Fig. 6.8. When the electric field reaches a critical value, labeled Eerit ' the velocity saturates at a value v w t ' that is, the velocity ceases to increase with increasing electric field. The ratio of electron drift velocity to applied electric field is the electron mobility, or
Iln = ~
(6.37)
E
Above the critical electric field the mobility starts to decrease, whereas below E erit the mobility is essentially constant. Rewriting Eq. (5.31) results in
I D = Iln .
dV(y) , "dY' W· Cox[V
GS -
(6.38)
VTHN - V(y)]
We are interested in determining how the drain current of a short channel MOSFET changes with Ves when operation lies in the saturation region. (The charge under the gate oxide at the drain channel interface is zero, and the channel is pinched off.) The MOSFET enters the saturation region when V(L) = VDS,sat' At high electric fields, the mobility can be approximated by Vsat
Iln =
v
E
Vsat
(6.39)
= dV(y)/dy
-:
______________ ~;....:..-,-::::::::::::::::====E=,lectrons Holes
Electric field (Vfcm)
Figure 6.8 Drift velocity plotted against electric field.
A simple estimate (ballpark value) of E in a MOSFET is simply VD/L. This value can be used to determine if short channel effects are present, that is, to determine if the carrier velocity saturates in Fig. 6.8. 2
Chapter 6 The BSIM SPICE Model
123
so that Eq. (6.38) can be written as [6] ID
= W·
Vsat'
C~x(VGS- VTHN-
VDS,sat)
(6.40)
This result is important! The drain current of a short channel MOSFET operating in the saturation region increases linearly with VGs ' The long channel theory, Eq. (5.39), showed the drain current increasing with the square of the gate-source voltage. This result also presents a practical relative figure of merit for the modern CMOS process, the drive current per width of a MOSFET. The drive current, Idrive (!1AIIlffi), is given by I drive
=
V sat .
C~xC V GS -
V THN - V DS,sat)
(6.41)
and therefore ID
= Idrive' W
(6.42)
The drive current can be estimated using these equations; however, it is normally measured with VGS =VDD. Hot Carriers
The low field mobility decreases with increasing temperature (again see Ch. 9). This effect can be used to describe velocity saturation, that is, assume an increase in temperature at the electric fields above E eri, . Carriers traveling at vsat are therefore called hot carriers. Note that the drift velocity and temperature are not proportional. Hot carriers is simply a term used to describe mobility reduction and thus velocity saturation. Hot carriers can tunnel through the gate oxide and cause gate current or become trapped in the gate oxide, having the effect of changing the threshold voltage. Hot carriers can also cause impact ionization (avalanche breakdown). Oxide Breakdown
For reliable device operation, the maximum electric field across a device gate oxide should be limited to 7 MVlcm [7]. This translates into 0.7 V / 10 A of gate oxide. A device with tox of 70 A should limit the applied gate voltages to 4.9 V for reliable long-term operation. Drain-Induced Barrier Lowering
Drain-induced barrier lowering (DIBL, pronounced dibble) causes a threshold voltage reduction with the application of a drain-source voltage. The positive potential at the drain terminal helps to attract electrons under the gate oxide and thus increase the surface potential l1>s' Since VTHN decreases with increasing Vvs , the result is an increase in drain current and thus a decrease in the MOSFET's output resistance (see Fig. 6.9). Substrate Current-Induced Body Effect
Substrate current-induced body effect, (SCBE), is the result of hot carriers causing impact ionization and generating a substrate current. This occurs for electric fields
124
Part I CMOS Fundamentals
Triode CLM
DIBL
SCBE
1 i:i
§
CLM - Channel length modulation dominates output resistance. DillL - Drain-induced barrier loweringdominates output resistance.
1.5
::l
u
SCBE - Substrate current -induced body effect dominates output resistance.
c: 0;
o 0.5 o
1
2
3
Drain-source voltage (V) Figure 6.9 Characteristics of a MOSFET with WfL = 10 urn /0.43 urn and TOX = 75 A [8]. greater than 105 V fcm. The substrate current will flow through the resistance of the substrate, increasing the substrate potential and further decreasing the threshold voltage. The result, again, is an increase in drain current and a decrease in the MOSFETs' output resistance.
6.4 The 8SIM3 SPICE Model The BSIM3v3 (BSIM3 version 3) SPICE model is the third generation of BSIM MOSFET model from Berkeley [4V The BSIM3 model was developed for submicron It has approximately 120 possible parameters, each having physical devices. significance such as modeling of noise and temperature effects (which were not modeled in the BSIMI model). The drain current and its first-order derivative are continuous over all regions of operation, which helps with simulation convergence problems. Note that here we are using approximations to the actual equations used in the BSIM3v3 model in order to keep the introduction short. For an exact listing, see[4]. The Threshold Voltage Model
The threshold voltage is determined using VTHN = VTHNO + K< Js + VSB
-..fi[) + K2 VSB + s, (Jl + ~~ -l)..fi[ -I1VTHN (6.43)
where VTHMl is the long channel threshold voltage, s (= PHI) is the surface potential, 11 VTHN is the threshold voltage reduction due to short channel effects, and Kl' K 2 take into account vertical nonuniform doping effects. The threshold voltage reduction has an exponential dependence on channel length and is given by (6.44)
3
This section is based directly on the information given in [4].
Chapter 6 The BSIM SPICE Model
125
and
eeL) = DVTHNO[e-(L.DVT1)l21, + 2e-(L.DVT1)ll,]
(6.45)
where Vbi is the built-in potential given by
V kJ . N:r J bi
=
In (
d
(6.46)
and It is the characteristic length given by (6.47) The depletion width between the channel and the substrate is Xd ' while the average depletion width along the channel is XdlT\. The parameters DVTHMJ , DVT1, and T\ can be determined from experimental data. The Drain Current Model
The operating regions in the BSIM3 model are divided into strong inversion (V GS > VTHN) , weak inversion (VGS < V THN ) , and a transition region (VGS '" VTHN) . The strong inversion region is divided into the triode region (VDS < VDS,sa,) and the saturation region (VDS > VDs,sa,). The drain current in the saturation region is given by , [ VDS - VTHN- VDs,sat] ID = W· Vsat' Cox(VGS- VTHN- VDS,sat) 1 + VA
(6.48)
where VA is the early voltage generated by the MOSFET output generated by the output resistance model. The drain current in the triode region is estimated using I
= W. reff II
D
.
C' . W . ox L
1 . [ V GS - VTHN - V DS ] . V V /L 2 DS 1+ ...12:LEcru
(6.49)
where the effective mobility is estimated using II 2 . Vsat reff= --
e.;
(6.50)
The drain current in the weak inversion or subthreshold region is estimated using ID = Ileff'
~. [kJT .c, . [e(VGS-VTHN-VO!lWnkT][l_ e-qVDs/kT]
(6.51)
where Voffis an offset voltage and n is the subthreshold slope factor. Model Examples
The BSIM3v3 model is implemented in SPICE3f5 as a level 8 MOSFET model. Metasoft's HSPICE implements their version of the BSIM3v3 model as a level 49 MOSFET model. Below are example model listings [9] for both an n-channel and a p-channel MOSFET model based on BSIM3v3.
126
Part I CMOS Fundamentals 'model = bsim3v3 'Berkeley Spice Compatibility , Lrnlne .35 Lmax= 20 Wmin= .6 Wmax= 20 .model N1 NMOS +Level= 8 +Tnom=27.0 +Nch= 2.498E+ 17 Tox=9E-09 Xj=1.00000E-07 +Lint=9.36e-8 Wint=1.47e-7 +VthO= .6322 K1= .756 K2= -3.83e-2 K3= -2.612 +DvtO= 2.812 Dvt1= 0.462 Dvt2=-9.17e-2 +Nlx= 3.52291 E-08 WO= 1.163e-6 +K3b= 2.233 -vsat- 86301.58 Ua= 6.47e-9 Ub= 4.23e-18 Ue=-4.706281 E-11 +Rdsw= 650 UO= 388.3203 wr=1 +AO= .3496967 Ags=.1 80=0.546 B1= 1 + Dwg = -6.0E-09 Dwb = -3.56E-09 Prwb = -.213 +Keta=-3.605872E-02 A1= 2.778747E-02 A2=.9 +Voff=-6.735529E-02 NFactor= 1.139926 Cit= 1.622527E-04 +Cdsc=-2.147181 E-05 +Cdscb= 0 DvtOw = 0 Dvt1w = 0 Dvt2w = 0 + Cdscd = 0 Prwg = 0 +EtaO= 1.0281729E-02 Etab=-5.042203E-03 -Dsub- .31871233 +Pclm= 1.114846 Pdiblc1= 2.45357E-03 Pdiblc2= 6.406289E-03 -Drout- .31871233 Pscbe1= 5000000 Pscbe2= 5E-09 Pdiblcb = -.234 +Pvag= 0 delta=0.01 + WI = 0 Ww = -1.420242E-09 Wwl = 0 + Win = 0 Wwn = .2613948 LI = 1.300902E-10 + Lw = 0 Lwl = 0 Lin = .316394 + Lwn = 0 +kt1=-.3 kt2=-.051 +At= 22400 +Ute=-1.48 +Ua1= 3.31E-10 Ub1= 2.61E-19 Uc1= -3.42e-10 +Kt11=0 Prt=764.3 .model P1 PMOS +Level= 8 +Tnom=27.0 +Nch= 3.533024E+17 Tox=9E-09 Xj=1.00000E-07 +Lint=6.23e-8 Wint=1.22e-7 +VthO=-.6732829 K1= .8362093 K2=-8.606622E-02 K3= 1.82 +DvtO= 1.903801 Dvt1= .5333922 Dvt2=-.1862677 +Nlx= 1.28e-8 WO= 2.1e-6 +K3b= -0.24 Prwg=-0.001 Prwb=-0.323 +Vsate 103503.2 Ua= 1.39995E-09 Ub= 1.e-19 Uc=-2.73e-11 + Rdsw= 460 UO= 138.7609 +AO= .4716551 Ags=0.12 +Keta=-1.871516E-03 A1= .3417965 A2=0.83 +Voff=-.074182 NFactor= 1.54389 Cit=-1.015667E-03 +Cdsc= 8.937517E-04 +Cdscb= 1.45e-4 Cdscd=1.04e-4 + DvtOw=0.232 Dvt1w=4.5e6 Dvt2w=-0.0023 +EtaO= 6.024776E-02 Etab=-4.64593E-03
I
Chapter 6 The BSIM SPICE Model
127
+Dsub= .23222404 -Pclrne .989 Pdiblc1 = 2.07418E-02 Pdiblc2= 1.33813E-3 -Drout« .3222404 Pscbe1= 118000 Pscbe2= 1E-09 +Pvag= 0 +kt1 = -0.25 kt2= -0.032 prt=64.5 +At= 33000 +Ute= -1.5 +Ua1= 4.312e-9 Ub1= 6.65e-19 Uc1= 0 Kt11=0
6.5 Convergence A major frustration with using the BSIM SPICE model is the difficulty with convergence. Assuming the circuit contains no connection errors, there are basically three parameters that can be adjusted to help convergence. (Other methods of helping convergence for a particular type of analysis are discussed elsewhere in the text.) These three parameters are ABSTOL, VNTOL, and RELTOL [10]. ABSTOL is the absolute current tolerance. Its default value is 1 pA. This means that when a simulated circuit gets within 1 pA of its "actual" value, SPICE assumes that the current has converged and moves onto the next time step or AC/DC value. VNTOL is the node voltage tolerance, default value of 1 ~V. RELTOL is the relative tolerance parameter, default value of 0.001 (0.1 percent). RELTOL is used to avoid problems with simulating large and small electrical values in the same circuit. For example, suppose the default value of RELTOL and VNTOL were used in a simulation where the actual node voltage is 1 V. The RELTOL parameter would signify an end to the simulation when the node voltage was within 1 mV of 1 V (lV·RELTOL), while the VNTOL parameter signifies an end when the node voltage is within 1 ~V of 1 V. SPICE uses the larger of the two, in this case the RELTOL parameter results, to signify that the node has converged. Increasing the value of these three parameters helps speed up the simulation and assists with convergence problems at the price of reduced accuracy. To help with convergence, the following statement can be added to a SPICE netlist: .OPTIONS ABSTOL=1 uA VNTOL=1 mV RELTOL=0.01
To force convergence, these values can be increased to .OPTIONS ABSTOL=1mA VNTOL=100mV RELTOL=0.1
The following is a list of common mistakes that can be made when learning to simulate circuits using SPICE. 1.
The first line in a SPICE netlist must be a comment line. SPICE ignores the first line in a netlist file.
2.
One megaohm is specified using IMEG, not 1M, 1m, or 1 MEG.
3.
One farad is specified by 1, not If or IF. IF means one femto-farad or 10-15 farads.
128
Part I CMOS Fundamentals
4.
Areas of MOSFET drains and sources are, in most cases, specified in terms of picometers squared. An area measuring 6 urn on one side and 8 urn on the other side is specified by 48pm or 48E-12.
5.
Voltage source names should always be specified with a first letter of V. Current source names should always start with an I.
6.
Transient simulations display time data; that is, the x-axis in probe is time. A jagged plot such as a sinewave that looks like a triangle wave or is simply not smooth is the result of not specifying a maximum print step size (in the .tran statement) or specifying a maximum print step that is too large. For example, in order to display a 1 kHz sinewave in SPICE, a maximum print step of lOu (ten rnicroeconds) can be specified.
7.
When displaying the results of an AC simulation where the x-axis is frequency, the probe cursor should be displaying either the magnitude or phase of the voltage or current. For example, a cursor that displays "voltage drop at a node" will sum the real and imaginary parts of the voltage at that node and display the somewhat meaningless result. The probe functions vary widely between simulators. (Some simulators are smart enough to start the user in the magnitude mode after performing an AC simulation.)
8.
MOSFET widths and lengths are specified using the letter "u" for microns. A common mistake is to forget to include this letter. For example, a minimum-size MOSFET in the CN20 process is specified by L=2u W=3u not L=2 W=3. The latter means a MOSFET with a 2 meter length and a 3 meter width!
9.
In general, the body connection of a p-channel MOSFET is connected to VDD, and the body connection of an n-channel MOSFET is connected to VSS. For example, in the CN20 process which is an n-well process, all n-channel bulk connections must be tied to VSS. This matter is easily checked in the SPICE netlist.
10.
Convergence in a DC sweep can often be helped by avoiding the power supply boundaries. For example, sweeping a circuit from 0 to 5 V may not converge, but sweeping from 0.1 to 4.9 will.
REFERENCES [1]
J. R. Pierret, A MOS Parameter Extraction Program for the BSIM Model, Electronics Research Laboratory, University of California, Berkeley, Calif. 94720. Memorandum No. UCB/ERL M84/99, November 21, 1984.
[2]
G. Massobrio and P. Antognetti, Semiconductor Device Modeling with SPICE, 2nd ed., McGraw-Hill, 1993. ISBN 0-07-002469-3.
[3]
J. H. Huang, Z. H. Liu, M. C. Jeng, P. K. Ko, and C. Hu, A Robust Physical Predictive Model for Deep-Submicron MOS Circuit Simulator, Electronics
Chapter 6 The BSIM SPICE Model
129
Research Laboratory, University of California, Berkeley, Memorandum No. UCBIERL M93/57, July 21,1993.
Calif. 94720.
[4]
BSIM3v3 Manual (final version) from the Department of Electrical Engineering and Computer Science, University of California, Berkeley. Also can be downloaded at http://www-device.eecs.berkeley.edu/-bsim3/intro.html
[5]
M. Bohr, "MOS Transistors: Scaling and Performance Trends," Semiconductor International, pp. 75-79, June 1995.
[6]
K. Y. Toh, P. K. Ko, and R. G. Meyer, "An Engineering Model for Short-Channel MOS Devices," IEEE Journal of Solid State Circuits, Vol. 23, No.4, August 1988.
[7]
C. Hu, ULSI Device Scaling and Reliability, Research and Development seminar at Micron Semiconductor, Boise, Idaho, 1995.
[8]
J. H. Huang, Z. H. Liu, M. C. Jeng, P. K. Ko, and C: Hu, A Physical Model for MOSFET Output Resistance, Electronics Research Laboratory, University of California, Berkeley, Calif. 94720. Memorandum No. UCBIERL M93/56, July 21,1993.
[9]
http://www-device.eecs.berkeley.edu/-bsim3/intro.htrnl
[10]
R. Kielkowski, Inside SPICE: Overcoming the Obstacles of Circuit Simulation, McGraw-Hill, 1994. ISBN 0-07-911525-X.
PROBLEMS
6.1
Using the CN20 BSIM model parameters for the p-channel MOSFET, calculate, by hand, the zero-bias threshold voltage.
6.2
Calculate KP and Cox for both the BSIM model parameters.
6.3
Using SPICE, plot I D against VDS (VSD) for both the n- and p-channel MOSFETs (L = 2 11m and W =311m) using the CN20 BSIM model parameters for VGS (VSG) = 1, 2, 3, 4, and 5 V. The SPICE models are located in the file spice.inf in the C:\LASI5\CN20 directory.
6.4
Using SPICE and the BSIM model-generate Fig. 6.5 for an n-channel MOSFET with L W 10 urn. What is the subthreshold slope?
6.5
Calculate Idri ve for a short channel MOSFET with tox = 75 A, VTHN = 0.5 V, VGS = VDD = 2.5 V and VDS,sat = 1.5 V. Comment on why VDS,sat is not equal to VGSVTHN for a short channel MOSFET (see Ch. 5).
6.6
Estimate the mobility ofthe electron and hole at 105 V/cm from Fig. 6.8.
6.7
Show that using the level 1 SPICE MOSFET model results in a small-signal output resistance of
Il-
and p-channel MOSFETs using the CN20
= =
130
Part I CMOS Fundamentals I
L
rO=f../D=f..·K
where K is essentially constant for small changes in VGs ' This equation shows that the output resistance of a MOSFET is linearly dependent on the channel length for a constant drain current. Increasing the channel length of the MOSFET increases the output resistance. This result, from the discussion in this chapter, is incorrect. (The level 1 models neglect f.. m . ) Consider the results of Problem. 8. 6.8
Using the results of an .OP (operating point analysis), plot the output resistance of a MOSFET versus channel length for the circuit of Fig. P6.8 using the BSIM model for channel lengths from 2 to 10 11m. The SPICE output file should specify the MOSFET small-signal parameters after the simulation has run. The MOSFET output resistance is the reciprocal of the parameter "gds" in this file.
W=50~m
Figure P6.8
6.9
Calculate KP and Cox for both the n- and p-channel MOSFETs using the CMOS14TB BSIM model parameters.
6.10
Using SPICE, plot /D against VDS (VSD) for both the n- and p-channel MOSFETs (L = 0.6 11m and W = 0.9 urn) using the CMOS14TB BSIM model parameters for VGS (VSG) = 1, 2, and 3 V. The SPICE models are located in the file spice.inf in the C:\LASI5\CN20 directory.
6.11
Calculate process.
6.12
Label Field Oxide, the spacer for LDD, gate, drain/source and lateral diffusion in the scanning electron microscope (SEM) picture of Fig. P6.12.
/drive
for both the n- and p-channel MOSFETs in the CMOS14TB
Figure P6.12
Chapter
7 CMOS Passive Elements
In this chapter we discuss the layout of the polyl-poly2 capacitor, as well as the temperature and voltage dependence of the resistor and capacitor, and finally we introduce noise analysis of resistor-capacitor circuits.
7.1 The Second Poly Layer (poly2) Often, in a CMOS process, a second layer of polysilicon is added for MOSFET and capacitor formation. This poly2 layer follows similar design rules as the polyl layer. The layer for contact to poly2 is the "contact" layer ("cont" in the LASI CN20 setups). We can use poly2 for MOSFET formation instead of poly!. The electrical characteristics of the MOSFET made with poly2 are given in the CN20 parametric data available from MOSIS. 7.1.1 Design Rules for Capacitor Formation
The design rules specified here are derived from the Orbit design rules. The design rules for capacitor formation are as follows. 4.1 Width
311m
4.2 Space
311m
4.3 Poly1 overlap of poly2
211m
4.4 Space to active or well edge
211m
4.5 Space to contact
311m
These rules are illustrated in Fig. 7.1 along with an example cross-sectional view of the capacitor.
132
Part I CMOS Fundamentals
p 0 1 .ld 2 p 0 1 ld 1 ...
~
~
Insulator Metall
Metall Poly2
Poly!
Gateoxid
Insulator FOX
p-substrate
Figure 7.1 Design Rules for Polyl-Poly2 capacitor and associated cross-sectional view.
Example 7.1 Estimate the value of the capacitor shown in Fig. 7.1.
From the Orbit electrical parameters, the capacitance between poly l and poly2 can vary from a minimum of 443 aF/JlIl12 to 557 aF/JlIl12. The amount of overlap of poly l and poly2 shown in the figure is 64 11m2. So the capacitance can range from 28.4 fF to 35.6 fF. •
7.1.2 Parasitics of the Poly Cap In addition to the capacitance between poly l and poly2, we also have a capacitance
between poly l and substrate, poly l (or poly2) and metall, and possibly metal2 to poly l, poly2, or metal I. These capacitances are shown in Fig. 7.2. When we are laying out capacitors, we should not waste much time trying to analyze each component, but should just try to get an idea for the approximate values.
Chapter 7 CMOS Passive Elements
133
-----I--------I------Cap metall to metal2
-T
Cap metall to metal2
Cap metall to substrate T_c_a_p_PO_l_y_tO_SU_b_str_a_te_T Cap metall to substrate
I
p-substrate
Figure 7.2 Parasitic capacitance associated with poly!-poly2 capacitor.
Another parasitic associated with the capacitor is the contact resistance, metall to poly, and the distributed resistance across the plate of the capacitor. To minimize the resistance, contacts should be made everywhere possible on poly. Since we only have access to poly! on the end, we might want to contact the poly! down the center or in a finger style similar to laying out a large MOSFET. An example layout is shown in Fig. 7.3. We know that with every contact to poly we have a contact resistance. We think of this as a resistor between metall and the plate of the capacitor. Adding another contact halves this resistance because the contact resistances are in parallel. Also, the sheet resistance of poly is on the order of 20 ohms/square. The plate of the capacitor is then
Poly1
(bottom
plate)
Poly!
p
I a t
8 )
Figure 7.3 Layout of a l pF capacitor using multiple contacts and fingers to reduce the series resistance.
134
Part I CMOS Fundamentals
actually a distributed RC. The R is from the resistance of the poly, while the capacitance is the actual capacitance we are interested in.
7.1.3 Other Types of Capacitors As we discussed earlier, we can make a capacitor using metall and metal2, a MOSFET with the drain and source shorted with VGS > VTHN (operating in the strong inversion region), and we can use the n+ or p+ diffusion regions to substrate or well.
7.2 Temperature and Voltage Dependence of Capacitors and Resistors The resistor and capacitor in a CMOS process have a value that changes with temperature and voltage. The change is usually listed ppm/X' (parts per million per degree C). The ppm/X' is equivalent to a multiplier of 1O-6/0C.
7.2.1 Resistors The first-order temperature coefficient of a resistor, TCR, is given by TCR=l. dR R dT
(7.1)
Typical values of TCR for n-well, n+/p+ (active) and poly resistors are 10,000, 2,000, and 1,000pprn/°C respectively. SPICE uses a quadratic, in addition to this first order term, to model the temperature dependence of a resistor R(1) = Rro . [l
+ TCR· (T - To) + TCR2· (T - TO)2]
(7.2)
where RIO is the value of the resistor at To' typically measured at 27°C. For hand calculations, we will assume TCR2 is O. Example 7.2 Estimate the minimum and maximum resistance of an n-well resistor with a length of 100 urn and a width of 10 urn over a temperature range of 0 to 100 ·C. Assume that the TCR of the resistor is 10,000 ppm/rC. The n-well resistor sheet resistance can vary from 2,000 to 3,000 Q/square. The value of the resistor in this example can change from 20 k to 30 kn at 27°C. The minimum resistance is then determined, using Eq. (7.2) by R min
= 20,000· [1 +0.01 . (0 -
27)] = 14.6 kn
and the maximum resistance is determined by R max = 30,000· [l +0.01 . (l00 - 27)] = 51.90 kn
•
The two resistors discussed in the previous example would correspond to resistors fabricated in two different wafers. Typical matching of n-well resistors on the same wafer is around 1 percent. For a 25 k n-well resistor we might expect another resistor on the same die with the same size to have a value between 24,750 and 25,250
Chapter 7 CMOS Passive Elements
135
ohms. Again, this is an approximation. Temperature, voltage across, and place on the die all have an effect. If the resistor is placed close to a power amplifier which is dissipating large amounts of power, the resistor will effectively be at a higher temperature than the same-size resistor on the other side of the die. Another important contributor to a changing resistance is the voltage coefficient given by VCR=l. dR R dV
(7.3)
where V is the average voltage applied to the resistor, the sum of the voltages on each end of the resistor divided by two. For an n-well resistor, this is the voltage difference between each side of the resistor and the potential of the n-well. The resistance as a function of voltage is then given by R(V) =Rvo· (1 + VCR·V)
(7.4)
The value R vo is the value of the resistor at the temperature To' again typically 27°C. A typical value of VCR is 200 ppmlV for an n-well resistor. The main contributor to the voltage coefficient is the depletion layer width between the n-well and the p-substrate. The depletion layer extends into the n-well, resulting in an effective increase in the sheet resistance. The thickness of the n-well available to conduct current decreases with increasing potential between the n-well and the substrate. Example 7.3 Estimate the average resistance of an n-well resistor with a typical value of 50 k at 27°C, for an average voltage across the resistor of 0,5, and 10 V. R(O) = 50,000· (1 + 0.0002 . 0) = 50 kQ
R(5) = 50,000· (l R(lO)
+ 0.0002· 5) = 50.05 kQ
= 50,000· (l + 0.0002· 10) = 50.10 kQ
This is a small change compared to the change due to temperature. However, as the next example will show, the change due to the applied voltage can have a greater effect on the circuit performance than the temperature. • Example 7.4 Compare the change in Vout in the following circuit due to VCR with the change due to TCR. Assume that the resistors are fabricated using the n-well.
Figure Ex7.4
136
Part I CMOS Fundamentals
We start by writing the voltage divider equation and then substituting the temperature or voltage dependence. For the temperature dependence
V
- V. out -
In
R2(T) - V.. R2· [1 + TCR(T - To)] _" [ R2 ] Rl(T) + R2(T) - In (Rl + R2) . [1 + TCR(T - To)] - V In Rl + R2
and for the voltage dependence
V
- V.
out-
In
R2(V) _V . R2· (l + VCR· V2) Rl(V)+R2(V)- In Rl.(1+VCR.V 1)+R2'(l+VCR.V2 )
where V I = vin;Vout and V 2 = V~ut assuming the substrate is at ground potential. These results show that the voltage divider has no temperature dependence, to a first order, while it does have a voltage dependence. • The preceding example should also show the advantage of ratioing components. For precision design over large temperature ranges, this fact is very important. Usually, a unit resistor is laid out with some nominal resistance. Figure 7.4a shows a unit cell resistor with a nominal resistor value of 20 kQ. Figure 7.4b shows how the nominal 20 kQ unit cell resistor is used to implement a nominally 100 kQ resistor. The errors due to corners and differing perimeters are eliminated with this scheme when the ratio of the resistors is used in a circuit. Amplifier circuits, such as those using op-amps with feedback, are examples of circuits where ratioing is important. Any precision circuit is susceptible to substrate noise. Substrate noise is the result of adjacent circuits injecting current into one another. The simplest method of
II:::::::::::::::::::::::: Ii:::::::::::::::::::::::
:1
::1
implement a larger resistor
Figure 7.4 Using a unit cell in resistor layout.
Chapter 7 CMOS Passive Elements
137
reducing substrate noise between adjacent circuits is to place a p+ implant (for a p-substrate wafer) between the two circuits that is tied to VSS. The diffusion removes the injected carriers and holds the substrate, ideally, at a fixed potential (VSS). Figure 7.5 shows the basic idea for a resistor. The p+ implant guards the circuit against minority carrier injection. Since the implants are laid out in a ring, they are often called guard rings.
Figure 7.5 Layout of a resistor using guard rings.
Matching between two different resistors can be benefited by using the layout shown in Fig. 7.6. Process gradients, in this case changes in the n-well doping at different places on the die, are spread between the two resistors. Notice that the orientation of the resistors is consistent between unit cells; that is, all cells are laid out either horizontally or vertically. In a practical matched resistor layout, the unit cells in Fig. 7.6 would be surrounded by guard rings. Also, each resistor has essentially the same parasitics. Common-Centroid Layout
Common-centroid (common center) layout can be used to help improve the matching between two resistors [2] (at the cost of uneven parasitics between the two elements). Consider the arrangement of unit resistors shown in Fig. 7.7a. This arrangement is sometimes called an interdigitated resistor and is the same form as that shown in Fig. 7.6. Furthermore, consider the effects of a linear varying sheet resistance on the overall value of each resistor. If we assign a normalized value to each unit resistor, as shown,
138
Part I CMOS Fundamentals
R2
~~~:::::::::::::::::::::
Figure 7.6 Layout of two matched resistors. Note that the parasitic capacitance from metal I to substrate is essentially the same for each resistor. A
B
A
B
(a)
Q/square
Variation of sheet resistance as a function of position.
Distance
(b)
Figure 7.7 (a) Interdigitated layout and (b) common-centroid layout.
139
Chapter 7 CMOS Passive Elements
then resistor A has a value of 16 and resistor B has a value of 20. Ideally, the resistor values are equal. Next consider the common-centroid layout shown in Fig. 7.7b, noting that resistors A and B share a common center. The value of either resistor in this figure is 18. In other words, the use of a common center (ABBAABBA) will give better matching than the interdigitized layout (ABABABAB). Figure 7.8 shows the common-centroid layout (two different possibilities) of four matched resistors. Note that common-centroid layout can also improve matching in MOSFETs or capacitors.
GBGG GGGG .'
..
,
G~···. G·'A.·· ·Ba··G~ ..
,
G~ D
"
"
,I
,
>:"
gm = __D_
aiD
ID=const
ID,weak
VT'
NO
(9.12)
where the designation of weak inversion has been dropped from I D and VT = kJ = 26 mV @ T = 300 K. The conductance of the MOSFET in the subthreshold region increases linearly with I D , while when operation is in the strong inversion region the conductance increases as the root of I D • The model shown in Fig. 9.2 is used for both strong inversion and weak inversion cases.
168
Part I CMOS Fundamentals
Example 9.1 Consider the circuit shown below. Determine id and an intuitive way to look at the circuit. Use CN20 BSIM model parameters of Ch. 6 or Appendix A.
O.lV~ 3V~ L=W=3I.l ffi Figure Ex9.1
The substrate connection is not drawn, so we will assume that the substrate is connected to the most negative potential in the circuit, or in this case ground. Since Vvs = VGS ' the transistor is in the saturation region, Vvs > V GS - VTHN • The threshold voltage, from Eq. (6.40), is VTHN = - 0.22+ 1.49 JO.75 -0 -0.315· (0.75 - 0) = 0.83 V
The transconductance, using Eq. (9.9), is 8
m
m A A = 50 Il . 31l (3 _ 0.83) = 109 Il V2 31lm V
and the RMS drain current is .
Id
IlA
= 8mVgs = (109 ,,) . (100 mY) = 10.9 IlA
Notice that this drain current flows through both the DC and AC supplies in the circuit. An intuitive way to look at this circuit can be arrived at by observing that the ratio of the AC voltage across the MOSFET (v g) to the AC current through the MOSFET (i) is simply 118m' For an AC small-signal circuit we can replace the MOSFET with a resistor of value, in this case, of 9.2 ill. Note that this intuitive way of looking at the "diode-connected MOSFET" works for both weak and strong inversion. • Now let's investigate what happens when the source potential varies and the substrate, gate, and drain are at AC ground. Shown in Fig. 9.3 is the test circuit used to determine how the source-substrate potential variations affect the drain current. In this analysis, we will neglect the forward transconductance effects. These effects arise because vsb =- v gs ' The body transconductance is given by d ' JID=consl Ii: dVTHN 8mb = - [ J.ID = '/3(VGS - VTHN)(l + (J"c + Am)VDS) . - OVsb VDS=consl dVsb
(9.13)
We know that due to the body effect the threshold voltage will not be constant with changing substrate-source potential. Therefore, changes in VTHN will modulate the drain current. From Eq, (6.4)
Chapter 9 Analog MOSFET Models Kl
dV THN dVsb
169
K2=11
= 2JPHI+ VSB
(9.14)
where Kl is essentially 'Y of Ch. 5. Combining Eqs. (9.8), (9.13), and (9.14) gives (9.15) The factor 11 describes how the threshold voltage changes with reverse body bias. Typical values for 11 range from 0.6 to possibly a negative number for large source-substrate voltages. For large substrate-source bias voltages we will assume 11 = O. The small-signal model with the effects of the body-substrate current source is shown in Fig. 9.4. Notice that 11 is a small-signal parameter that is a function of the DC substrate-source potential. Indeed, all of the small-signal parameters derived in this section are a function of DC biasing.
+
Figure 9.3 Circuit used to determine the body-source transconductance. G
+
_____$gm V gs
s
V "
+
Vsb
B
Figure 9.4 Small-signal MOSFET with body-effect current source.
The output resistance of the MOSFET can be determined with the circuit shown in Fig. 9.5. A small AC test voltage, vd!" is applied between the drain and the source. The conductance is determined again by
13 d' JID=consl gds=r~l= [ aID =-2(VGS-VTHN)20"c+Am)=Iv-O"c+Am) VDS V = const DS
(9.16)
170
Part I CMOS Fundamentals
G
VGS
-
Figure 9.5 Circuit used to determine output resistance of the MOSFET .
This equation combined with Eq. (9.9) gives the maximum gain of a MOSFET stage. Figure 9.6 shows the small-signal model for the MOSFET, including the output resistance. Assuming the source and substrate are connected together (no body effect, vsb = 0), we that the maximum voltage gain, in the strong inversion region, is given by Vds -id' To -=---=-gm'To=Vgs..!!L
gm
~ ID(I.. c +Am )
=-
J2ff ~ .
'lID
(9.17)
A
where (9.18)
s
s B
Figure 9.6 Small-signal MOSFET with output resistance.
Example 9.2 Determine the output resistance of an n-channel MOSFET with L = W = I0 urn using the BSIM parameters when Vcs =3 V. Verify the answer with SPICE. From Ex. 9.1 VTHN =0.83 V, assuming no body effect. The DC drain current is then ID = 118 ~A, assuming KP = 50 J1AfVl. A"" Am = 0.06 V -I from Ex. 6.4. The output resistance is To = O.06,\/SX\0-6 "" 140 kQ. Using the BSIM model, SPICE gives, I D = 88 ~A and an To = 285 kQ at a VDS = 3 V. These values are
171
Chapter 9 Analog MOSFET Models very dependent on the value of Vvs used. This example also illustrates how hand calculations give ballpark-type answers. •
The small-signal output resistance, or channel resistance, of the MOSFET in the triode region is determined by
l
2
-.,. JID=const v DS ] oio 0-., «;-1 = [ --.,=--.,-~ (VGS-VTHN)VDS-T oV DS V canst oV DS
(9.19)
DS =
and thus, 1
R(V V ) I-' GS- THN
for
VDS
«
V GS - VTHN
(9.20)
9.2 High-Frequency MOSFET Model To obtain the high-frequency model of the MOSFET, we will add the MOSFET capacitances to the low-frequency model of Fig. 9.6. The capacitances between the drain and source diffusion regions, discussed in Ch. 5, labeled Cdb and Csb ' and the capacitance of the gate 'over the field region, Cgb ' will be added directly to the small-signal model. The capacitance between the gate and the drain is labeled Cgd and the capacitance between the gate and source was labeled Cg, . Figure 9.7 shows the high-frequency model.
c.: G
--~~-..,...---....--,
+
id
1-_ _-...
Vgs
--.-_ _-""'..-......-
D
To
S---t------...-------..---+---+-----+.+-.... S T
Cgb
TCdb B
Figure 9.7 Small-signal high-frequency MOSFET model.
Example 9.3 Estimate the capacitances in Fig. 9.7 for the layout (an n-channel MOSFET without substrate connection shown) in Fig. Ex9.3. Use the CN20 model parameters. Let's start by calculating C,b and C db• The size of the drain and source regions is 6 urn by 14 urn, Since the DC potentials of the drain and source is not specified, we will assume that VVB = V SB = 0 V. This will give the maximum possible depletion capacitance of these diffused regions. From the BSIM model parameters and Ch. 5
172
Part I CMOS Fundamentals
Poly over field
Figure Ex9.3 C sb = C sb,bottom + C sb.sidewall
and
Ca. =
Cdb,bottom
+ Cdb,sidewall
where CJ. AD Csb,bottom
=
Cdb,bottom
=
( 1+
~; )
MJ
=
(1.04 x 10--4~). (84 /lm 2) 0.66
= 8.8 fF
( 1 + 0°8 )
and CJSW· PD Csb,sidewall
=
Cdb,sidewall
= (
1+
)MJSW VDS
=
(2.2x 1O-1O~). (40 /lm)
°
(1 + 0.8)
018 .
= 8.8 fF
PBSW
so that Cs» = Ca»
= 17.6 fF.
The capacitance of the poly over field region, that is, the poly that extends over the n+ above, C gb , is estimated by CGBO· L = (3.8 x 10- 10 Flm) . 10 /lm= 3.8 fF. The gate-drain capacitance while in the saturation region is given by Cgd = CGDO· W, (3.8 x 1O-IO P/m) . 14 /lm= 5.3 fF. In the triode region, 800 x 10- 18 ~~2 . l Ouml-tum> 56 fF. however, Cgd = tc~x' W· L or Cgd =
t·
173
Chapter 9 Analog MOSFET Models Finally, the gate-source capacitance of the MOSFET in the saturation region is C gs = C~x . W· L, or C gs = 75 tF. •
t.
9.2.1 Variation of Transconductance with Frequency
Consider the circuit shown in Fig. 9.8. Since the potential across Cdb and Csb is fixed, we can eliminate them from the following frequency analysis. The small-signal equivalent circuit of Fig. 9.8 is shown in Fig. 9.9. The AC gate-source voltage of the MOSFET is given by 1 1 +JW' Zs(Cgb + Cgs + Cgd)
=V s . - - . - - - . . . : ; . . . . - - - -
(9.21)
with the transconductance given by, assuming gmVgs» VgJWCgd, gm(j) = id = gmO Vs 1 +jW· Zs(Cgb + Cgs + Cgd)
where gmo
= v.:,~O)
(9.22)
is the low-frequency transconductance.
Figure 9.8 Circuit used to determine frequency dependence of the forward transconductance.
c;
D
Cgb Cgs S
Figure 9.9 Small-signal equivalent circuit of Fig. 9.8.
S
174
Part I CMOS Fundamentals The current gain of a MOSFET can be defined by id
gm·Vgs
KP·¥:.(VGS-VTHN)
ig
Vgs· jro(Cgb + Cgs + Cgd)
jro(Cgb + Cgs + Cgd)
(9.23)
A useful term used to describe the relative "speed" of a process is the unity current gain frequency, 11" and is defined as the frequency where the magnitude of the MOSFET current gain is unity,
(9.24) or
- Kp· W(VGS- VTHN) 'srW(V V ) - - - GS- THN f T- 2rcL(Cgb+ c.; +Cgd) " zac;
(9.25)
This expression neglects the transit time of the carriers through the channel, which in general, for channel lengths within an order of magnitude of minimum length, is a negligible effect. Example 9.4 Estimate IT for a minimum-size n- and p-channel device in CN20 with VGS - VTHN = 1 V. For the n-channel MOSFET with L =2 urn and W =3 urn [r
J.LA
«r W se
2
I
2rcL·3"WLCox
=
50 V2 ·31J,m 2
F
2rc· 21J,m· 3". 21J,m· 31J,m· 800x 10- 18 1J.I112
= 3.74 GHz
and for the p-channel with KP = 17 ~, IT = 1.27 GHz. • The most important observation we can make from this example is that the unity current gain frequency is independent of the MOSFET width, or 3· KP (V - V ) f T -- 4rcL2C~x GS THN
(9 26) .
For high-speed design the minimum channel length should be used.
Example9.S For the circuit shown in Fig. EX9.5, determine the impedance looking into the source of the MOSFET. Neglect the body effect and assume that over the frequency range of interest id '" is. Since id '" is we know that Vs '" -V gs and id '" -gmV,. The impedance looking into the source is then given by Zintosource
= -~s = _glm = _gl . [l +jroRs(Cgb + Cgs + Cgd)] Is mO
Chapter 9 Analog MOSFET Models
175
Figure Ex9.5
or (9.27) or the impedance looking into the source of the MOSFET is a resistor of value 1. . . h . d f I R,(C.b+c.,+C.d ) . gmO III senes WIt an III uctor 0 va ue gmO • The results of this example have several important practical implications. First, the low-frequency resistance looking into the source of a MOSFET is g~ regardless of the impedance at the gate. When we are not concerned with the variation of the transconductance with frequency, we will write this resistance as = l3(vGs~ VTHN ) ' When the MOSFET is driven with a resistive source impedance, the impedance looking into the source of the MOSFET becomes highly inductive, which will cause ringing in source-follower circuits driving capacitive loads. If the impedance at the gate of the MOSFET is inductive, this occurs in the cascade of two source followers; the output impedance of the second follower can become negative (replace R, in Eq. [9.27] with the inductor impedance jroL). A negative impedance is a source of power like a battery. Oscillations and poor step response are probable.
L
9.3 Temperature Effects in MOSFETs The threshold voltage and the transconductance parameter change with temperature. The changes in the threshold voltage can be related to the temperature dependence of the surface inversion potential given by s(T)
= PH/(T) = PHI· T _ 3kT -In To
q
(L) _Eg(To) . T + Eg(T) To To
(9.28)
where Eg , in eV (l eV = 1.6 x 10⁻¹⁹ J), is the silicon bandgap energy given by _ --{; T2 Eg(T)-1.16-(702xlO )'T+ll08
(9.29)
The temperature coefficient of the threshold voltage over a range from -100°C to 100 °C can be estimated as 1 dVTHN ppm TCVTHN = - - . --:::: -3 000VTHN dT ' 'C
where the threshold voltage is given by
(9.30)
176
Part I CMOS Fundamentals VTHN(T) = VTHN(To)[l
+ TCVTHN' (T -
To)]
(9.31)
A PSPICE simulation of a CN20 n-channel MOSFETs threshold voltage variation with temperature is shown in Fig. 9.10. At these low currents, the temperature dependence of the threshold voltage dominates the change in the drain current. We could have also defined an absolute change of > -2.4 mvr C (TCVTHN • VTHN) , dependent on the magnitude of the threshold voltage. Note that SPICE2 or 3 from UC Berkeley does not have temperature- or noise-modeling capability with the BSIM1 model. ••• Top Level Netlist ••• M1_10u_10u 3400 CMOSNB L=10u W=10u 20 DC5 Vdd Vgs 40 DCO OV VIMTR1 23 ••••• Spice models and macro models ••••• .MODEL CMOSNB NMOS LEVEL=4 +VFB=-9.73820E-01, LVFB=3.67458E-01,WVFB=-4.72340E-02 + ... BSIM model parameters -pbsweo.s mj=0.66036 mjsw=0.178543 wdf=O dell=O ••••• End of spice models and macro models ••••• .probe .DC Vgs.5 1.5.05 temp -100101 50 .end
The temperature dependence of the transconductance parameter is derived from the temperature dependence of the mobility where T is in kelvin given by
)-1.5
(9.32)
(~)-1.5
(9.33)
T J..L(T) = J..L(To)· ( To
or KP(T) = KP(To)'
Figure 9.11 shows that at low-drain currents the effects of the surface mobility dominate the changes in the drain current, while at higher currents the mobility effects will dominate. For digital applications, the change in threshold voltage is usually negligible compared to the mobility changes; that is, the mobility changing generally has a much greater impact on the propagation delay than does the threshold voltage. From Fig. 9.11 we can also see that at Vas = 1.8 V the drain current is essentially constant. It could be concluded that biasing the device at this gate-source voltage would create temperature- independent circuits. Indeed, this is true. However, variations in the process and a method to accurately bias at this voltage make this result difficult to implement in many cases. (One implementation uses the beta multiplier of Ch. 21.) Example 9.6 One benefit of using MOSFET transistors in power applications is that the drain current decreases with increasing temperature, keeping the transistor from thermal runaway. Using Fig. 9.11, comment on this assumption.
Chapter 9 Analog MOSFET Models
177
D l.OuA.. , . . - - - - - - - - - , - - - - - , - - - - - r - - - - , - - , . . . - - - - - - - ,
r
a
i n
c
u r
r e n t
0.1uA I----.,....-..L----+---.L---r---L--.L.r-----,----~ 0.4V
0.6V
l.OV
.I(VIMTRl)
l.2V
l.4V
l.6V
Vgs
Figure 9.10 Threshold voltage change with temperature for VGS approximately VTHN •
D 100uA--------------,....--r-r---r-----r------, r a i n
c
u
r r
e
n t
OA*---~~~ 0.5V D
l.OV
I(VIMTRI)
l.5V
-.....__-__.__------,,----.----~ 2.5V
2.0V
3.0V
Vgs
Figure 9.11 Mobility effects when VGs » VTHN •
3.5V
4.0V
178
Part I CMOS Fundamentals
From Fig. 9.11 if we hold the gate-source voltage at 2.5 V, the drain current will decrease with increasing temperature. At VGS = 2.5 V, the variation of the mobility with temperature dominates. If we look at VGS = 1.25 V, we see that the drain current increases with increasing temperature, due to the surface inversion potential dominating the temperature characteristics. Therefore, unless VGS » VTHN , the problem of thermal runaway still exists . •
9.4 Noise in MOSFETs The noise generators in MOSFETs are due to thermal and flicker (ll/noise, pronounced "one over f noise") noise. The RMS thermal noise current is generated by the effective channel resistance and by the parasitic drain (R D) , source (R s)' gate (R G) , and substrate (RR) resistances, and is given by
IT -_j¥!kT
~llw
N:
RD
= J4kT Rs
(9.34) (9.35)
IT _j¥!kT
(9.36)
th=wa vR;
(9.37)
~IRG -
RG
where (see Sec. 7.3, k = 1.38 X 10⁻²³ Ws/°K) the temperature, T, is in kelvin, and the measurements are made over a bandwidth, B.
t .L
The thermal noise due to the channel resistance, modeled by a resistor of while in the saturation region and R eH in the triode region, is given, in the saturation region, by
J
·2 ltherm
8kT ..;2p· r,;;;:-;4kT . 3-3- = J-3-' =V~ /D
(9.38)
This is a noise source placed between the drain and source of the MOSFET. The 11/(flicker) noise can be modeled by an RMS noise source given by
IT KF·/'i! "Vi/f = f : ox L 2
c: .
(9.39)
where KF is the flicker noise coefficient, a typical value is 10-25 V2F, /D is the DC drain current, AF is the flicker noise exponent, a value ranging from 0.5 to 2, and / is the frequency variable we integrate over. A noise model for the MOSFET is shown in Fig. 9.12. All noise sources are RMS. In addition, the voltage or current gain in an
Chapter 9 Analog MOSFET Models
179
RD
Ro G
D
+ V gs
S
______---IT Cdb
TCg b
Fiaure 9.12 Noise model for MOSFET.
amplifier can be used instead of the power gain. See Sec. 7.3 for a review of noise calculations. For hand calculations, the thermal noise effects due to the parasitic resistances will be neglected. If this is the case, the only noise sources we will evaluate using hand calculations are the channel thermal and flicker noise contributions. Both of these noise sources can be reflected back to the gate of the MOSFET. The RMS magnitudes of the noise voltages in series with the gate terminal are given by
fF=
J
2 _ Vtherm -
Vl/herm
(9.40)
gm
and
Jv-» = g;;;[it; 2
(9.41)
The body effect has been neglected. If the source is not connected to the substrate, then gm should be replaced with gm - gmb in the above equations, including Eq. (9.36). Sometimes Eqs. (9.38) and (9.39) are used to get an intuitive glimpse of how MOSFET noise, on the input to an amplifier, will limit the minimum input signal amplitude. Example 9.7 Estimate the RMS output noise for the circuit of Fig. Ex9.7 over the bandwidth of 1 to 1 kHz. Use CN20 process parameters with L = W = 10 urn and KF = 10-25 y 2F and AF = 1.3. Assume that the parasitic MOSFET resistances generate a negligible amount of thermal noise. The DC gate voltage is approximately 3.3 Y and is determined by solving 5- Vos 10k
~ 2
2
J.l.A y
- - = -(Vos- VTHN) = 25-(Vos -083) 2 '
2
180
Part I CMOS Fundamentals
The drain current is 153 IJA. The noise model for the circuit is shown above, following step I given in Ch. 7. Using superposition, we can determine the RMS output noise voltage from each noise source. Noting that the gate-source voltage and the output voltage are the same signal, we can write, for the thermal noise current source modeling, the noise generated by the 10 k resistor,
IOk(
Jiiok +gmvgs) =-vgs
or V gs
= Vout =-
J
·2
..L gm . 10k
llOk . ""::';;;'--1
10k + g;;;
L
This shows that the MOSFET behaves like a resistor of value when its gate and drain are tied together. Therefore, to save time and effort we would simply replace the current source above (gmVg,) with this noiseless resistor and perform the noise calculations. We continue the noise analysis by determining the output RMS noise voltage from each source. Note that you cannot add the noise sources into one noise source, unless you first square each component. The thermal noise from the channel resistance is given by Ji;herm
=
J4. 1.38 x 10⁻²³ . 300· ~J4' 25~NV2. 153~A
= 1.2
~
and since g~ = 8.1 k!1 2
Vthermout
.
II nV = 1.2 pA r;z . 10k 8.1k= 5.4 r;z yHz
yHz
while the lIj(flicker) noise is given by /2 IIlJ,d
10-25 . (150~A)1.3 = 3.7 nA = !,(10)2'(800xlO-18 ) jj
with output RMS noise voltage due lIj noise as
J
2
vlIJ,out
= 3.7 nA jj . 10kII 8.1k= 16.6 ~V jj
The output thermal RMS noise from the 10 k!1 resistor is given by
J
2 VlOk
J
nV = 10kII 8.1k· 4kT 10k = 5 .8 .jfu
We square each RMS component and integrate over the bandwidth of interest. The total mean squared output noise voltage is given by
Chapter 9 Analog MOSFET Models
181 1/!
.
276 X 1O-12 y
2
f or evaluating the integral II!
The total RMS output noise voltage over the bandwidth of 1 to 1 kHz is given by
t:f
=43.711Y. The RMS output noise is dominated by the 1ifnoise. From the results above, we observe that the same amount of 1if noise exists in a bandwidth of 1 to 1 kHz as a bandwidth of 1 MHz to 1 GHz, or a bandwidth of once per day to 1,000 times a day. • 10k
5V
Drain, Gate 10k
Noise model
+ V our = vgs
Figure Ex9.7
REFERENCES [1]
F. Maloberti, "Layout of Analog and Mixed Analog-Digital Circuits," in J. E. Franca and Y. Tsividis, eds., Design of Analog-Digital VLSI Circuits for Telecommunications and Signal Processing, 2nd ed., Prentice-Hall, 1994. ISBN 0-13-203639-8.
[2]
C. D. Motchenbacher and F. C. Fitchen, Low-Noise Electronic Design, John Wiley and Sons, 1973. ISBN 0-471-61950-7.
[3]
H. L. Krauss, C. W. Bostian, and F. H. Raab, Solid State Radio Engineering, John Wiley and Sons, 1980. ISBN 0-471-03018-X.
182
Part I CMOS Fundamentals
PROBLEMS Unless otherwise stated, use the CN20 process. 9.1
Sketch the p-channel equivalent to Fig. 9.6 using the p-channel variables, vsg and Are these small-signal voltages positive or negative numbers? Refer to Appendix A.
Vb,,'
9.2
Plot the drain current against VGS for the MOSFET shown in Fig. P9.2 using a SPICE DC sweep. What is the approximate slope of a line tangent to this curve at VGS = 2 V. What does the reciprocal of this slope correspond to?
Figure P9.2
9.3
Determine the AC drain current for the circuit given in Ex. 9.1 if L = 2 11m and W = 5 11m with VGS = 1.5 V and vgs =10 mY. Verify your answer with an AC SPICE simulation.
9.4
Estimate, using hand calculations, the AC drain current that flows in the following circuit. The MOSFET has W = 15 11m and L = 5 11m.
3V 1.5 V
'V
100 mV
Figure P9.4
9.5
Verify the answer in Problem 4 using SPICE.
9.6
Repeat Problem 4 with VGS = 3 V and VDS = 1.5 V (v ds is still 100mV).
9.7
Plot the drain current against VSG for the MOSFET shown in Fig. P9.7 using a SPICE DC sweep.
9.8
Estimate the AC drain current that flows in the circuit of Fig. P9.8. The p-channel MOSFET has W = 70 11m and L = 5 urn, How does the AC drain current change if VDD = 0, that is, the source of the p-channel MOSFET is connected to ground?
183
Chapter 9 Analog MOSFET Models
VSG
Figure P9.7 V sg
VSG =
= 10 mV
1.5 V _
Figure P9.8
9.9
Verify the answer in Problem 8 using SPICE.
9.10
Repeat Problem 8 for the circuit of Fig. P9.1O and verify the answer with SPICE. VDD=5V
VSG
= 1.5 V -
Figure P9.10
9.11
Repeat Ex. 9.3 where the layout shown in Fig. Ex9.3 is a p-channel MOSFET in an n-well.
9.12
Figure P9.12 shows the test setup used to determine a MOSFET t-. Using this setup and SPICE, verify the results of Ex. 9.4. Remember that the MOSFET must be biased in the saturation region. How are the drain current and gate current related at the frequency iT and at DC?
9.13
For wide operating range in analog circuits VGS Comment on how this affects the speed of a circuit.
-
VTHN is made very small.
184
Part I CMOS Fundamentals
+
VDS
V gs
O-+------...:>f...---+
f Figure P9.12
9.14
Does the n-channel MOSFET threshold voltage increase or decrease with increasing temperature? Some CMOS processes have MOSFETs with threshold voltages around 0.5 V. Comment on the problems associated with decreasing the threshold voltage in a CMOS process down to a few hundred millivolts. Use drawings to illustrate the problems. (Hint: Consider temperature effects and subthreshold current.)
9.15
Verify, with SPICE, the RMS output noise voltage of 43.7 IlV given in Ex. 9.7.
9.16
Determine the RMS output noise in the following circuit over the frequency range from 1 to 10 kHz. Verify your answer with SPICE. Neglect parasitic MOSFET resistances and assume that the device capacitances have little effect on the noise performance over this frequency range.
+5
lOOk t------- V OU!
1.5
v-j
L= W= l O um
Figure P9.16
Chapter
10 The Digital Model
In this chapter we present the digital model of the MOSFET. At this point, the student should feel relatively comfortable with simulating and laying out CMOS circuits and the parasitics associated with the CMOS process. The transition into digital circuit design should be relatively straightforward.
10.1 The Digital MOSFET Model Consider the MOSFET circuit shown in Fig. 10.1. Initially, the MOSFET is off, VGS = 0, and the drain of the MOSFET is at VDD. If the gate of the MOSFET is taken instantaneously from to VDD, a current given by
°
ID =
K~n . ~. (VDD- VTHN)2 = %. (VDD- VTHN)2
(l0.1)
initially flows through the MOSFET. Point A in Fig. 10.2 shows the operating point of the MOSFET prior to switching for VDD = 5 V. After switching takes place, the operating point moves to point B and follows the curve VGS = VDD down to ID "" and VDS =0, point C.
°
Drain voltage initially at VDD
VDD
o~~
:&
Cap. initially charged to VDD
VGS
Figure 10.1 MOSFET switching circuit.
186
Part I CMOS Fundamentals
D 500uA-----------------r a One over slope of this line is i VGS=5v
-----,
the average ress~is:ta~n:ce~::::=::::=~~~t----------l of the MOSFET '\B
n
c u r r
VGS 4v
e n
t
VGS 3v
VGS 2v
C
k""A 2V
4V
VDD
BV
BV
IOV
VDS Figure 10.2 Diagram used to determine average resistance of a MOSFET during switching.
An estimate for the resistance between the drain and source of the MOSFET is given by the reciprocal slope of the line BC in Fig. 10.2, or R = n
VDD
KP W 2 TL' (VDD- VTHN)
=R' . .b... n W
(10.2)
The MOSFET is modeled by the circuit shown in Fig. 10.3. When VGs > VDDI2, the switch is closed while VGS values less than VDDI2 the switch is open. In the derivation of this model, we assumed that the input step transition occurred in zero time; that is, the risetime was zero, so that the point at which the switch was opened or closed was well defined. In practice, we will not encounter a zero risetime pulse; therefore, the model has limitations. Nevertheless, the model works remarkably well in designing and analyzing digital circuits, giving results that are within a factor of two of simulation or measurement in general applications. Application of the BSIM model parameters to this digital model can, to a first order, predict the increase in effective resistance for short channel devices. For short channel devices, the drain current increases linearly with VGS rather than as the square. Characterization of these MOSFETs usually results in a lower value of MUZ, accounting for the mobility degradation effects present. The digital model resistance can be written in terms of the BSIM model parameters by
s, =
2£· VDD MUZ· C~x' W· (VDD- VTHN)2
=R~ . .b... W
(10.3)
Chapter 10 The Digital Model
187
Drain
Gate
Q>------ VDDI2 and open whenVGs < VDDI2
Source
Figure 10.3 Simple digital MOSFET model.
10.1.1 Capacitive Effects At this point, we need to add the capacitances of the switching MOSFET to our model of Fig. 10.3. Consider the MOSFET shown in Fig. 10.4 with capacitance Coxl2 between the gate-drain and the gate-source electrodes. This is the capacitance when the MOSFET is in the triode region. In our development of the digital MOSFET model, we will neglect the depletion capacitances of the source and drain implants to substrate. When the input pulse transitions from 0 to VDD, the output transitions from VDD to O. The current through Cgd (= CoJ2), assuming a linear transition, is given by 1- C -
gd
. dVgd _ Cox. VDD- (-VDD) _ C . VDD _ C . dVDS dt - 2 /).t - ox /).t - ox dt
(10.4)
The voltage across Cgd changes by 2·VDD. The current that flows through this capacitance is the drain current of the MOSFET in Fig. 10.4. We can break Cgd into a component from the gate to ground and from the drain to ground of value 2Cgd or Cox. The complete model of a switching MOSFET is shown in Fig. 10.5.
VDD
y
Large resistor Drain voltage initially at VDD
Figure 10.4 MOSFET switching circuit with capacitances.
188
Part I CMOS Fundamentals
Switch closed when VGS > VDD/2 and open when VGS < VDD/2
Source
Figure 10.5 Simple digital MOSFET model.
10.1.2 Process Characteristic Time Constant
An important question we can answer at this point is, "What is the intrinsic switching speed of a MOSFET?" Looking at Figs. 10.4 and 10.5, we can see an intrinsic time constant of RnCox' That is, if the drain is charged to VDD as in Fig. 10.4 and the input switches from 0 to VDD, the output voltage will decay with a time constant of RnCox' For an n-channel transistor, this is given by
'tn=RnCox=
2L· VDD 2' KPnW(VDD- VTHN)
C~xWL=
2L2C~x' VDD KPn· (VDD- VTHN)2
(10.S)
Notice that the "speed" of a process increases as the square of the channel length and that it is independent of the channel width, W. Also note that the larger VDD, the faster the process. This is very similar to the unity current gain frequency.j.., we discussed in the last chapter. Example 10.1 Estimate the process characteristic time constants for CN20, both n- and p-channel devices, using the BSIM model parameters.
We can start the solution of this problem by finding R', and R'p using Eq. (10.3). For the n-channel,
s, = R' . 1:.. = n W
2· VDD
.1:..=
MUZ.C~iVDD-VTHN)2 W
2· S . (UW) (S98crn2)(800..!L)(I08I!rn2)(S_0.83)2 V-s 1!ffi2 cm2
= 12 kn· 1:.. W and for the p-channel Rp
L
= R~ . - = W
2·5·b. L w8 "" 36 kn· (211£!!t) (800£..) -0.92)2 W 2 v« crn2 crn1!ffi2)(S
(10
Chapter 10 The Digital Model
189
The process characteristic time constants for minimum length devices are given by
't n
m
aF) W(2Ilm) =38 ps
211 ( 800-=RnC ox = 12k·--· 2
W
11m
and
'tp
=RpC ox = 3'tn = 114 ps
•
This example has several practical results. The resistance of the n-channel MOSFET is three times smaller than that of the p-channel MOSFET, resulting in a factor of three differences in the time constants. This is because the mobility of the electrons is three times greater than the mobility of holes in the CN20 process. Also note that the effective resistances calculated in this example, for VDD = 5V, do not change, so that we can use these in the coming chapters. 10.1.3 Delay- and Transition Times
Before we go any further in the discussion of the digital models, let's define delay and transition times in logic circuits. Consider Fig. 10.6. The top trace represents the input to a logic gate, while the bottom trace represents the output. Note that there was no logic inversion between the input and output; however, the following definitions apply equally well to the case when there is an inversion. The input rise- and falltime are labeled t, and tf , respectively. The output rise- and falltime are labeled tUl and tHL' respectively. The delay-time between the 50 percent points of the input and the output are labeled tPLH and tpHL depending on whether the output is changing from a high to a low or from a low to a high. These definitions are extremely important in characterizing the time-domain characteristics of digital circuits.
tPHL
VOH
VOL 1-----.....1
Figure 10.6 Definition of delays and transition times.
190
Part I CMOS Fundamentals For the simple RC circuit shown in Fig. 10.7, the delay-time is given by tdelay
(10.6)
= 0.7RC
and the rise- or falltime is given by trise
(10.7)
= 2.2RC
For our simple digital model of Fig. 10.5, we will assume that the propagation delay-time, whether high to low or low to high, is given by one time constant, or t nn.,
R n •p . C tot
(10.8)
2R n•p . Ctot
(10.9)
tPLH ""
and the output rise- and falltimes are given by tHL, tLH ""
where Crol is the total capacitance from the drain of the MOSFET to ground and Rn, p is the effective resistance of the n- or p-channel MOSFET, respectively. These models do not give exact results. The models are useful for determining approximate delay and transition times, usually to within a factor of two.
"t11C \.. ~
P R fu
C
~
't'
0.7RC
2.2RC
Figure 10.7 Delay- and risetime for a simple RC circuit.
Example 10.2 Using hand calculations, estimate the risetime and delay-time of the following circuits (Fig. 10.8). Compare your results to SPICE simulations.
(J
50 fF
5
----.r- --1
o
3/2
Initally charged to5 V
5~~in ~50fF o
~
Figure 10.8 Circuits used in Example to.2.
(
Initially at 0 V
Chapter 10 The Digital Model
191
The effective resistance of the n-channel MOSFET, from Ex. 10.1, is R, = 12k .~: = 8 kQ and for the p-channel Rp = 24 kQ. Cox is given by 2J1Il1·3/.lm·800 aF//.lm2 = 4.8 fF. The circuit with the digital models drawn is shown in Fig. 10.9. The capacitance, Cox' between the drain and source of the p-channel MOSFET is drawn from the drain to ground rather than from the drain to the source (VDD). Electrically, there is no difference in the circuits. Conceptually, it is easier to see that Cox is in parallel with the 50 fF capacitor when the circuit is drawn in this way.
n-channel model Init, @SV
o
8k
4.8fl
:
QCtot _
T
-
VDD· T
ClOt
(11.17)
The average dynamic power dissipated by the inverter is P avg = VDD· I avg =
C tct ' VDD 2 2 ~ T = Ci«: VDD 'Jclk
(11.18)
Notice that the power dissipation is a function of the clock frequency. A great deal of effort is put into reducing the power dissipation in CMOS circuits. One of the major advantages of dynamic logic (Ch. 14) is its lower power dissipation.
VDD
Charge supplied when input is low
Charge removed when input is high
Figure 11.11 Dynamic power dissipation of the CMOS inverter.
Chapter 11 The Inverter
211
To characterize the speed of a digital process, a term called the power delay product (PDP) is often used. The PDP, measured in joules, is defined by PDP = P a vg
• (tPHL
+ tPLH)
(11.19)
These terms can be determined from the ring oscillator circuit of the previous section. The PDP is frequently used to compare different technologies or device sizes; for example, a GaAs process can be compared with a 0.8 urn CMOS process. Although the GaAs process may have a lower propagation delay, the power dissipation may be larger and result in a larger PDP. Example 11.7 Estimate the PDP of CN20, using hand analysis of a five-stage ring oscillator with Wn = Wp = 10 urn. Simulate the oscillator with SPICE and compare the results to the hand calculations.
The effective resistances of the n- and p-channel MOSFETs are 2 urn R nl = 12k· 10 flm = 2.4 kQ 2 urn Rp 2 = 36k . 10 flm = 7.2 kQ
The input capacitance of any inverter is Ci; = enn + Cinp =
~C~x(WnLn + WpLp) = ~. 800 aF . (10·2+ 10·2) =48 fF
the output capacitance is C out = C OUIn + C outp = C~x(WnLn + WpLp) = 32 fF
The total capacitance on the output of any inverter is the sum of its own output capacitance and the input capacitance of the next (identical) stage. This is given by C tot = Cout + C in = 80 fF
thus tPHL
+ tPLH = (Rnl + R p2)Ctot = (2.4k + 7.2k) . 80fF= 768 ps
The oscillator frequency, from Eq. (11.11), is then I
212
Part II CMOS Digital Circuits size devices are specified. The average power dissipated per inverter, using Eq. (11.18), is
P avg
= 80 tF . (5)2 . (260 MHz) = 520 IlW
The power delay product, using hand calculations, is 400 fl (femto-joules). SPICE simulation gives a PDP of 330 fl. • 6.0V..--------
---,
4.0V
2.0V
OV
"-,J
-2.0Vl-------.------,...-------,----........- - - - - l Os 5ns 25ns a V(2) Time
Figure 11.12 SPICE simulation of the five-stage ring oscillator of Ex. 11.7.
11.3 Layout of the Inverter If care is not taken when laying out CMOS circuits, the parasitic devices present can cause a condition known as latch-up. Once latch-up occurs, the inverter output will not change with the input; that is, the output may be stuck in a logic state. To correct this problem, the power must be removed. Latch-up is especially troubling in output driver circuits. Manufacturers of integrated circuits often use NMOS inverters (discussed later in this chapter) for output drivers, thus eliminating the possibility of latch-up.
11.3.1 Latch-up Figure 11.13 illustrates two methods of laying out a minimum-size inverter. The cross-sectional view in Fig. 11.14 shows both the n-channel and the p-channel MOSFETs that make up an inverter. Notice first that in Fig. 11.7, the output pulse feeds through the gate-drain capacitance. This causes the output to change in the same direction as the input before the inverter starts to switch. This feedthrough and the parasitic bipolar transistors cause the latch-up.
Chapter 11 The Inverter
213
Figure 11.13 Two inverter layout styles.
In Fig. 11.14, the emitter, base, and collector of transistor Ql are the source of the p-channel, the n-well, and the substrate, respectively. Transistor Q2's collector, base, and emitter are the n-well, substrate, and source of the n-channel transistor. Resistors RWI and RW2 represent the effects of the resistance of the n-well, and resistors RS 1 and RS2 represent the resistance of the substrate. The capacitors C 1 and C2 represent the drain implant depletion capacitance, that is, the capacitance between the drains of the transistors and the source and substrate. The parasitic circuit resulting from the inverter layout is shown in Fig. 11.15. If the output of the inverter switches fast enough, the pulse fed through C2 (for positive going inputs) can cause the base-emitter junction of Q2 to become forward biased. This then causes the current through RW2 and RWI to increase, causing Ql to turn on. When Ql is turned on, the current through RSI and RS2 increases, causing Q2 to turn on harder. This positive feedback will eventually cause Q2 and Ql to turn on fully and remain that way until the power is removed and reapplied. A similar argument can be made for negative-going inputs feeding through C1.
Several techniques reduce the latch-up problem. The first technique is to slow the rise- and falltimes of the logic gates, reducing the amount of signal fed through Cl and C2. Reducing the areas of Ml and M2's drains lowers the size of the depletion capacitance and the amount of signal fed through. Probably the best method of reducing latch-up effects is to reduce the parasitic resistances RWI and RS2. If these resistances are zero, Ql and Q2 never turn on. The value of these resistances, as seen
214
Part II CMOS Digital Circuits
A(inverter input) n-channel, Ml
-channel, M2
Well connection
RSI
p-substrate
Figure 11.14 Cross-sectional view of an inverter showing parasitic bipolar transistors and resistors.
VDD
RWI
Sl RW2
Can causeQ2 to turn on
SubstrateL-_ _- . - J Source of n-channel
Figure 11.15 Schematic used to describe latch-up.
Chapter 11 The Inverter
215
in Fig. 11.14, is a strong function of the distance of the well and substrate contacts. Simply put, the closer these contacts are to the inverter, the fewer are the chances the inverter will latch up. These contacts should be not only close, but also plentiful. Placing substrate and well contacts between the p- and n-channel MOSFETs provides a low-resistance connection to VDD and ground, significantly helping to reduce latchup (see Fig. 11.16 for a simple layout example). Placing n+ and p+ areas between or around circuits reduces the amount of signal reaching a given circuit from another circuit. These diffusions are sometimes called guard rings. Notice that poly cannot be used to connect the gates of the MOSFETs, since poly over the n+ or p+ will be interpreted as a MOSFET. Therefore, metal2 is used to connect the p- and the n-channel MOSFETs together. The cost for reducing the possibility of latch-up is a more complicated layout in a larger area. Large MOSFETs, required to drive off-chip loads, are especially susceptible to latch-up because of the large drain depletion capacitances. The only way to design latch-up free output drivers is to use only one type of MOSFET, in most cases an n-channel. Eliminating the n-well and the p-channel transistor eliminates the possibility of latch-up. This will be discussed further in the next section.
V//-/A4E+--
Metal2
n+ p+
Y//-l*--
Metal2
Figure 11.16 Alternative standard-cell frame used for better latch-up protection.
216
Part II CMOS Digital Circuits
11.4 Sizing for Large Capacitive Loads Designing a circuit to drive large capacitive loads with minimum delay is important when driving off-chip loads. Consider the inverter string driving a load capacitance, labeled Clond and shown in Fig. 11.17. If a single inverter were to drive C lond' the delay times would be (11.20) If, moving toward the load, cascading N inverters are used, each inverter larger than the previous by a factor A (that is, the width of each MOSFET is multiplied by A), a minimum delay can be obtained as long as A and N are picked correctly. Each inverter's input capacitance is also larger than the previous inverter's input capacitance by a factor of A. If the load capacitance is equal to the input capacitance of the last inverter multiplied' by A, then
Input C of final inverter
= Cinl . AN =Cloaa
(11.21)
where Cia 1 is the input capacitance of the first inverter. Rearranging Eq. (11.21) gives 1
A = [Cload]N C;nl
(11.22)
The total delay of the inverter string is given by (tPHL+tPLH)total=~Rnl+Rpl)(C:0utl+ACinl~+ First-stage delay
(Rnl+Rpl) 2 A . (ACoutl+A Cinl)
.
...
(11.23)
Second-stagedelay
where R a l and R p 1 are the effective resistances of the first inverter and Courl is the output capacitance of the first inverter. As the inverters are increased in size by A, their capacitances, both input and output, increase by A while their resistances decrease by a factor A. The equation (11.23) can be written as N
(tPHL
+ tPLH) total =
L
(R nl + Rpl)(Coutl + ACinI) = N(Rnl
+ Rpl)(Coutl +ACinl)
(11.24)
k=1
~Cload Figure 11.17 Cascade of inverters used to drive a large load capacitance.
I Consider this as if the load capacitance were simulating the input capacitance of the next inverter (if there was another inverter).
217
Chapter 11 The Inverter or with the help of Eq. (11.22): (tPHL +tPLH) total = N(Rnl + RPl{Coull +
(~~nald ) ~ . Cinl]
(11.25)
The minimum delay can be found by taking the derivative of this equation with respect to N, setting the result equal to zero, and solving for N. Taking the derivative of Eq. (11.25) with respect to N gives (Rnl+Rpl)COuIl+(Rnl+Rpl) C inl
) ~ +N· (C1oad)~ln(CIoad/C;nd] C'nl C'nl _N2 [( Cload
=
0(1126 .)
The first term in this equation is the intrinsic delay of the first inverter in our cascade of inverters. If we assume that this delay is small, solving this equation for N gives (11.27) Eqs. (11.27) and (11.22) are used to design a cascade of inverters in order to drive a large capacitance. Note that the larger the first inverter, the fewer the number of inverters needed to drive a given capacitive load. Logic families like the 74HCXX series use fairly large MOSFETs throughout the entire chip. This allows driving large capacitances, say >50 pF, with typically two or three buffer stages. In very-large-scale integration (VLSI) design where the MOSFETs are generally close to minimum size, the number of stages can be greater than this. The following example illustrates output buffer design in its simplest form. Example 11.8 Estimate tPHL + tp LH for the inverter shown in Fig. Ex11.8 driving a load capacitance of 20 pF. Design a buffer to drive the load capacitance with a minimum delay. Compare the propagation delays of both circuits using SPICE. The total propagation delay of the unbuffered inverter is given by I md I Pili = (
12k~ + 36kn[:13 800c~;::,:
8oo"p +
2~"PF ]
9/3
~C'-'=20PF Figure Exll.8
= 320 ns !
218
Part II CMOS Digital Circuits pesigning a buffer begins with determining Cin 1• For the present case Cin l= = 28.8 fF. The number of inverters using Eq. (11.27) is
'2Coutl
20 pF ) N = In ( 28.8 tF
= 6.54 ~ 7 stages
In order to maintain the same logic, that is, an inversion of the input signal, we will use seven inverters. In practice, the difference in delay between six and seven inverters is negligible. If we did not want a logic inversion, we would use six stages. The area factor is then 1
A = [ 20 pF ] '; = 2 55 28.8 tF .
The total delay, using Eq. (11.25), is then (tPHL
+ tPLH) total = 7(l6k)(l9.2 tF+2.55· 28.8 tF)
= 10.4 ns
or over 30 times faster. Since the p-channel width is three times that of the n-channel width, the propagation delay times, tPHL and tpLH , are equal, or tPHL
=tPLH = 5.2 ns
A schematic of the design is shown in Fig. 11.18. The actual sizes were changed to a number close to that given using the value of A calculated above to make the layout easier. Notice that the first inverter is the same inverter shown above. The SPICE simulation results are shown in Fig. 11.19. Note that the unbuffered inverter does not fully charge the capacitor since the input of the inverter changes back to zero volts 15 ns after it changes to VDD. •
2418
60/20
150150
375/125
960/320
24601820
Figure 11.18 Buffer designed in Ex. 11.8.
It should be clear that, although this technique results in the least delay in driving the 20 pF load, the MOSFETs needed are very large. In many applications, the minimum delay through a buffer is not required. A specification that the delay be less than some value is given. Consider the following example.
219
Chapter 11 The Inverter
_'i8) 'i11)
V
60
,gle nverter
,...
50
/' 40
\
30
-
j
tPHL 20
"\
7
tPLH
I
\
-,
10
k
J
~Cascadedi verter output
/
Inout ouls
-
00
-1.0
00
10.0
20.0
40.0
30.0
50.0
nS
time
Figure 11.19 Simulation results from Ex. 11.8.
Example 11.9 Redesign the buffer of Ex. 11.8 so that the delay, tPHL + tPLy , is less than 15 ns. (The minimum delay was 10.4 ns in Ex. 11.8.) In order to maintain the logic inversion, either three or five stages should be used. Let's begin by trying three stages. The area factor for three stages is given by 20 pF
A = [ 28.8 tF
]1/3
= 8.86
The delay is calculated using Eq. (11.25) and is given by tPHL +tPLH
= 3(16k)(19.2 tF+8.86· 28.8 tF) = 13.2 ns
or tPHL
=
tPLH
= 6.6 ns
The resulting buffer is shown in Fig. 11.20. The layout size of this buffer is significantly smaller than the buffer designed in Ex. 11.8, while the increase in delay is modest. • Layout ofLarge MOSFETs
The time and effort it takes to layout the large MOSFETs used in an output buffer can be greatly reduced using cell hierarchy. As a simple example, let's layout a 250/2
220
Part II CMOS Digital Circuits
81m
700/230 Output
Input
~20PF Figure 11.20 Buffer design of Ex. 11.9.
n-channel MOSFET. We begin by creating a cell, called NAA25X2 (n-active-area 25 by 2), with a rank of 1 and shown in Fig. 11.21.
Poly .-------~
~r__.n+
-+-~~~Contact
.
Figure 11.21 Layout of an n-channel MOSFET measuring 25 um (width) by 2 urn (length).
The next step is to create a cell called N250X2 with a rank of 2. We then set the object (using the obj command button in LASI) to the cell NAA25X2 and select the Add command button. Figure 11.22 shows four NAA25X2 cells added to the N250X2 cell. The "trick" when placing the NAA25X2 cells is to overlap the source/drain areas. As discussed in Ch. 5, this sharing of areas reduces the depletion capacitance to substrate of the drain/source implants. Figure 11.23a shows the layout of the 250 by 2 n-channel MOSFET with the sources, drains, and gates of each of the individual MOSFETs connected together. The only thing missing from this layout is the connection to the substrate. (Not providing well and substrate connections for the
Chapter 11 The Inverter
221
.....
'1:.:::11.::.: 1······'·"1·:
,
····1·· :::::,\\:. 1 ;:::.:1 IlL:;
: .:-:: ::« .... : :: co : ................
Noticethe overlapof the cells.
Ir
Figure 11.22 Placing basic cells to form a large MOSFET.
MOSFETs is a fatal layout error.) Since the standard-cell frame, SFRAME (with a rank of 1) in the CN20 setups provided with LASI, provides these connections, we could add this frame to our basic layout. The result is shown in Fig. 11.23b. 11.4.1 Distributed Drivers Consider the driver circuit shown in Fig. 11.24a containing 11 inverters. If all of the inverters shown in the figure are the same size, the delay from the input to the output is (11.28) Now consider the circuit shown in Fig. 11.24b with 13 inverters. Again, assuming all inverters are the same size, the delay from the input to the output is tPHL
+ tPLH =(R; + Rp)[(C out +2Cin) + (C out + 5Cin)] = tR; + R p)[2Cout + 7Cin] (11.29)
which is less delay than the circuit with 11 inverters. Often, distributing the signal into different paths can reduce the propagation delay. At this point we can ask the question, "Why not make the first inverter in the circuits of Fig. 11.24 really large so that it has small effective resistances for driving the ten inverters quickly?" The answer is simply that as we increase the size of an inverter, we also increase its input capacitance. In SPICE simulations, we use ideal voltage sources to drive the first gate in our circuit. In practice, this inverter is driven from another gate somewhere on the chip. Increasing the size will slow the propagation delay-time of the gate driving this inverter.
222
Part II CMOS Digital Circuits
(a)
(b)
Figure 11.23 (a) Layout of a 250 by 2 n-channel MOSFET and (b) using a standard-cell frame.
Chapter 11 The Inverter
223
Input
(b)
(a)
Figure 11.24 Distributed drivers.
11.4.2 Driving Long Lines Often when designing large systems, a signal may need to be driven across the chip. In some cases, for example, dynamic random-access memory (DRAM), the signal must be transmitted over a line that has a large parasitic resistance and capacitance. We need to develop a method of determining the delay through this line using hand calculations. This will lend insight to the design and help to determine exactly how to design the driver (or drivers). Consider the driver circuit shown in Fig. 11.25. The inverter is driving an RC transmission line with resistance/unit length, r, capacitance/unit length, c, and unit length, l. We can estimate the delay from the input to voltage across the capacitor by adding the delays. This is given by tPHL
+ tPLH = (R; + Rp)(Cout + c l + Cload) +0.35· rei' + (r ·l)(Cload)
(11.30)
where the first term in this equation is the delay associated with the inverter driving the total capacitance at its output to ground. The second term is the delay through the line, while the last term is an estimate of the delay associated with driving a capacitive load through the line's resistance. The most common method of reducing the delay through the line is to place buffer stages at different locations along the line. This effectively breaks the line up and can lower the overall delay. If Cloud is a major contributor to the delay, a buffer can be inserted between the RC line and Cload to reduce the delay.
224
Part II CMOS Digital Circuits
~Cload Figure 11.25 Driving an RC transmission line.
11.5 Other Inverter Configurations Three other inverter configurations are shown in Fig. 11.26. The inverter shown in Fig. 11.26a is an NMOS-only inverter, useful in avoiding latch-up. The inverters shown in Fig. 11.26b and c use a p-channel load, which is, in general, most useful in logic gates with a large number of inputs (more on this in the next chapter). In general, the selection of the MOSFET sizes follows the 4 to 1 rule; that is, the resistance (R n or Rp ) of the load is made four times larger than the resistance of Ml. The output logic low will never reach 0 V for these inverters, and thus the noise margins are poorer than the basic CMOS inverter of Fig. 11.1. Also, DC power will be dissipated when the output logic level is a low since a drain current will flow through the inverters. The output high level of the inverter of Fig. 11.26c will reach VDD, while the other inverter's output high level will be a threshold voltage drop below VDD. It might be concluded that the power dissipation of the inverters shown in Fig. 11.26 is greater than the basic CMOS inverter. However, since the input capacitance of these inverters is less than the basic CMOS inverter and the output voltage swing is reduced, the inverter with the greatest power dissipation is determined by the operating frequency. At high operating frequencies, the basic CMOS inverter dissipates the most power.
VDD
VDD
Out
VDD
Out
1--_-+_ _ Out Ml
(a)
(b)
Figure 11.26 Otherinverter configurations.
Ml
(c)
Chapter 11 The Inverter
225
11.5.1 N-Channel Only Output Drivers
Because of the susceptibility of the basic CMOS inverter to latch-up, output drivers consisting of only n-channel MOSFETs are used. Figure 11.27 shows the basic "NMOS super buffer." When the input signal is low, Ml and M4 are off while M2 and M3 are on. The output is pulled to ground through M2. A high on the input to the buffer causes Ml and M4 to turn on pulling the output to VDD - VTHN , assuming the input high-signal amplitude is VDD.
VDD
...----Out In ----++---'
Figure 11.27 NMOS super buffer.
The reduced output voltage of the NMOS-only output buffer can be improved using the circuit of Fig. 11.28. The inverter driving the gate of M2 uses an on-chip generated DC voltage of nominally VDD + 2 V. This allows the output signal to reach
VDD VDD +2
...----Out In
Figure 11.28 Alternative output buffer.
226
Part II CMOS Digital Circuits
VDD. Thus, the output swings from 0 to VDD similar to the CMOS output buffer. Note that with the addition of an enabling logic gate, the gates of Ml and M2 can be held at ground, forcing the output into the high-impedance (Hi-Z) state. This is sometimes referred to as tri-state output since the output can be a 1, 0, or Hi-Z.
11.5.2 Inverters with Tri-State Outputs Two configurations used in the design of an inverter with tri-state outputs are shown in Fig. 11.29. A high on the S input allows the circuit to operate normally, that is, as an inverter. A low on the S input forces the output into the Hi-Z, or high-impedance state. These circuits are useful when data are shared on a communication bus. The logic symbol of the tri-state inverter is also shown in Fig. 11.29.
VDD VDD
In
In
Out
S Out
In
S
Figure 11.29 Circuits and logic symbol for the tri-state inverter. 11.5.3 The Bootstrapped NMOS Inverter Consider the modified version of the NMOS inverter of Fig. 11.26 shown in Fig. 11.30. This inverter configuration is called the bootstrapped NMOS inverter. It is used when the output voltage must swing up to VDD. To understand the operation, consider first the case when input to the inverter is a logic high. The MOSFET Ml is on, and the output is pulled down to approximately
Chapter 11 The Inverter
227
VOL = ( VDD- 2 V THN ) · R
Rnl
nl
+
(11.3p
R n2
For the device sizes given, VOL is approximately 1/2 V. Next consider the case when the input transitions from a high to a low. The MOSFET M4 is used as a capacitor. The idea is to capacitively couple the output pulse to the gate of M2. The result is an increase in the gate potential above VDD, allowing M2 to fully turn on (pulling the output up by its bootstraps). To understand the operation, consider the circuit shown in Fig. 11.31. MOSFET M4 is replaced with a capacitor C4 (= W4-L4 ·C'o) ' When Ml shuts off, with the input going low, a capacitive voltage divider exists between the output and the gate of M2 given by Change in M2's gate voltage = (VDD - V ot.): C 4
C4+ C, 2 C /nn (11.32) inn2 + C inn3
+
Without bootstrapping, M3 and M4, the gate of the M2 is tied to VDD and the output is limited to VDD - VTHN • If the gate of M2 is bootstrapped up to VDD + 2 V, then M2 fully turns on and the output goes to VDD. Therefore, the change in M2's gate potential should be > 2 V. In general, the size (W-L) of M4 should be ten times larger than the size of M3. This is equivalent to saying that C4 should be > 1O·Cjnn3 • Note that this is a dynamic effect. The gate of M2 under DC conditions is VDD - VTHN , while the output high is VDD - 2 VTHN or lower than the nonbootstrapped inverter of Fig. 11.26a.
VDD
M2,3/8 Out
M4,8/8
MI,3/2
Figure 11.30 Bootstrapped NMOS inverter.
Example 11.10 Simulate the operation of the inverter shown in Fig. 11.30 using SPICE. The simulation results are shown in Fig. 11.32. Notice how the output doesn't go all the way to ground or VDD. We can decrease the size (WIL) of M2 (increase
228
Part II CMOS Digital Circuits
Out
GateofM2
Initially at VOL final voltage VDD
Figure 11.31 Circuit used to illustrate the bootstrapping effect.
the size of its switching resistance) in Fig. 11.30 to make the output go closer to ground. The price we pay for this is an increase in t PUI' Also, the bootstrapped inverter will swing up to VDD if we increase the size of the capacitor M4. However, since this capacitor is charged through M3, the resulting increase in charging time will cause the maximum practical operating frequency of the gate to decrease. •
,--
5.0
Outpu
~r
r-
r: I -
I-
-
.....
4.0
Inpu tt'" 3.0
~
2.0
1.0
0.0
I.....--
L---
'---'
no
50.0
150.0
100.0
I"'"
L--.
200.0
nS
Figure 11.32 Simulation results for Example 11.10.
""" Top Level Netlist""" M1 1 1 20 CMOSNB + L=2u W=3u M2 1 2 Vout 0 CMOSNB + L=8u W=3u M3 Vout 2 Vout 0 CMOSNB + L=8u W=8u M4 Vout Vin 0 0 CMOSNB + L=3u W=2u V1 Vin 0 DC 0 AC 0 0 + PULSE(O 5 10n +1ns 1ns 20ns SOns) VDD 1 0 DC 5 AC 0 0 .OPTION ABSTOL=l n .tran 5n 200n 0 3n uic .end
Chapter 11 The Inverter
229
REFERENCES [1]
R. L. Geiger, P. E. Allen and N. R. Strader, VLSI-Design Techniques for Analog and Digital Circuits, McGraw-Hill Publishing Co., 1990. ISBN 0-07-023253-9.
[2]
N. H. E. Weste and K. Eshraghian, Principles of CMOS VLSI Design, Addison- Wesley, 2nd ed., 1993. ISBN 0-201-53376-6.
PROBLEMS Use the CN20 process for the following problems unless otherwise stated.
11.1
Design and simulate the DC characteristics of an inverter with Vsp approximately equal to VTHN • Estimate the resulting noise margins for the design.
11.2
Repeat Ex. 11.6 for MOSFETs with W = 10 11m and a load capacitance of 1 pF.
11.3
Estimate the oscillation frequency of a 31-stage ring oscillator using minimum-size inverters.
11.4
Layout the standard-cell frame of Fig. 11.16. Explain how the added implants help to reduce latch-up.
11.5
Design and simulate the operation of a buffer to drive a 50 pF capacitive load from an inverter with size of 150/50. The tPHL + tpLH should be less than 10 ns.
11.6
Repeat Ex. 11.9, using a minimum delay of 20 ns, where the first inverter in the series is minimum size, that is, 3/2 (p-channel) and 3/2 (n-channel),
11.7
Design and simulate the delay of a minimum-size inverter driving a 1 mm poly line terminated with a 1 pF capacitor.
11.8
Layout an inverter with a size of 4501150 using the standard-cell frame of Ch. 5.
11.9
Simulate the operation and explain the results for the NMOS super buffer shown in Fig. 11.27.
11.10 Repeat Ex. 11.10 if M4's size is increased to 20/20. 11.11 Repeat Ex. 11.5 using minimum-size (0.9/0.6) MOSFETs in the CMOS14TB process. 11.12 Repeat Ex. 11.6 using minimum-size MOSFETs in CMOS 14TB. 11.13 Sketch the cross-sectional views, at the positions indicated, for the layout shown in Fig. P11.13.
230
Part II CMOS Digital Circuits
Figure Pl1.13
Chapter
12 Static Logic Gates
In this chapter we discuss the DC characteristics, dynamic behavior, and layout of CMOS static logic gates. Static logic means that the output of the gate is always a logical function of the inputs and always available on the outputs of the gate regardless of time. We begin with the NAND and NOR gates.
12.1 DC Characteristics of the NAND and NOR Gates The two basic input NAND and NOR gates are shown in Fig. 12.1. Before we get into the operation, notice that each input into the gate is connected to both a p- and an n-channel transistor similar to the inverter of the last chapter. We will make use of the results of Ch. 11 to explain the operation of these gates. 12.1.1 DC Characteristics of the NAND Gate
The NAND gate of Fig. 12.1 requires both inputs to be high before the output will switch low. Let's begin our analysis by determining the voltage transfer curve of a gate with p-channel MOSFETs that have W = Wp ' L = Lp ' and n-channel MOSFETs with W = Wn, L = Ln' If both inputs of the gate are tied together, the gate behaves like an inverter. To determine the gate switching point voltage, Vsp ' we must remember that two MOSFETs in parallel behave like a single MOSFET with a width equal to the sum of the individual widths. For the two parallel p-channel MOSFETs in Fig. 12.1, we can write (12.1)
again assuming that all p-channel transistors are of the same size. The transconductance parameters can also be combined into the transconductance parameter of a single MOSFET, or (12.2)
232
Part II CMOS Digital Circuits
VDD
A
B
Circuit used to determine transfer curves
VDD A
M4
B
.--+-__-+-__....:Ae.:.-+ B
~ B~ A+B
Figure 12.1 NAND and NOR gate circuits and logic symbols.
If we neglect the body effect, then two MOSFETs in series (with their gates tied
together) behave like a single MOSFET with a channel length equal to the sum of the individual MOSFET lengths. Referring to the figure above of the NAND, we can write for the n-channel MOSFETs LI +L2 = 2L n
(12.3)
and the transconductance of the single MOSFET is given by
~I + ~2 = ~n 2
(12.4)
If we model the NAND gate with both inputs tied together as an inverter with an
n-channel transistor having a width of Wn and length 2L n and a p-channel MOSFET with a width of 2 Wp and length Lp ' then we can write the transconductance ratio as
Chapter 12 Static Logic Gates
233
Transconductance ratio of NAND gate =
~An
(12.5)
41-'p
The switching point voltage, with the help of Eq. (11.4), of the two-input NAND gate is then given by
!!t .
VTHN+(VDD- VTHP)
Vsp = ....:.....-:-----=----1 + rK"
(12.6)
v"4i3;
or in general for an n-input NAND gate (see Fig. 12.2), we get
Vsp =
JJ~p .VTHN+(VDD- VTHP)
...:...-........;---~""=----
1+
(12.7)
J !3n
N2'!3p
Again, it should be remembered that we have neglected the body effect (an increase in the threshold voltage with increasing VSB ) ' Voltage transfer curves using one input, with the others tied to VDD, will give slightly different results because of this effect.
VDD
••• Output N
Nr-I
Inputs
•• •
•• •
Figure 12.2 Schematic of an n-input NAND gate.
Example 12.1 Determine Vsp by hand calculations and compare to a SPICE simulation for a three-input NAND gate using minimum-size devices.
234
Part II CMOS Digital Circuits The switching point voltage is determined by calculating the transconductance ratio of the gate, or 50llA/V2·3j1m 2j1rn
17j1NV2·3j1m 2j1m
9. and then using Eq. (12.7),
= 0.572 . (0.83) + (5 -
V
0.92)
1.572
SP
=2 9 V .
The SPICE simulation results are shown in Fig. 12.3. The simulation gives a Vsp of approximately 3.1 V. •
v
vin 6.
vout;
a
Vout
~
V-
4. a
2. a
~
.>
»>:
»>
»>
~
\
.> 0.0 0.0
0.5
1.0
2. a
1.5
2.5
3.0
v
sweep
7 .>
I-swi ching pc int
I'-. 3.5
4.0
Input voltage
4.5
5.0
Vin
Figure 12.3 Voltagetransfer characteristics of the three-input minimum-size NAND gate.
12.1.2 DC Characteristics of the NOR gate Following a similar analysis for the n-input NOR gate (see Fig. 12.4) gives a switching point voltage of
Vs p =
J~:n
.VTHN+(VDD- VTHP)
~.-;..--------
1 + JN2.~n
s,
(12.8)
235
Chapter 12 Static Logic Gates
VDD
~•
N
Inputs
•• •
••
2
-+-_-f'-+__~~----'-Output
r--_ _
Figure 12.4 Schematic of an n-input NOR gate.
Example 12.2 Compare the switching point voltage of a three-input NOR gate made from minimum-size MOSFETs to that of the three-input NAND gate of Ex. 12.1. Comment on which gate is closer to ideal, that is, Vsp =VDD/2. The Vsp of the minimum-size three-input NOR gate is 1.35 V, while the Vsp of the minimum-size three-input NAND gate was calculated to be 2.9 V. For an ideal gate Vsp = 2.5 V, so that the NAND gate is closer to ideal than the NOR gate. This arises because the transconductance (actually the mobility) of the n-channel is larger than that of the p-channel, In CMOS digital design, the NAND gate is used most often. This is due partly to the DC characteristics, better noise margins, and the dynamic characteristics. We will also see shortly that the NAND gate has better transient characteristics than the NOR gate. •
12.2 Layout of the NOR and NAND Gates Layout of the three-input minimum-size NOR and NAND gates is shown in Fig. 12.5 using the standard-cell frame. MOSFETs in series, for example, the n-channel MOSFETs in the NAND gate, are laid out using a single-drain and a single-source contact. The active area between the gate poly is shared between two devices. This has the effect of reducing the parasitic drain/source implant capacitances. MOSFETs in parallel, for example, the n-channel MOSFETs in the NOR gate, can share a drain area or a source area. The inputs and outputs of the gates are on poly.
236
Part II CMOS Digital Circuits
t'JAND
Figure 12.5 Layout of the NAND and NOR gate.
12.3 Switching Characteristics Consider the parallel connection of identical MOSFETs shown in Fig. 12.6 with their gates tied together. From the equivalent digital models, also shown, we can determine the intrinsic time constant of this chain of N MOSFETs by tPLH
Rp
= Ii' (N·
COUlp) = RpCoulp
(12.9)
which for CN20 from Ex. 11.5 is 230 ps. With an external load capacitance, the low to high delay-time becomes tPLH
Rp
= Ii(N.
C OUIP + C/oad)
This again assumes that the MOSFET's gates are tied together. MOSFETs in parallel, a similar analysis yields
tPHL=~(N'Coutn+C/oad)
(12.10) For n-channel
(12.11)
The load capacitance, Cloud' consists of all capacitances on the output node except the output capacitances of the MOSFETs in parallel. Consider the series connection of identical n-channel MOSFETs shown in Fig. 12.7. We can estimate the intrinsic switching time of series-connected MOSFETs by
Chapter 12 Static Logic Gates
237
(12.12) The first term in this equation represents the intrinsic switching time of the series connection of MOSFETs, while the second term represents Ret delay caused by R, charging Cinn' For the case when N = 1, this simply reduces to RnCo"tn' With an external load capacitance, the high to low delay-time becomes tPHL
=N· R n·
(C~tn + Cload ) +0.35· R nCnn(N-l)2
(12.13)
For p-channel MOSFETs in series, a similar analysis yields tPLH
p =N· Rp' (Czt + Cload) +0.35· RpCinp(N-l)2
(12.14)
VDD
••• MN
M3 In
•••
-----+-Out
~Cload VDD
~ )
2
3
tCoutP
- - - t > - - - - - Out N
JCload Figure 12.6 Parallel connection of MOSFETs and equivalent digital model.
I This effect is similar to the delay through an RC transmission line. The N - 1 term is due to the fact that the last MOSFET's source in the string is connected to ground and not to a load.
238
Part II CMOS Digital Circuits
Output
~
Cload
MN
e e
Rue
In -+------l
C OUIn M3
In --41~---,
C OUIn M2
T-
C~ ~
TCoutn
Ml
Figure 12.7 Series connection of MOSFETs and equivalent digital model. These equations are approximations for the propagation delays giving results usually to within a factor of two of the measurements.
12.3.1 NAND Gate Consider the n-input NAND gate of Fig. 12.8 driving a capacitive load low-to-high propagation time, using Eq. (12.10), is tPLH
R p ( N· =N
C outp
c.; + Cload ) +N
Cloud'
The
(12.15)
where here Cloud represents the capacitance external to the gate, whereas in Eq. (12.10) Cloud represented the capacitance external to the parallel p-channel MOSFETs. If the
Chapter 12 Static Logic Gates
239
I'~
~ Cloud
Figure 12.8 An n-input NAND gate drivinga load capacitance.
load capacitance is much greater than the output capacitance of the gate, the low to high propagation time can be estimated by tPLH::=
R
p Ii' Cloud
(12.16)
The high to low propagation time, using Eq. (12.13), is given by tPHL =N· R{ C;;ln +N· C OUIP + CIOadJ +0.35· RnCinn(N -1)2
(12.17)
or if C10ad is much larger than the output capacitance of the gate tPHL::= N·
s;
(12.18)
Cloud
Example 12.3 Estimate the intrinsic propagation delays, tpH L + tPLH , of a three-input NAND gate made using minimum-size transistors. Estimate and simulate the delay when the gate is driving a load capacitance of 100 fF. Assume that inputs are tied together.
For the three-input NAND gate, the three p-channel MOSFETs in parallel are used to pull the output high. Since they are minimum-size Rp
= 24 ill and C OUIP =4.8 fF
this gives a low-to-high propagation time, using Eq. (12.15), with Cload 24k[ 3·4.8 fF+4.8fFJ tPLH ="'3 3-
=0, of
= 128 ps
The intrinsic high-to-low propagation time of the three input NAND gate with minimum-size n-channel MOSFETs (Rn = 8 kQ and Coutn = 4.8 fF) using Eq. (12.17), with C10ad = 0, 4.8fF ] +0.35·8k·7.2fF(3-1) 2 ::=500ps tPHL=3·8k· [ -3-+3.4.8fF With a load of 100 fF, the propagation delays become, tp LH = 928 ps and tpH L = 2.9 ns. The SPICE simulation results are shown in Fig. 12.9 followed by the SPICE3 netlist. Helping with convergence, the .OPTIONS statement was used, the initially off n-channel MOSFETs were specified, and the input transition times were specified at 0.1 ns instead of the unrealistic conditions of 1 ps. •
240
Part II CMOS Digital Circuits
60
Output 50
Innut
(
40
\
/
3.0
I
\
tPHL ~
I
20
.:
\
I
10
-.
MtPLH
.........
III
I'--
00
-1.0
00
5.0
10.0 llme
150
20.0
nS
Figure 12.9 Output of the minimum-size NAND gate driving a 100 fF capacitor.
••• Top Level Netlist for Example 12.3··· C1 M1 M2 M3 M4 M5 M6 V1 V2
50100f 5 1 20 CMOSNB L=2u W=3u AD=36p AS=36p PD=24u PS=24u OFF 2 1 4 0 CMOSNB L=2u W=3u AD=36p AS=36p PD=24u PS=24u OFF 4 1 0 0 CMOSNB L=2u W=3u AD=36p AS=36p PD=24u PS=24u OFF 5 1 Vdd Vdd CMOSPB L=2u W=3u AD=36p AS=36p PD=24u PS=24u 5 1 Vdd Vdd CMOSPB L=2u W=3u AD=36p AS=36p PD=24u PS=24u 5 1 Vdd Vdd CMOSPB L=2u W=3u AD=36p AS=36p PD=24u PS=24u Vdd 0 DC 5 10 DC 0 PULSE(O 5 sn .1n .1n 10n )
••••• Spice models and macro models ••••• .MODEL CMOSNB NMOS LEVEL=4 +VFB=-9.73820E-01, LVFB=3.67458E-01,WVFB=-4.72340E-02 See Appendix A for a complete listing. .MODEL CMOSPB PMOS LEVEL=4 + vtb=-2.65334E-01, Ivtb=6.50066E-02, wvtb=1.48093E-01 See Appendix A for a complete listing. .OPTION ABSTOL=1u RELTOL=O.01 VNTOL=1mv ITL4=100 .probe .tran 100p 20n 0 uic .plot tran all .print tran all .end
Chapter 12 Static Logic Gates
241
The delay equations derived in this section are useful in understanding the limitations on the number of MOSFETs used in a NAND gate for high-speed design. However a more useful, though not as precise, method of determining delays can be found by considering the fact that whenever the output changes from VDD to ground the discharge path is through N resistors of value R n • This is true if all or only one of the inputs to the NAND gate changes, causing the output to change. Under these circumstances, Eq. (12.18) predicts the high-to-low delay-time, or for series connection of N n-channel MOSFETs, (12.19) The case when the output of the NAND gate changes from a low to a high is somewhat different then the high-to-low case. Referring to Fig. 12.6, we see that if one of the MOSFETs turns on, it can pull the output to VDD independent of the number of MOSFETs in parallel. Under these circumstances, Eq. (12.16) can be used with N = 1 to predict the low-to-high delay-time, or for a parallel connection of N p-channel MOSFETs, (12.20) We will try to use Eqs. (12.19) and (12.20) as much as possible because of their simplicity. The further simplified digital models of the n- and p-channel MOSFETs are shown in Fig. 12.10. (Input capacitance is not shown.)
Ri
Jm=,
Drn
n-channel
Rp
;,
p-channel
I Drain
Source
Figure 12.10 Further simplification of digital models not showing input capacitance.
Example 12.4 Estimate, using Eqs. (12.19) and (12.20), the propagation delays for the three-input minimum-size NAND gate, with only one input switching driving a 100 tF load capacitance. Compare your results to SPICE. The propagation delay-times are given by tPHL
= 3 . 8k . 100tF= 2.4 ns
and t PLH = 24k ·100 tF= 2.4 ns
The SPICE simulation results gave tPLH'" tPHL '" 2.3 ns with one input switching. If we had used Eqs. 12.19 and 12.20 in Ex. 12.3 where all inputs where changing at the same time, the calculated tpH L would have given an
242
Part II CMOS Digital Circuits
underestimate (but not by much), while the calculated t pLH would have overestimated the delay. Also note that since the effective resistance of the p-channel is three times greater than that of the n-channel, the series connection of three NMOS devices gives approximately the same resistance as the single PMOS. The result is equal switching times and the reason the NAND gate is generally preferred over the NOR gate in CMOS circuit design. •
12.3.2 Number of Inputs As the number of inputs, N, to a static NAND (or NOR) gate increases, the scheme shown in Fig. 12.2 (Fig. 12.4) becomes difficult to realize. Consider a NOR gate with 100 inputs. This gate requires 100 p-channel MOSFETs in series and a total of 200 MOSFETs (2N MOSFETs). The delay associated with the series p-channel MOSFETs charging of a load capacitance is too long for most practical situations. Now consider the schematic of an N input NOR gate shown in Fig. 12.11, which uses N + 1 MOSFETs. If any input to the NOR gate is high, the output is pulled low through the corresponding n-channel MOSFET to a voltage, when designed properly, of a few hundred millivolts. If all inputs are low, then all n-channel MOSFETs are off and the p-channel MOSFET pulls the output high (to VDD). A simple analysis of the output low voltage, VOL' with one input at VDD yields
~;(VDD-VTHP)2=~{(VDD-VTHN)VOL- V~L]
(12.21)
Assuming that the maximum VOL allowed (the more inputs at VDD the lower VOL) is 500 mV and that the n-channels have W = 3 11m and L = 2 11m results in a W of 4 11m and an L of 3 11m for the p-channel. In practice, the length of the p-channel can be increased beyond this size to lower VOL further. The static power dissipated by this gate when the output is high, neglecting leakage currents, is zero. When the output is low, a static power is dissipated due to both n- and p-channels conducting. The current that flows under this condition with the above sizes is 150 1lA. Decreasing the WfL of the p-channellowers power draw at the price of increased tpLH' VDD
NOR Out
Il---1
L...----'-_----4----t--
••• N-1~
Figure 12.11 NOR configuration used for a large number of inputs.
243
Chapter 12 Static Logic Gates
12.4 Complex CMOS Logic Gates Implementation of complex logic functions in CMOS uses the basic building blocks shown in Fig. 12.12. We have already used the circuits to implement NAND and NOR gates. In general, any And-Or-Invert (AOI) logic function can be implemented using these techniques. A major benefit of AOI logic is that for a relatively complex logic function the delay can be significantly lower than a logic gate implementation. Consider the following example.
Z=A-B·C
A---1
A-1 -1 C-1
NAND
VDD
NOR
B B---1
C---1 (a)
Z=A+B+C (b)
Z=A+B+C
VDD
NOR
A-1
A-1
C-1
B-1
NAND
Z=A-B·C
(c)
(d)
Figure 12.12 Logic implementation in CMOS.
Example 12.5 Using AOI logic, implement the following logic functions:
Z=A+BC
and
Z=A+I1c+CD
244
Part II CMOS Digital Circuits
The implementation of the first function is shown in Fig. 12.13a. Notice that the p-channel configuration is the dual of the n-channel circuit. The function we obtain is the complement of the desired function, and therefore an inverter is used to obtain Z. Using an inverter is, in general, undesirable if both true and complements of the input variables are available. Applying Boolean algebra to the logic function, we obtain
Z = A + BC ~ Z= A + BC = A . (ii + C) ~ Z = A . (B + C) The AOI implementation of the result is shown in Fig. 12.13b. Logically, the circuits of Figs. 12.13a and b are equivalent. However, the circuit of Fig. 12.13b is simpler and thus more desirable. Note that to reduce the output capacitance
VDD
C~ x.}----=Z=A+BC
(a)
VDD
L......."ip-------Z = A- (B + C)
=A+BC
(b)
Figure 12.13 First logic gate of Ex. 12.5.
245
Chapter 12 Static Logic Gates and thus decrease the switching times, the parallel combination of n-channel MOSFETs is placed at the bottom of the logic block. The second logic function is given by
Z=A+BC+CD=A+C(B+D) ~Z=A+C(B+D)=A· (C+BD) or
Z=A· (C+BD) The logic implementation is given in Fig. 12.14. •
VDD
B-1 +----Z=A· (C+BD) =A+BC+CD
Figure 12.14 Second logic gate of Ex. 12.5.
Example 12.6 Using AOI logic, implement an exclusive OR gate (XOR).
The logic symbol and truth table for an XOR gate are shown in Fig. 12.15. From the truth table, the logic function for the XOR gate is given by
Z =A EI3 B = (A + B) . (A + B) or
(12.22)
Part II CMOS Digital Circuits
246
Z= A EB B = (A + B) . (A + B) =A.B+ A . B and finally (12.23)
Z=A-B+A-B=AEBB
The CMOS AOI implementation of an XOR gate is shown in Fig. 12.16. • A B A EBB o0 0 oI I I 0 I I I 0 Figure 12.15 Exclusive OR gate.
VDD
A-4 Z=A- B+A- B =A EBB
..-----+---
Figure 12.16 CMOS AOI XOR gate.
Example 12.7 Design a CMOS full adder using CMOS AOI logic.
The logic symbol and truth table for a full adder circuit are shown in Fig. 12.17. The logic functions for the sum and carry outputs can be written as Sn=AnEBBnEBCn C n+! =A n ·Bn+Cn(An+Bn)
I
Chapter 12 Static Logic Gates
An
247
Bn Carry-out
Carry-in
Cn
Full adder
Cn+l
Sn Sum-out
An 0 0 0 0 1 1 1 1
Bn 0 0 1 1 0 0 1 1
Cn 0 1 0 1 0 1 0 1
Sn Cn+1 0 0 1 0 1 0 0 1 1 0 0 1 0 1 1 1
Figure 12.17 Full adder.
The logic expression for the sum can be rewritten as a sum of products
s, =AnBnCn +AnBnCn +A nBnC7n +AnBnC n or since
the sum of products can be rewritten as
s, = (An +B n +Cn)Cn+1 +AnBnC n The AOI implementation of the full adder is shown in Fig. 12.18. • 12.4.1 Cascode Voltage Switch Logic
Cascade voltage switch logic (CVSL) or differential cascode voltage switch logic (DVSL) is a differential output logic that uses positive feedback to speed up the switching times (in some cases). Figure 12.19 shows the basic idea. A gate cross-connected load is used instead of using p-channel switches, as in the AOI logic, to pull the output high. Consider the implementation of Z = A + Be. (This logic function was implemented in AOI in Fig. 12.13.) N-channel MOSFETs are used to implement Z and Z as shown in Fig. 12.20. Figure 12.21a shows the implementation of a two-input XORIXNOR gate using CVSL, while Fig. 12.21b shows a CVSL three-input XORIXNOR gate useful in adder design. 12.4.2 Differential Split-Level Logic
Differential split-level logic (DSL logic) is a scheme wherein the load is used to reduce output voltage swing and thus lower gate delays (at the cost of smaller noise margins). The basic idea is shown in Fig. 12.22. The reference voltage V"j is set to VDDI2 + VTHN • This has the effect of limiting the output voltage swing to a maximum of VDD and a minimum of VDDI2. The main drawback of this logic implementation is the increased power dissipation resulting from the continuous power draw through the output leg at a voltage of VDDI2. The output leg at VDD draws no DC power.
248
Part II CMOS Digital Circuits
VDD
~)--------(7n+l
VDD
A~
Figure 12.18 AOI implementation of a full adder.
249
Chapter 12 Static Logic Gates
VDD
Output
Inputs
Output
"--+------
•• •
N
N
logic
logic
block
block
•••
Inputs
Figure 12.19 CVSL block diagram.
VDD
- + BC Z= A
-/
'--~>-------'Z = A + BC
Figure 12.20 CVSL logic gate.
250
Part II CMOS Digital Circuits
VDD
' - - - - + - - - - A ffi B (XNOR)
A ffi B (XOR) -----...----"
(a)
'-------+-
A ffi B ffi C (XOR)
--=----.. . . . .- ./
A_ffi B ffi C (XNOR)
~A
A-1
(b)
Figure 12.21 (a) Two-input and (b) three-input XORIXNOR gates.
Chapter 12 Static Logic Gates
251
VDD
Output
t-,....-
O_utput
11----,,............-----1+-- Vref= VDD/2+ VTHN
Inputs
• ••
N logic block
N logic block
•• •
Inputs
Figure 12.22 DSL block diagram.
VDD A-----,----~~-__l
.----Out
Enable - - - . - J Ml
Enable--c>_ _ Out Logicsymbol
Figure 12.23 Tri-state buffer.
252
Part II CMOS Digital Circuits
12.4.3 Tri-State Outputs A final example of a static logic gate, a tri-state buffer, is shown in Fig. 12.23. When the Enable input is high, the NAND and NOR gates invert and pass A (VDD or ground) to the gates of Ml and M2. Under these circumstances, Ml and M2 behave as an inverter. The combination of Ml and M2 with the inversion NANDINOR gate causes the output to be the same polarity as A. When Enable is low, the gate of Ml is held at ground and the gate of M2 is held at VDD. This turns both Ml and M2 off. Under these circumstances, the output is said to be in the high-impedance or Hi-Z state. This circuit is preferable to the inverter circuits of Fig. 11.29 because only one switch is in series with the output to VDD or ground. An inverting buffer configuration is shown in Fig. 12.24.
VDD
Enable - - - - - - -.......- - - i
. - - - - Out
A-----l
Enable A
----I
Logic symbol
--....,[>0
Out
Figure 12.24 Tri-state inverting buffer.
REFERENCES [1]
M. I. Elmasry, Digital MOS Integrated Circuits II, IEEE Press, 1992. ISBN 0-87942-275-0, IEEE order number: PC0269-1.
[2]
J. P. Uyemura, Circuit Design for Digital CMOS VLSI, Kluwer Academic Publishers, 1992.
[3]
M. Shoji, CMOS Digital Circuit Technology, Prentice-Hall, 1988. 0-13-138850-9.
ISBN
Chapter 12 Static Logic Gates
253
PROBLEMS
Use the CN20 process unless otherwise specified.
12.1
Design, layout, and simulate the operation of a CMOS AND gate with a Vsp of approximately 1.5 V. Use the standard-cell frame discussed in Ch. 4 for the layout.
12.2
Design and simulate the operation of a CMOS AOI half adder circuit using static logic gates.
12.3
Repeat Ex. 12.3 for a three-input NOR gate.
12.4
Repeat Ex. 12.4 for a three-input NOR gate.
12.5
Sketch the schematic of an OR gate with 20 inputs. Comment on your design.
12.6
Sketch the schematic of a static logic gate that implements (A + B . C) . D. Estimate the worst-case delay through the gate when driving a 50 tF load capacitance.
12.7
Design and simulate the operation of a CSVL OR gate made with minimum-size devices.
VDD
1...-_ _. . . . - _ - - , ._ _........
Figure P12.10
Z =?
254
Part II CMOS Digital Circuits
12.8
Design a tri-state buffer that has propagation delays under 20 ns when driving a I pF load. Assume that the maximum input capacitance of the buffer is 100 fF.
12.9
Sketch the schematic of a three-input XOR gate implemented in AOI logic.
12.10 What logic function does the circuit of Fig. P12.10 implement? 12.11 Calculate the switching point voltage of the gate shown in Fig. Pt2.t I. What logic function does this circuit implement?
VDD
r - -........- - -......- - - -
A---1
Out
3/2
Figure P12.1l
12.12 Estimate the minimum and maximum output voltages for the gate of Fig. Pt2.tI. 12.13 The circuit shown in Fig. Pt2.t3 is an edge-triggered one-shot that generates an output pulse, with width t d ' whenever the input makes a transition. Using inverters for delay elements, design and simulate the operation of a one-shot whose output pulse width is tOns. Comment on the resulting output if the width of the input pulse is less than t d •
Figure P12.13
Chapter
13 The TG and Flip-Flops
The transmission gate (TG) is used in digital CMOS circuit design to pass or not pass a signal. The schematic and logic symbol of the transmission gate (TG) are shown in Fig. 13.1. The gate is made up of the parallel connection of a p- and an n-channel MOSFET. Referring to the figure when S (for select) is high we observe that the transmission gate passes the signal on the input to the output. The resistance between the input and the output can be estimated as RnliRp • We begin this chapter with a description of the nand p-channel pass transistor.
13.1 The Pass Transistor Consider the single n-channel MOSFET shown in Fig. 13.2a. Assume that the voltage across the capacitor (the output of the pass transistor) is initially 5 V. When the gate (the select line) of the MOSFET is taken to VDD, the MOSFET turns on. In this situation, we can assume that the drain of the MOSFET is connected to the load capacitance and that the source (the input of the pass transistor) is connected to ground, keeping in mind that the drain and source are interchangeable. The delay-time of the capacitor discharging is simply (13.1)
Out
In
Schematic
S Figure 13.1 The transmission gate.
Logic symbol
256
Part II CMOS Digital Circuits
out/
Initally @ VDD
In
1
0
S
s
~
l...L
~DD ~
VDD
~
(a)
Figure 13.2 An n-ehannel pass transistor showing transmission of 0 V and VDD.
Now consider Fig. 13.2b where the capacitor is initially at 0 V. In this case, the drain is connected to VDD and the source is connected to the load capacitance. Since the substrate, assumed at VSS = ground, is not at the same potential as the source, we have body effect present causing the threshold voltage to increase. When the gate of this MOSFET is raised to VDD, the load capacitor charges to VDD - VTHN where VTHN , from Appendix A, is in the neighborhood of 1.5 V. Therefore, the low-to-high delay-time can be estimated by tPLH
= RnCload for a high voltage of VDD - VTHN
(13.2)
In this derivation, we have neglected the parasitic capacitances of the MOSFET. The following example illustrates the switching behavior of the n-channel pass transistor. Example 13.1 Estimate and simulate the delay through nummum-size n-channel pass transistors using the test setups of Fig. 13.2 driving a 100 fF load capacitance. We know that for the minimum size (W = 3 urn and L = 2 urn) the n-channel effective resistance is 8 ill. Therefore, the propagation delays t pHL = t pLH = 800 ps, remembering that the maximum high voltage is VDD - VTHN or approximately 3.5 V. The simulation results are shown in Fig. 13.3. • A similar analysis of the p-channel MOSFET used as a pass transistor gives (13.3) and tPLH
= R p • Cload for a low voltage of VTHP
(13.4)
The p-channel pass transistor can pass a logic high without signal loss, while passing a low results in a minimum low voltage of VTHP (with body effect). The n-channel transistor can pass a logic low without signal loss, while passing a high results in a maximum high voltage of VDD - VTHN • One advantage of the p-channel pass transistor is that it can be laid out, in an n-well process, with the well tied to the source, eliminating body effect.
Chapter 13 The TG and Flip-Flops
257
5. c
1\
4. c
\
(a~ /
3. 0
Select line zoe hizh at ns.
-, (b/!\
2. 0
-, 1/
1. 0
0.0
0.0
l.0
2.0
3.0
4.0 time
5.0
-.
6.0
---
7.0
f--
8.0
9.0
10.0
nS
Figure 13.3 Simulation results of an n-channel MOSFET driving a 100 tF load capacitance, (a) with output initially at 5 V passing 0 V, (b) with output initially at 0 V passing 5V.
The intrinsic propagation delays of the n- and p-channel pass transistors (no load capacitance) can be approximated by (13.5)
and (13.6)
The pass transistor turning on must discharge the charge stored on the output capacitance of the MOSFET through its own effective resistance.
13.2 The CMOS TG Since the n-channel passes logic lows well and the p-channel passes logic highs well, putting the two complementary MOSFETs in parallel, as was shown in Fig. 13.1, results in a TG that passes both logic levels well. The CMOS TG requires two control signals, Sand S (see Fig. 13.4). The propagation delay-times ofthe CMOS TG are tPHL
= tPLH = (RnIlRp ) ' C/O(1(J
(13.7)
The capacitance on the S input of the TG is the input capacitance of the n-channel MOSFET, or Cinn (= 1.5Cox), The capacitance on the S input of the TG is the input capacitance of the p-channel MOSFET, or Cjnp ' Making the widths of the MOSFETs used in the TG large reduces the propagation delay-times from the input to the output of the TG when driving a specific load capacitance. However, the delay-times in turning the TG on, the select lines going high, increase because of .the increase in input capacitance. This should be remembered when simulating. Using a voltage source in
258
Part II CMOS Digital Circuits
SPICE for the select lines, which can supply infinite current to charge the input capacitance of the TG, gives the designer a false sense that the delay through the TG is limited by R, and Rp • Often, when simulating logic of any kind, the SPICE-generated control signals are sent through a chain of inverters so that the control signals more closely match what will actually control the logic on die.
EnableTG
In~Out '--
~ c.:
---'S
Figure 13.4 The transmission gate with control signals shown.
Example 13.2 Estimate and simulate the delays through the TG shown in Fig. Ex13.2 when minimum-size MOSFETs are used and the load capacitance is 150 fF.
VDD
7l
O-----.r-L-...:..=...--II-l ~
VDDt
T
150fF
7 Figure Ex13.2
For minimum-size MOSFETs RnliRp = 6 kU so that tpUl = tPHL = 900 ps. The SPICE simulation results are shown in Fig. 13.5. In this example we have applied the propagation delays defined by Eq. (13.7) somewhat differently. We are estimating how long it takes a change on the input of the TG to reach the output, at the 50 percent points, with the TG enabled. •
13.2.1 Layout of the CMOS TG Figure 13.6 shows the layout of the minimum-size CMOS transmission gate. Often, the inverter used to generate the complementary select signal (see Fig. 13.4) is added to the layout of the cell. The inverter allows the use of a single select signal which can be desirable in systems where both true and complement signals are not available. The nand p-channel pass transistors can be laid out in a similar manner to the CMOS TG.
Chapter 13 The TG and Flip-Flops
259
6. 0
/"
Input
1\
~,pm\
~utput
4. 0
2. 0
V-
W
II
r-;
0.0 0.0
2.0
4.0
6 .0
8.0
10.0
12.0
14.0
16.0
nS
time
Figure 13.5 Simulation results of CMOS minimum-size TG driving a 150 fF load.
In
s ~~------tv'SS
Figure 13.6 Layout of the CMOS transmission gate.
260
Part II CMOS Digital Circuits
13.2.2 Series Connection of Transmission Gates Consider the series connection of CMOS transmission gates shown in Fig. 13.7. The equivalent digital model is also depicted in this figure. The output capacitance of the individual MOSFETs is not shown in this figure and will be neglected in the following analysis. The delay through the series connection can be estimated by tPHL
= tPLH = N· (RnIlRp)(Ctoad) +0.35· (RnIlRp)(C;nn + C;np)(N) 2
(13.8)
The first term in this equation is simply the sum of the TG effective resistances, while the second term in the equation describes the RC transmission line effects.
At
Input
A2
AN
A3
~
.i. .i.
T
T
--ll--ll--ll- · · · At
A2
T
~ ~ut
T
AN
A3
T
CtOad
'V
Figure 13.7 Series connection of transmission gates with digital model.
13.3 Applications of the Transmission Gate In this section, we present some of the applications of the TG [1, 2]. Path Selector The circuit shown in Fig. 13.8 is a two-input path selector. Logically, the output of the circuit can be written as
Z=AS+BS
(13.9)
When the selector signal S is high, A is passed to the output while a low on S passes B to the output. This same idea can be used to implement multiplexers/demultiplexers (MUXlDEMUX). Consider the block diagrams of a MUX and DEMUX shown in Fig. 13.9. The number of control lines is related to the number of input lines by
261
Chapter 13 The TG and Flip-Flops
(13.10) where n is the number of inputs (outputs) to the MUX (DEMUX) and m is the number of contro1lines. A 4 to 1 MUXlDEMUX is shown in Fig. 13.10. Note that the MUX is bidirectional; that is, it can be used as a MUX or a DEMUX. The logic equation describing the operation of the MUX is given by Z = A(Sl . 81) + B(Sl . S2) + C(Sl . S2) + D(Sl . S2)
(13.11)
A---i'C
t-----Z
S B---iC
Figure 13.8 Path selector.
Control/selector
lines
tJ tJ
::l
P-
.S l!
'"c
"0
::l
• • •
MUX
Out
In
DEMUX
Figure 13.9 Block diagram of MUXIDEMUX.
• • •
g. ::l
o
~
"0
c
262
Part II CMOS Digital Circuits
Select lines
Sl
Sl
S2
S2
A-t-+C>t-t---t--+--IK:>f--f------+---,
Inputs
B -+-i1-+----1---....
Output
D -+---+-K:>I+-----1!------I--+:
Sl
S2
L---1--t"--Z D-f--__+_-f---4----+----1
c-t---+-_--__+_-----'
B-t-----...-------' A _ _--------'
Figuer 13.10 Circuit implemetations of a 4 to 1 MUXlDEMUX.
Chapter 13 The TG and Flip-Flops
Sl
263
S2
A
B
Z
t - - - = Out
Inputs
c-----' (a)
D
-'
l~
Sl
A
-'
B-----'
z
t----Out Inputs
c-------' D
Simplified circuit (b)
-I
Figure 13.11 MUXIDEMUX using pass transistors.
Figure 13.11a shows a pass transistor implementation of the 4 to 1 MUX. The pass transistor implementation is simpler, using fewer transistors, at the price of a threshold voltage drop from input to output when the input is a high (VDD). A simplified version of the circuit of Fig. 13.lla is shown in Fig. 13.llb. Here the MOSFETs connected to S2 and S2 are combined to reduce the total number of MOSFETs used. The reduction of the total number of MOSFETs used can be extended to an n-input (output) MUX (DEMUX). Again, it should be remembered that a DEMUX can be formed using the circuits of Figs. 13.10 or 13.11 by switching the inputs with the outputs.
264
Part II CMOS Digital Circuits
A -----1p------J
~----A+B
Output
B---iK
Figure 13.12 TG-based OR gate.
Static Gates
The TG can be used to form static logic gates. Consider the OR gate shown in Fig. 13.12. To understand the operation of the gate, consider the case when both A and B are low. Under these circumstances the pass transistor, Ml, and the TG are on. The inputs A and B, both low, are passed to the output. If A is high, Ml is on and A is passed to the output. If B is high and A is low, B is passed to the output through the TG. If both A and B are high, the TG is off and Ml is on passing A, a high, to the output. Figure 13.13 shows an XOR and an XNOR gate made using TGs. Consider the XOR gate with both A and B low. Under these circumstances, the top TG is on and its output is ~onnected to A, a low. If both inputs are high, the bottom TG connects the output to A, again a low. If A is high and B is low, the top TG is on and the output is connected to A, a high. Similarly, if A is low and B is high, the bottom TG is on and connects the output to A, a high. B
A---iK
A---iK AEeB
B - - -....
A---iK
B-----+ A---tK
XOR B Figure 13.13 TG implementation of XORlXNOR gate.
XNOR
Chapter 13 The TG and Flip-Flops
265
13.4 The Flip-Flop Consider the set-reset flip-flop (SR FF) shown in Fig. 13.14 made using NAND gates. The logic symbol and truth table are also shown in this figure. Consider the case when S is high and R is low. Forcing R low causes Q to go high. Since S is high and Q is high, the Q output is low. Now consider the case when both Sand R are low. Under these circumstances, the FF outputs are both high. This FF can easily be designed and laid out with the techniques of Ch. 12.
Truth table
s
D------..-Q
D------e-- Q
S R QQ aa 1 1 1 a 1 a a1a 1 1 1 Q Q
R
Figure 13.14 Set-reset flip-flop made using NAND gates.
An alternative implementation of the SR flip-flop is shown in Fig. 13.15 using NOR gates. Consider the case when S is high and R is low. For the NOR gate, a high input forces the output of the gate low. Therefore, the Qoutput is low whenever the S input is high. Similarly, whenever the R input is high, the Q output must be low. The case of both inputs being high causes both Q and Q to go low, or in other words the outputs of the FF are no longer complements. Figure 13.16 shows the logic symbol of the SR flip-flop. Note that the true and complement locations on the logic symbol are switched with the location of Figs. 13.14 and 13.15.
Truth table
s---\
IJ---_Q
S R Q Q
OOQQ
a
1 0
1 1 I
a 1 a a
1
a ~---+-Q
R
Figure 13.15 Set-reset flip-flop made using NOR gates.
266
Part II CMOS Digital Circuits
Figure 13.16 Logic symbol of the SR flip-flop.
13.4.1 Clocked Flip-Flops Clocked flip-flops can be divided into three categories. The first category consists of those in which the clock signal pulse width must be short compared to the propagation delay through the FF. In other words, the clock input should go high and then low before the output of the flip-flop changes state. The second category of clocked FFs consists of those in which the output changes while the clock signal is high. This type of FF is sometimes called a level-sensitive FF. The final category of FF is the edge-triggered type. The output of the FF changes state on the rising or falling edge of the FF. Short Clock Pulse Widths The clocked JK FF is shown in Fig. 13.17. The JK FF is constructed using the NAND SR FF and two NAND gates. However, unlike the SR FF, both J and K can be high at the same time without the outputs becoming equal. The operation of the JK FF depends on the previous state of the FF. With the clock signal held low, the inputs and outputs of the SR FF do not change. Holding the clock signal high causes the output of the FF to oscillate between a logic 0 and 1. With application of a short clock pulse and J =K = 0, the outputs of the FF do not change. If K = 1 and J = 0, the output, Q, is 0 after application of the clock pulse, while if, J = 1 and K =0 the output is set high. If both J and K are high, the output becomes the complement of the previous state. A toggle or T flip-flop can be constructed using the JK FF by setting J =K = 1, or simply by replacing the three-input NAND gates of Fig. 13.17 with two-input NAND gates. The clock input of the JK FF is used as the T input of the T FF. Application of a short pulse to T input of the T FF causes the output, Q, to toggle states. If the output is a high and the T input goes high, the output changes to a low. Pulsing the T input high again causes the output to change back to a high. The T FF can be used to divide a clock signal in half, keeping in mind the pulse width limit (when using the FF of Fig. 13.17). Level-Sensitive Flip-Flops Flip-flops that are clocked with a signal that enables the output to change with the input have no specific pulse width requirements for the clock. To illustrate a level-sensitive
Chapter 13 The TG and Flip-Flops
267
Narrow pulse
\ JL..
K
S
Q
Q
R
Q
Q
elk
J
Truthtable
J K
o0 o1 1 0 1 1
Qn+ Qn 0 1
c,
Figure 13.17 Clocked JK FF. Clock pulse width should be short compared to FF delay.
D-__.--I [}----1 S
Q 1----
CLK--+------. [}----!
R
Logic symbol
j:LK
:1-
Figure 13.18 Level-sensitive D flip-flop.
Q
1----
268
Part II CMOS Digital Circuits
FF, consider the data or D FF shown in Fig. 13.18 with associated logic symbol. When the clock signal is high, the D input can pass directly to the SR FF. If D is a 1 while CLK is high, the output, Q, is a I, while if D is low the output is a low. If D changes at any time while the CLK input is high, the output will follow. When the CLK signal goes low, the current logic level of D is latched into the SR FF. Note that this FF is not an edge-sensitive FF because the output changes at other times than the edge transition time. Edge-Triggered Flip-Flops The JK master-slave FF, shown in Fig. 13.19, is an example of an edge-triggered FF. When the CLK signal goes high, the master JK FF is enabled. Since the slave FF cannot change states when CLK is high, the clock pulse width does not have to be less than the propagation delay of the FF. When CLK goes low, the master data are transferred to the slave. If both J and K are low, the output of the master remains unchanged, and therefore so does the output of the slave. If J = 1 and K= 0 when the CLK pulse goes low, the master output, Q, goes high. When the CLK goes low, the high output of the master is transferred to the slave. The master-slave JK FF behaves just like the JK FF of the previous section except for the fact that the data are not available until CLK goes low and there is no restriction on the pulse width of the clock (i.e., the FF is falling edge triggered). Adding reset or set capability to the FF can be accomplished by adding logic gates between the NAND and the SR FF of Fig. 13.19. The logic gates simply ensure that the SR FF are placed into a certain state upon application of a reset or set signal. MasterJK K
S
Q~-----"'"
R
QI------,
eLK J
SlaveJK Q - -__+ . - - - - - - l Q
S 1----0
Q - - - . e - - - - - - lLQ
R...J~--C1
Figure 13.19 Edge-triggered JK master-slave flip-flop.
Chapter 13 The TG and Flip-Flops
269
An implementation of the positive edge-triggered D FF is shown in Fig. 13.20a. The SR FF is made using NAND gates. When the CLK input is low, the outputs of the NAND gates are both high, keeping the SR FF in the "no change mode." When CLK goes high, the logic value on the D input of the FF is transferred to the S input and the complement is transferred to the R input of the SR FF. The CLK input of the NAND gates goes low three inverter delays after CLK goes high. This forces both Rand S high, putting the flip-flop in the no change mode. The only time that CLK and CLK can be high, the condition required to transfer D to the input of the FF, is the time between CLK going high and CLK going low. This time is determined by the propagation delay of the inverters. In practice a single inverter, in place of the three, will not provide a sufficient delay to allow the inputs of the SR FF to fully charge to D and J5. Also, there are maximum rise- and falltime requirements on the clock. Another implementation of the positive edge-triggered D FF using transmission gates is shown in Fig. 13.20b. When the CLK input is low, the logic value at D is setting at node A and J5 is on node B. Transmission gates T2 and T3 are off. The datum on node C is available on the output of the FF and is the result of the previous leading edge transition of the CLK input pulse. When CLK goes high, T1 and T4 turn off, while T2 and T3 turn on and the datum on node is C is transferred, with the appropriate inversion to the outputs. A D FF with set and clear inputs is shown in Fig. I3.20c. Flip-Flop Timing
The data must be set up or present on the D input of the FF (see Fig. 13.20c) a certain time before we apply the clock signal. This time is defined as the setup time of the FF. To understand the origin of this time, consider the time it takes the signal at D to propagate through T1 and the NAND gate to point B. Before the clock pulse can be applied, the logic level D must be settled on point B. Consider the waveforms of Fig. 13.21. The time between D going high (or low) and the clock rising edge is termed the setup time of the FF and is labeled, t s' The wanted D input must be applied ts before the clock pulse is applied. Now the question becomes "How long does the wanted D input have to remain on the input of the FF after the clock pulse is applied?" This time called the hold time, th , is illustrated in Fig. 13.22. Shown in this figure, th is a positive number. However, inspection of Fig. 13.20 shows that if the D input is removed slightly before the clock pulse is applied, the point B will remain unchanged because of the propagation delay from D to B. Analysis of this FF would yield a negative hold time. In other words, for the point B to charge to D, a time labeled t s is needed. Once point B is charged, the D input can be changed as long as the clock signal occurs within tho One final important comment regarding the clock input of a FF is in order. If the clock input risetime is slow, the FF will not function properly. There will not be an abrupt transition between the sets of transmission gates turning on and off. The result will be logic levels at indeterminate states. What is usually done to eliminate this
270
Part II CMOS Digital Circuits
D ----.--I
s }-----l
S
Q 1----
D------l
R
Q 1----
r
CLK ---t---D
CLK
Figure 13.23 Clocked D flip-flop using the basic latch and TGs.
The input DC current comes from the fact that the output of an inverter is connected to each TG. In order to change the voltage at Q and Q, with the inputs, the effective digital resistances of the inverters should be large compared to the sum of the TG resistance and the driver resistance. (The driver resistance is the effective resistance of whatever gate is driving the TG.) In other words, the R; and Rp of the inverter should be large. The length of the devices used in the inverters can be longer than the minimum length to reduce the input current.
REFERENCES [1]
J. P. Uyemura, Circuit Design for Digital CMOS VLSI, Publishers, 1992.
Kluwer Academic
[2]
M. I. Elmasry, Digital MOS Integrated Circuits II, IEEE Press, 1992. ISBN 0-87942-275-0, IEEE order number: PC0269-1.
[3]
M. Shoji, CMOS Digital Circuit Technology, Prentice-Hall, 1988. 0-13-138850-9.
ISBN
PROBLEMS Unless otherwise stated, use the CN20 process. 13.1
Verify the simulation results shown in Fig. 13.3. If we increase the width of the n-channel pass transistor, what happens to the delay-times? The gate of the pass transistor is driven from some other logic on the chip. What happens to the capacitance seen by this logic when we increase the width of the pass transistor?
13.2
Design and simulate the operation of a half adder circuit using TGs.
13.3
Estimate and simulate the delay through 10 TGs (assume minimum-size) connected to a 100 fF load capacitance.
13.4
Sketch the schematic of an 8 to 1 DEMUX using n-channel pass transistors. Estimate the delay through the DEMUX when the output is connected to a 50 fF load capacitance.
273
Chapter 13 The TG and Flip-Flops 13.5
Verify, using SPICE, that the circuit of Fig. 13.13 operates as an XOR gate.
13.6
Simulate the operation of an SR FF made with NAND gates using minimum-size MOSFETs. Show all four logic transitions possible for the FF.
13.7
Simulate the operation of the clocked D FF of Fig. 13.23b using minimum-size MOSFETs. Comment on any glitches you encounter. Show the FF clocking in a logic 1 and O. What are the setup and hold times for your design?
13.8
Design and simulate the operation of the FF shown in Fig. PI3.8.
xr--Q
D---,
XJ---Q Figure P13.S
13.9
The FF shown in Fig. P13.8 has several practical problems, including not presenting a purely capacitive load at the D-input and large layout size. The FF of Fig. P13.9 is a different implementation of an inverter-based latch which does present a purely capacitive load to the D-input and a (possibly) smaller layout size. Simulate the operation of this FF using the device sizes shown.
3/3
D---l
X)------
-6f hll c h: .
JO.l
P -BASE ACTI VE TO N~ElL
~.O
:}3
JO.2
COLLECHI'! N-+ ACTIVE TO P-ilASE ACTIVE
$.0
¢14
~
JO.3 e
P -BASE ACTI VE (MJlLAP OF N~/P" ACT llIE
,10.4
P~
ACTIVE TO
N~
ACT! lIE
$.0
¢15
;].0
i}6
-iI ~ JO.Z -ilJO.H- - - -- ----- - - - - - - - - - - - - - - - - - - - - - - --
:"'"
';:r".. i..I~·' .§nilllil" N'" actiyc
,8+ active
ohmic contact
J.a tho P-B...
Pollector N+ 8cl.1v8
.,10.
P-BA5E
Figure 16.4 Design rules for the p-base layer.
Figure 16.5 Symbol for the vertical BIT showing parasitic resistances.
Example 16.1 Estimate the falltime of the circuit shown in Fig. 16.6. Compare your hand calculations to SPICE. Note that the input 5 V pulse is applied directly to the base of the BIT.
From the SPICE model located in spice.inf R, high-to-low time can be estimated by tPHL
= 420
Q and R;
= 1.2 kQ.
The
= 420·5 pF= 2.1 ns
The base current that must be supplied from the input voltage source is 5/1.2 k or approximately 4 rnA. The simulation results are shown in Fig. 16.7. • It should be pointed out that the BIT of this example was driven with an ideal voltage source, something that is not available in practice. However, the collector
318
Part II CMOS Digital Circuits
,--------, Initially charge to VDD
~ 5pF
Figure 16.6 Circuit used in Ex. 16.1. 5,OV~-----r--_---_-----4o------II--------'
,, Voltage across 5 pF
Input f E - - - - - - - -...." ....
OV-!&-----e-+-----r-----..----------r-------.4
Os
a
l.Ons V(2) • V(l)
2,Ons
3.0ns
5.0ns
Time
Figure 16.7 Simulation results for Ex. 16.1.
current supplied for an input voltage (the voltage applied to the base of the transistor) of VDD is significantly larger than the drain current supplied using the MOSFET switch. Modeling larger BITs using the 2 x 1 model can be accomplished using the A (area) parameter in SPICE. For example, if you layout a 2 x 2 BIT, that is, two emitter contacts with two emitter "fingers," we simply set A = 2 and use the 2 x 1 model. For a 10 x 3 BIT we set A = 15. Here A can be thought of as the ratio of the large BIT to the size of the 2 x 1 BIT model. An example of the layout of a 5 x 2 BIT is shown in Fig. 16.8. When using the larger BIT models Eqs., (16.1) and (16.2) are modified by A. The resistances now become Rc R npn=A"
and
(16.3)
Chapter 16 BiCMOS Logic Gates
319
Rinnpn =
Rb A
(16.4)
Here R, and R b are the series resistances specified in the SPICE model used. If A is not specified, SPICE assumes A = 1.
E
-- - ----- - - - ------ - - - ---- - - - - - -----o- --
B
o
Figure 16.8 Layout of a 5 x 2 junction-isolated NPN transistor.
BfT Capacitances
The BIT capacitances result from the depletion capacitances of the implant regions and from the forward-biased base-emitter junction (the storage capacitance). The base-collector depletion capacitance is estimated either from the SPICE model or from use of the n+ to p-substrate depletion capacitance specified in the n-channel BSIM model. The base-emitter depletion capacitance is estimated using the depletion capacitance from the p+ to n-well specified in the p-channel BSIM model. More important than these depletion capacitances is a storage capacitance associated with the base-emitter forward-biased diode. If the minority carrier lifetime of the base-emitter junction is called 'tF, then, from Ch. 2, the storage capacitance is given by Cbestor
IE
= 'tF' VT
(16.5)
Here IE is the DC emitter current and VT is the thermal voltage (kT/q). As the emitter current increases, the storage capacitance increases. The SPICE model supplied in the
320
Part II CMOS Digital Circuits
file "spice.inf" does not specify the 'tF parameter, so simulations will not show charge storage effects (such as the transistor not turning off until the stored charge is removed from the base-emitter junction).
16.3 The BiCMOS Inverter A BiCMOS inverter is shown in Fig. 16.9. One important aspect of the basic BiCMOS inverter is that the output cannot go to VDD or ground, as was the case in the CMOS inverter. This has the effect of lowering the noise margins of the logic. The maximum output voltage is approximately VDD - 0.7 V, while the minimum logic output voltage is approximately 0.7 V. The 0.7 V drop for the high and low side comes from the base-emitter voltage drop of Q2 and Ql , respectively. Caution should be exercised when using the output of BiCMOS gates with CMOS logic. The low-output voltage of 0.7 V is very close to the threshold voltage of the n-channel transistor. CMOS gates with switching point voltages close to the threshold voltage are susceptible to noise. To understand the operation of the basic BiCMOS inverter, consider the case when the input is grounded. MOSFETs M4 and Ml are on, while M2 and M3 are off. The BJT Ql is off, its base being held at ground potential by MI. The base of Q2 is held at VDD by M4. The output voltage is VDD - 0.7 V or a logic high. When the input of the BiCMOS inverter is held high, MOSFETs M3 and M2 are on, while M4 and Ml are off. The base of Q2 is held at ground potential, so it is off. Since M2 is on, the output is connected to the base of Q1. This causes Q1 to turn on and pull the output voltage down to 0.7 V.
VDD
Inpu_t
---.
-+--f I
Figure 16.9 Basic BieMOS inverter showing parasitic collector and base resistances.
321
Chapter 16 BiCMOS Logic Gates
Switching Characteristics
The delay associated with the BiCMOS inverter discharging a capacitance, Cloud ' consists of two parts: the delay in Ql turning on and the delay once Ql is on discharging Cloud. The delay associated with discharging Cloud is given by tPHL
(16.6)
= R npn . C/oad
The delay associated with turning Ql on is comparable to the minority carrier lifetime which is in general well under 1 ns. The MOSFET M2 is used to turn Ql on. A general design rule can be applied to the sizing of M2. We require the effective resistance of M2, R n2 to be equal to the base resistance of Ql, R h • This is a very simple method of sizing the transistors, which gives very good results.
'tp
The low-to-high delay-time can be estimated in much the same way as the high-to-low delay. The delay in charging Cloud is given by tPLH
= R npn . C/oad =
tPHL
(16.7)
The fact that the propagation delay-times are equal is a side benefit of the BiCMOS inverter. The MOSFET M4 drives the base of Q2. Sizing M4's effective resistance equal to the base resistance of Q2 is a general design rule for the sizing of the MOSFETs. MOSFETs Ml and M3's effective resistance can be made larger than M2 and M4's effective resistance because these MOSFETs simply hold the bases of Ql and Q2 at ground during the off period. In general, to attain a switching point voltage close to VDDI2, M2 and M4 are sized the same as M3. Example 16.2 Estimate and simulate the delay of the BiCMOS inverter (Fig. 16.10) driving a 10 pF load. Calculate the input capacitance of the inverter. The propagation delays are simply given by tPHL
= tPLH = RnpnC/oad = 420·10 pF= 4.2 ns
The SPICE simulation results are shown in Fig. 16.11. Notice how the output of the BiCMOS inverter stays at approximately 0.7 V from the power and ground rails. The input capacitance is the sum of the input capacitances of the three MOSFETs connected to the input, or Cin
3 aF (2·10+2·10+ 16·2) = 86.4 fF = -2.800-2 Ilm
This input capacitance can easily be driven from logic on chip without excessive delay. The delay of this inverter driving a 10 pF load can be reduced by using larger BITs with corresponding larger MOSFET drivers.
322
Part II CMOS Digital Circuits
VDD
Vertical NPNs drawn without parasitics
Inpu_t
..-
+----l
l
Figure 16.10 Circuit used in Ex. 16.2.
5.0V.-----.-------ll>----_---
---r-------..,
Input
OV'-I&-----''----,,....-----..----..,l----..-----l
Os D
5ns V(6) • V(J)
lOns
15ns
20ns
25ns
Time
Figure 16.11 Simulation results of a BiCMOS inverter driving a 10 pF capacitive load.
An important characteristic of the BIT has been neglected in the analysis and in the SPICE models. The carrier lifetime, 'tF (resulting in a storage capacitance), was not modeled, and the actual delays can be longer than predicted by SPICE .•
323
Chapter 16 BiCMOS Logic Gates Full-Swing BiCMOS Inverters
Figures 16.12 and 16.13 show two implementations of a full-swing BiCMOS inverter [4, 5]. Consider the first inverter (Fig. 16.12) with its input grounded. MOSFETs M2 and M4 are off while MOSFET M5 is on. MOSFETs Ml and M3 can be thought of as resistors. Since M5 is on, the base of Q2 is pulled to VDD. The transistor Q2 is on and pulls the output to VDD - 0.7. MOSFET M3, which behaves like a resistor, then pulls the output up to VDD. When the input to the inverter is high, M2 and M4 are on and M5 is off. This pulls the base of Q2 to ground, turning it off. At the same time M2 turns on, with the output high, causing Ql to turn on. Ql pulls the output down to 0.7 V. From there Ml, which behaves like a resistor, pulls the output down to ground. Note that if Ml or M3 does not have a large effective resistance (long L), the circuit will not operate correctly. The inverter shown in Fig. 16.13 performs better (lower dynamic power dissipation) than the inverter of (a) at the cost of more complicated circuit design. The inverter operation is similar to that given in (a) with the exception that switches Ml and M3 are controlled by the output of the inverter. This topology improves performance by making the MOSFET sizes less critical.
VDD
Q2 M3 Out Input
M2 QI MI
Figure 16.12 A wide-swing BiCMOS inverter.
16.4 Other BiCMOS Logic Gates The NAND and NOR gates using BiCMOS technology [6, 7] are easily constructed from the standard CMOS static logic gate. As seen in Fig. 16.14, blocks PI and P2 are identical to the all CMOS NAND gate presented in Ch. 12 (Fig. 12.1). Node C
Part II CMOS Digital Circuits
324
VDD
Q2
Inpu_t
-..._ _---., +---+---~--- Out
Figure 16.13 A full-swing BiCMOS inverter with improved power dissipation.
represents the output of the all CMOS NAND. Therefore, the output of the BiCMOS gate is identical to the logic state of node C. The transistor pair composed of M5 and M6 (P3) ensures that if the output is low (both inputs are a logic 1), the sinking transistor, Ql, is biased correctly to discharge the load capacitor. The transistor, M7, connects the base of Q1 to VSS (or ground) only if the output is high. Examine Table 16.1 for the states of the important nodes and transistors of the NAND gate. VDD
....-'---11------.----, Out
:&
B
-----'---'I-I-~-...-~ I
Figure 16.14 A BiCMOS NAND gate.
lOpF
Chapter 16 BiCMOS Logic Gates NodeC
325
ill
MQ
M7
QL
ill
0 0
OFF
OFF
ON
OFF
ON
0
ON
OFF
ON
OFF
ON
OFF
ON
ON
OFF
ON
ON
ON
OFF
ON
OFF
AB
0 0
Out
0
Table 16.1 States of key nodes and componentsin Fig. 16.14.
The basic BiCMOS NOR gate is seen in Fig. 16.15. Notice again that the blocks PI and P2 represent the all CMOS NOR presented in Ch. 12 (Fig. 12.1) and that the logic state of node C will again be identical to the output of the BiCMOS gate. Transistor block P3' composed of M5 and M6, allows Q1 to be biased correctly in order to discharge the output capacitance, while M7 again ensures that the base of Q1 is connected to ground should output be a logic 1. Table 16.2 shows that states of the critical nodes and transistors in Fig. 16.15. NodeC
Out
M5
MQ
M7
QL
ill
OFF
OFF
ON
OFF
ON
0
ON
OFF
OFF
ON
OFF
0
0
0
OFF
ON
OFF
ON
OFF
0
1 1
0
ON
ON
OFF
ON
OFF
0
AB
0 0 0
Table 16.2 States of key nodes and components in Fig. 16.15.
The switching analysis for these gates is very similar to the BiCMOS inverter since the delay-time is dominated by the time necessary to charge and discharge the load capacitance.
VDD
A--t--~---"---'----t--_::....=..-+---,
B
L---tH4-l
Figure 16.15 A BieMOS NOR gate.
326
Part II CMOS Digital Circuits
16.5 CMOS and ECl Conversions Using BiCMOS One major advantage of using BiCMOS is the ability to mix technologies such as CMOS, ECL, and BiCMOS logic. One advantage of using emitter-coupled logic (ECL) circuits is that the bipolar transistors can double their output current for every 25 mV of change in the base-emitter voltage. This is simply because the collector current, Ie' through a BJT, can be described as (16.8) where I, is the saturation current, VT is the thermal voltage, and V BE is the instantaneous base-emitter voltage. The expression for the transconductance, which relates the amount of drive current to the input voltage, is gm(BJT) = Ie AN
(16.9)
VT
and is also obviously exponential. As a result, the BJTs can sink or source large amounts of load currents with very small input voltage swings. Now examine the relationship between gate-to-source voltage and drain current through an MOS device: (16.10)
The transconductance for the MOSFET is gm(MOS) = jID2P = P(Vos - VTHN) AN
which is linear with respect to the input voltage. The amount of input voltage necessary to switch an output from a low to a high or a high to a low is much greater than the BIT case. Typically, the CMOS input signal must overcome the threshold voltage by around 1 V before the output begins to change state. The different switching speeds can be seen in Fig. 16.16 [5]. Volts VDD
Switching time
Volts
Switching time
k:---+---+-----:;:>-
-1-
Input
(a)
- Reference
(b)
Figure 16.16 Switching times for (a) CMOS logic and (b) ECL.
Chapter 16 BiCMOS Logic Gates
327
Notice the differing reference levels shown between the two types of technologies. While CMOS logic typically swings between VDD and VSS, ECL logic has a much smaller signal swing defining the logic levels. Interface circuits are needed that convert ECL to CMOS logic levels and vice versa. An ECL to CMOS converter circuit can be seen in Fig. 16.17 [3, 8]. Here, the ECL input signal is level shifted by 2 VEE drops to a current-mode logic (CML) circuit that drives the CMOS output shifter stage. The stepped-down ECL input causes the CML circuit to become imbalanced so that one collector is considered high, while the other collector is considered low. The critical issues in minimizing the delay time are the output swing of the CML stage and the sizes chosen for the CMOS shifter. However, the two specifications are inversely proportional, for increasing the output swing of the CML stage decreases the delay through the CMOS shifter but increases the delay through the CML stage. VDD
ECL
input CMOS
output
Figure 16.17 ECL to CMOS conversion circuit.
An improved ECL to CMOS translator can be seen in Fig. 16.18 [9]. This circuit has significantly reduced total delay and power dissipation and improved driving capability for capacitive loads over the circuit shown in Fig. 16.17. However, a process allowing both NPN and PNP BIT devices is required. The input can be either complementary or single-ended (with one input tied to a reference voltage). Notice that the two complementary differential input stages drive the output BIT devices. One reason why this circuit has such improved delay-time is that the base of the output transistors, Q5 and Q6, are driven directly from their respective differential input stages. For example, if the ECL inputs were such that ECLl was high and ECL2 was low, then all the current through Ml would flow through Q4 and into the base of Q6, thus discharging the output node very rapidly. Similarly, if ECLl was low and ECL2 was high, then all the quiescent current through M2 would flow through Q2, which results in a large amount of current through Q5, thus charging the output node quickly.
328
Part II CMOS Digital Circuits
VDD
QI
y
X ---'-If---i ECL!
CMOS out
Figure 16.18 An improved ECL to CMOS conversion circuit.
Once the output devices, Q5 and Q6, are turned on, they become saturated until the feedback circuit, composed of inverters II and 12, turns off the respective device. For example, if the output node is high, then the output of II is low, which in tum pulls the gate of M3 down, thus shorting the base of Q5 to VDD. Similarly, if the output node is low, then the output of II is high, thus causing M4 to tum on and short the base of Q6 to VSS. Therefore, the output devices are saturated for only a short period of
y
y
ECL output
ECL output
Figure 16.19 CMOS to ECL conversion circuit.
Chapter 16 BiCMOS Logic Gates
329
time, while the feedback circuit preserves the logic value at the output. The resistor string is used to keep the base-emitter voltages of the output transistors on the edge of being turned on, thus improving speed even further. Another conversion circuit is seen in Fig. 16.19 [to]. This circuit translates CMOS signals to ECL logic levels and requires a complemented CMOS input. The input signal causes an imbalance in the source coupled pair, since the current, 10' is constant. The output swing of the source coupled pair appearing at nodes A and Bean be adjusted by wisely choosing the resistance values and input MOS device sizes. REFERENCES [1]
A. R. Alvarez, "BiCMOS-Has the Promise Been Fulfilled?," IEDM 1991, pp.13.1.1-13.1.4,1991.
[2]
M. Kubo, I. Masuda, K. Miyata, and K. Ogiue, "Perspective on BiCMOS VLSI's," IEEE Journal of Solid State Circuits, vol. 23, no. 1, pp. 5-11, February 1988.
[3]
M. I. Elmasry, "Introduction to BiCMOS Integrated Circuits: A Tutorial," IEEE BiCMOS Integrated Circuit Design, IEEE Press, 1994. ISBN 0-7803-0430-6.
[4]
"Exponential Unveils World's Fastest PC Microprocessor at 533 MHz," Press Release by Exponential Technology, Inc., October 21, 1996.
[5]
"Exponential's BiCMOS Technology: Bipolar-Based BiCMOS instead of CMOS-Based BiCMOS," http://www.exp.com/products/x704/bicmos.htrnl. Exponential Technology, Inc., November 1996.
[6]
M. I. Elmasry, BiCMOS Integrated Circuit Design, IEEE Press, 1992. ISBN 0-7803-0430-6, IEEE order number: PC0346-7.
[7]
J. P. Uyemura, Circuit Design for Digital CMOS VLSI, Publishers, 1992.
[8]
S. H. K. Embabi, A. Bellaouar, and M. I. Elmasry, "Analysis and Optimization of BiCMOS Digital Circuit Structures," IEEE Journal of Solid State Circuits, vol. 26, no. 4, pp. 676-679, April 1991.
[9]
M. Rau and H. J. Pfleiderer, "An ECL to CMOS Level Converter with Complementary Bipolar Output Stage," IEEE Journal of Solid-State Circuits, vol. 30, no. 7, pp. 781-787, July 1995.
[10]
K. Gopalan, Introduction to Digital Microelectronic Circuits, Irwin, 1996. ISBN 0-256-12089-7.
PROBLEMS 16.1
Layout and DRC a junction-isolated 5 x 1 NPN BIT.
16.2
Repeat Ex. 16.1 using a 5 x 1 BIT.
Kluwer Academic
330
Part II CMOS Digital Circuits
16.3
Verify, using SPICE, the operation ofthe inverter given in Ex. 16.2.
16.4
Design a full-swing BiCMOS output buffer that has an input capacitance of 100 tF or less and will drive 10 pF with a t PHL + t PLH less than 15 ns.
16.5
Design and simulate the operation of an ECL to CMOS converter based on the circuit topology shown in Fig. PI6.5. Assume that the ECL input varies from 4.2 V (a logic high) down to 3.4 V (a logic low).
+sv EeL input
MOS output
Figure P16.5
Chapter
17 Memory Circuits
In this chapter we look into the design of semiconductor memory circuits [1, 2], in particular static random access memory (SRAM) and dynamic random access memory (DRAM). These types of memories are termed random access because any bit of data can be accessed at any time. A block diagram of a RAM is shown in Fig. 17.1.
Row/word Latches, decoder, buffer
'MemOrycell intersection of row and column lines
I I 1.. ·1
.m&J\ !L.y
Exte inpu
I--
Control •• circuitry ~
Column\bit\digit lines Sense amplifiers, decoder Output buffers
I--
Figure 17.1 Block diagram of random access memory.
332
Part II CMOS Digital Circuits
External to the memory array are the row and column logic. The row lines are sometimes called word lines, while the column lines are sometimes called bit or digit lines. Referring to the row lines, the row address is latched, decoded, and then buffered. A particular row line will, when selected, go high. This selects the entire row of the array. Since the row line may be long and loaded periodically with the capacitive memory cells, a buffer is needed to drive the line. The address is latched with signals from the control logic. After a particular row line is selected, the column address is used to decode which of the bits from the row are the addressed information. At this point, data can be read into or out of the array through the column decoder. The majority of this chapter will concentrate on the circuits used to implement a RAM.
17.1 RAM Memory Cells The memory array is at the center of the RAM design. Examples of DRAM and SRAM memory cells are shown in Fig. 17.2. The DRAM memory cell is made up of a pass transistor and a storage capacitor, while the CMOS SRAM memory cell is a cross-coupled connection of inverters. The cross-coupled inverters form a positive feedback circuit, forcing the outputs in opposite directions. The basic operation of the DRAM memory cell was discussed in Ch. 14. For the SRAM cell shown in Fig. 17.2, consider the case when the row line (word line) is low. Both pass transistors are off, and the datum in the cell is latched, as long as power is applied to the cell. When the row line goes high, the pass transistors turn on. If the pass transistors, width/length ratio is approximately four times that of the SRAM cell transistors' width/length ratio, the data on the bit lines (column lines) are written to the cell. If the widths are comparable in size, the effective resistance of the pass transistor is too large to allow overwriting the cell.
VDD
Row line (word line)
Word line DRAM
Column line (bit line)
SRAM
Bit
Figure 17.2 Schematic diagrams of RAM memory cells.
Bit
Chapter 17 Memory Circuits
333
17.1.1 The DRAM Cell Consider the implementation of the DRAM cell shown in Fig. 17.3a. The capacitor is implemented using a MOSFET operating in the inversion region. Schematically, this would be represented by the capacitor in Fig. 17.2 connected to VDD instead of ground. The size of the DRAM storage capacitor Cd' is simply the sum of the oxide capacitance of the MOSFET used as a capacitor and the depletion capacitance of the n+ implant to substrate. The row/word line and VDD connections to the cell are made using polyl. This greatly simplifies layout. In order to minimize the layout area of the DRAM array, the scheme shown in Fig. 17.3b is used. In this configuration, the bit line is shared between two cells. When writing to cella, the wordO line goes high and the datum on the bit line is written to the capacitor Mal. This configuration is termed a folded bit line configuration for reasons that are not obvious at this point. Modern memory processes do not use a MOSFET as the storage capacitor but rather fabricate the storage capacitor using several layers of poly. For the sake of understanding memory circuit design, we will use the CN20 process, for the moment, to describe the implementation of the DRAM. Consider the layout of the DRAM cell shown in Fig. 17.4. Since the word and VDD lines are implemented in poly, the connection to the MOSFETs occurs when the poly runs over the active n+ area. The bit line is implemented in metall. The DRAM cells are placed adjacent to each other to form the array. A complete DRAM memory array is shown in Fig. 17.5. Notice how adjacent bit lines do not have a word line in common. Bit Pass transistor
Word
.L--O---
Capacitor
VDD
Bit (a)
Bit (b)
Figure 17.3 Implementation ofthe DRAM cell.
334
Part II CMOS Digital Circuits
VDD
WordO WordI
VDD
Figure 17.4 Basic layout of a folded bit line DRAM cell.
Figure 17.5 Array of DRAM cells.
Chapter 17 Memory Circuits
335
Example 17.1 This example illustrates the charge sharing principle. Consider the equivalent circuit of the basic DRAM cell shown in Fig. ExI7.!. The unwanted bit line capacitance, C bit, is the sum of the metal1 to substrate capacitance of the bit line and the capacitance of the n+ implant depletion capacitance from each DRAM cell connected to the bit line. Assuming the initial voltage on the DRAM storage capacitance, Cd' is V d and the initial voltage on the bit line is V bit, calculate the change in voltage on C bit when the word line is taken high. Bit Word
~Cbit
Figure Ext7.t
The initial charge on c, is Vd,Cd, and the initial charge on C bit is V bit ,Cbit' When the word line goes high, the access MOSFET turns on, or in other words the switch closes, connecting the DRAM storage cell capacitance, Cd' directly to the bit line (and its associated capacitance). The voltage across each capacitor must be the same after the switch is closed, This. voltage will be called VjinaI and is given by
or (17.1) The change in the bit line voltage is simply (17.2) Normally, the bit line is precharged to approximately 2.5 V before a read operation, and with typical values of Cd and Cbit of 75 fF and 500 fF, respectively, the change in bit line voltage with Vd of 4 V is only 200 mY. The amplifier used to sense this small voltage change is called a sense amplifier or simply sense amp. • Example 17.2 Estimate the delay through a word line that is 2 mID long connected to MOSFET gates measuring 2 urn by 6 11m spaced every 20 urn,
336
Part II CMOS Digital Circuits
The sheet resistance of polyl, from Appendix A, is 21 Qlsquare, while the capacitance of polyl to substrate is 58 aF/!Jmz. The capacitance of each MOSFET gate connected to the word line is C;nn =
2'3 . 6·2·800 aF= 14.4 iF
If we break the word line into 20 urn increments that are 2 urn wide, the
following circuit shown in Fig. Ex17.2 is the result.
210
210
1st section
•••
2nd section
210
~
T 2.3f-&
T 14.4f -&
1DOth section
Figure Ex17.2
The delay through the entire line can be estimated by td
= 0.35rcN2 = 0.35·210· 16.7f ·(100)2 = 12.5 ns
As the density of the layout is increased, that is, the number of transistors connected to the word line increases over a given distance, this delay can become even larger. What is normally done in DRAM to circumvent this problem is to break the DRAM into smaller arrays multiplexing the data together. The smaller DRAM array supporting circuitry is easier to design for high-speed operation. • Often the substrate is "pumped" to a negative voltage, typically -2 V, in DRAM. This reduces the depletion capacitance between the n+ implant and the substrate, having the effect of lowering the bit line capacitance. Two other benefits of the negative substrate bias are that it increases latch-up immunity and allows the inputs on the chips to go negative without forward biasing the n-e/substrate diode. A negative substrate potential has the unwanted effect of increasing the threshold voltage of the access transistor and increasing the junction leakage current. The threshold voltage drop of the access transistor when writing a high level to the storage cell (see Ch. 14) can be compensated for by using a voltage of VDD + 2 for the word line drivers. This puts the gate potential of the access transistors above VDD + VTHN • Modern DRAM processes do not use a MOSFET in the inversion region for the storage capacitor but rather use a stacked or trenched capacitor (more on this later in the chapter). In the design of these storage capacitors, it is desirable to keep the oxide thickness as thin as possible in order to have the largest capacitance/area. The main limitation, from a circuit designer's point of view, on the oxide thickness is the breakdown voltage. The maximum electric field that should be applied to SiOz for reliable operation is 7 MV/cm, or 0.7 VIlO A (see Ch. 6). For a 100 A oxide thickness,
337
Chapter 17 Memory Circuits
the maximum potential across the oxide for reliable operation is then limited to 7 V. If the substrate is pumped to -3 V and VDD is 5 V, poor reliability is probable when the process tox is 100 A. To limit the voltage across the storage capacitor, one plate is held at VDDI2 while the other plate, that is, the plate connected to the access transistor, can swing from ground to VDD.
17.1.2 The SRAM Cell The basic SRAM cell shown in Fig. 17.2 is not popular because of its large layout size. The n-well needed for the p-channel transistors is the main cause. The SRAM cell shown in Fig. 17.6 is very popular because of its small layout size. The resistors are made using n+ and p+ poly silicon and are therefore not available in the process described in Appendix A (CN20). The layout of the polysilicon resistor is shown in Fig. 17.7. The resistor can be thought of as a leaky bipolar transistor. Typical resistance
VDD
Word line Bit
Bit
Figure 17.6 SRAM memory cell with poly resistors.
•
n+poly
Contacts to metall p+poly
Figure 17.7 Layout of the polysilicon resistor.
Part II CMOS Digital Circuits
338
values are about 10 Mil (or more). The CMOS SRAM cell dissipates essentially zero static power, while the power dissipated by the resistor/n-channel SRAM cell is VD[j2/l0 Mil, which is 2.5 IlW for each cell when VDD is 5 V. An array of 1 million SRAM cells (128 k by 8) dissipates a power of 2.5 W when the resistor/n-channel SRAM cell is used.
17.2 The Sense Amplifier Consider the portion of a DRAM memory array shown in Fig. 17.8. Two bit lines are shown in this figure. From Ex. 17.1 we found that the bit line may change very little when we are reading a cell. We use the sense amplifier to sense changes on the bit lines and determine whether a 1 or 0 was written to the cell. Before we illustrate the operation of a sense amplifier, consider what happens to the bit lines when the word line, labeled wardA, in Fig. 17.8 is high. The charge, or absence of charge, on the storage capacitor is used to change the voltage of the bit line. The bit line potential remains unchanged and is used as a reference in the sense amplifier. The near proximity of the lines gives excellent noise rejection from coupled signals. Note that the line labeled bit in this figure corresponds to the bit line of the accessed transistor. If the wordB row line were high, the labeling of the bit lines in Fig. 17.8 would be switched. Also note that only one row line can go high, or in other words be selected, at a given time, while all even or odd bit lines intersecting a selected row line can change.
Figure 17.8 Part of a DRAM array showing two bit lines.
Chapter 17 Memory Circuits
339
Figure 17.9 Schematic of circuit used to precharge bit lines to VDD/2.
The first step in reading out a DRAM cell is to precharge all bit lines to, typically, VDDI2. The circuit used to precharge the lines is shown in Fig. 17.9. The control signal EQ (equilibrate) is used to turn the two MOSFETs on prior to a read operation, setting both bit lines to VDDI2. The MOSFET between the two bit lines is used to ensure that the potential of the lines is equal. This turns out to be very important since the sense amp must discriminate less than 100 mV voltage changes on the bit line. The n- and p-sense amplifier schematics are shown in Fig. 17.10. The p-sense amplifier in this figure is placed on the top of the array, while the n-sense amplifier is located at the bottom of the array. During precharge of the bit lines, the signals NLAT (n-sense amplifier latch) and ACT (active pull up) are charged to VDDI2. The signals NSA and PSA are low and high, respectively. After the digit (bit) lines have been charged to VDDI2, the row address decoder selects a word line. If the memory cell at the intersection of the word line and the bit line contains a low and the storage capacitor is discharged, the bit line voltage will fall from the precharged voltage. The bit line voltage remains unchanged. Evaluation of the bit line begins when NSA is driven high, causing NLAT to go low. If the bit line fell from VDD/2 (in other words, the accessed bit was a low), the n-sense amplifier would pull the bit line low. If the bit line increased in potential from VDDI2, the n-sense amplifier would pull the bit to a low. The n-sense amp can only pull a digit or column line low. The final stage in evaluating the digit lines is to fire the p-sense amp. This is done by pulling PSA low, causing ACT to go high. If the potential of the bit line, after the word line went high, is above VDDI2, the p-sense amplifier will pull the bit line high. If the bit line is below VDDI2, the p-sense amplifier will pull bit up to VDD. The p-sense amp can only pull a bit line high. The sensitivity of the p-sense amplifier is far less critical than that of the n-sense amplifier. After the n-sense amplifier is fired, one of the bit lines is at ground potential while the other is at VDDI2. When the p-sense amplifier is fired, it sees this large potential difference. The n-sense amplifier must be capable of discriminating < 100 mV voltage differences, while the p-sense must discriminate VDD/2 voltage differences. Another important attribute of the sense amplifier is its ability to restore or refresh the datum in the memory cell. If the word line stays high during the evaluate phase, the forcing of the bit line high or low by the sense amplifier also forces a high or
340
Part II CMOS Digital Circuits
Bit
Bit
PSA
p-sense amplifier
Memory cells
VDD/2 EQ
n-sense amplifier .----.... ......--. ~
Bit
Bit
NSA
Figure 17.10 Schematic of sense amplifiers.
low potential on the storage capacitor. The change in potential on the bit line has no effect on any of the memory cells since the word line does not access any data on this line. DRAM must be refreshed periodically to keep from losing data. Refreshing is accomplished by sequentially reading each row in the memory array since there is a sense amplifier for each pair of bit lines. The sense amplifier can be shared between different memory arrays on the chip. When the sense amp is shared, isolation transistors are used to select which array the sense amplifier will be used with. Isolation transistors also help to isolate the sense amp from the large bit line capacitance, keeping the sense amp from oscillating.
341
Chapter 17 Memory Circuits
Memory array
s-
:? ~
"0s
;I> 0...,0-
.n mputs
0
~
CIl
!'?
;I>
D:
"8-r> "...,
r> i" =r
e
i"
0 ~ 0-
c
n 2 row lines
::::l ~
'"
m 2 column lines
Sense amplifiers
Data out Control circuitry
Data selector/decoder
mlines Column address latch (not used in SRAM) Column address strobe (CAS)
Figure 17.11 Detailed block diagram of a RAM.
17.3 Row/Column Decoders Consider the more detailed block diagram of a RAM shown in Fig. 17.11. If there are 2" row lines and 2m column lines (where a column line is bit and bit), the total memory size is 2"+m bits of data. In order to minimize the length of the row and column lines, it is desirable to make n = m, or in other words, a square array. Selecting a bit of data begins by latching and decoding the row and column addresses. The row line that goes high as a result of the row decode is buffered to drive the word line across the array (see Ex. 17.2). The column decoder output is fed to a pass transistor. The pass transistor acts like a data selector, allowing the selected bit to be accessed for a read or write operation. A common row decoder configuration, sometimes called a tree decoder, used in RAM is shown in Fig. 17.12a. The three-bit address AG, AI, and A2 is used to enable the pass transistors used in the decoder. One of the eight outputs is pulled high, that is,
342
Part II CMOS Digital Circuits
.----+-- 2
3
4
0
g 0
c, ~ 0
c::
VDD
5
oS
~
6
7
.----+---8 To word line buffers
AD
AD
Al
Al
A2
Decoder inputs (a)
To bit lines
AD
2
Al A2
• •
Tree decoder
•
same as above
8
(b)
Data out or in
Figure 17.12 Row (a) and column (b) decoders.
I
Chapter 17 Memory Circuits
343
VDD - VTHN , depending on the three-bit address. Placing another pass transistor in series with VDD in this figure allows the decoder to be disabled.
The column address decoder, Fig. 17.l2b is similar to the row address decoder with the addition of a pass transistor. The pass transistor is connected to the bit lines. The tree decoder portion of the column decoder is sometimes called a pre-decode. An enable can be used here as well. Delay through the decoder is an important factor in large DRAM arrays. Consider a ten-bit row address. A total of ten tiers of pass transistors are used with each transistor connected to two others. Since the high output is well below VDD due to the body effect, a buffer circuit must regenerate the logic levels. Figure 17.13 shows how the output of the decoder is pulled low when it is not selected. A long L MOSFET is used to pull the output of the decoder low when that particular output is not selected. The result is that all decoder outputs are zero except for the output that is selected by the input address. Two inverters are then used to drive the word line capacitance. The switching point voltage of the first inverter is set to compensate for the threshold voltage drop through the pass transistors.
Word line
Pulls unselected output low
Figure 17.13 Output buffer used in row decoder.
17.4 Timing Requirements for DRAMs The timing signals used in a normal DRAM read are shown in Fig. 17.14. With the help of Fig. 17.11 these signals will be discussed. The first signal shown, RAS, is the row address strobe and is active low. The row and column addresses are normally multiplexed together on the die so that one set of address inputs can be used. This reduces the number of pins in the packaged IC. Assuming the row address is set up on the address lines of the DRAM, the falling edge of RAS strobes the row address into the row address latches. After the row address has been latched, the address inputs of the chip are changed to the column address. At the falling edge of the column address strobe, CAS, the column address is strobed into the column address latches. A finite time later, the data are available on the output pins of the DRAM. All internal signals, for example, EQ, NLAT, ACT, are derived from RAS and CAS. Not shown in this
344
Part II CMOS Digital Circuits
RAS
\'---
---J/
CAS
\'-Row address
----'1
Column address
------------------«
Data out
>-
Figure 17.14 Normal read cycle for a DRAM (WE = high).
timing diagram is the WE signal or write enable signal. This signal is used to put the DRAM in the read or write mode. Normal write operations timing waveforms are shown in Fig. 17.15. Refreshing the DRAM is accomplished by sequentially addressing the word lines. When a word line is accessed, all bits on this line are refreshed by the sense amplifier as was discussed in Sec. 17.2. Figure 17.16 shows the timing signals for a RAS only refresh. The row addresses are sequentially applied to the DRAM during the refresh period.
RAS
\'--------_---1/ CAS
\'-Row address
--------«
---11
Column address
Data in
)>------------
Figure 17.15 Normal write cycle for a DRAM (WE = low).
345
Chapter 17 Memory Circuits
RAS
\'-------------'/ CAS
Row address
X'-
_
Data
Figure 17.16 RAS only refresh cycle.
17.5 Modern DRAM Circuits The CN20 process is a general-purpose CMOS process. Memory manufactures, however, use CMOS processes specifically designed for memory circuit production. A memory process is specifically engineered to enhance yield. This section will discuss some aspects of modem CMOS memory design. 17.5.1 DRAM Memory Cell Layout Modern DRAM memory cell layout, often called an mbit (memory bit), is much more involved than the memory cell layout given in Fig. 17.4. Figure 17.17 shows the layout of a modern DRAM memory cell. Again, a shared digit (bit) line contact is used to connect the access transistors to the digit line. The word lines are, again, made using polyl. An important aspect of the modern DRAM cell is the compactness of the mbit. A different set of design rules are used for the mbit layout. The layout of the capacitor in a process specifically designed for memory is different as well. Figure 17.18 contains a process cross section for the buried capacitor mbit depicted in Fig. 17.17 (a vertical cross section). This type of mbit, employing a buried capacitor structure, places the digit line physically above the storage capacitor [4]. The digit line is constructed from either metal or polycide, while the digit line contact is formed using metal or polysilicon plug technology. The mbit capacitor is formed with polysilicon (poly2) as the bottom plate, an oxide-nitride-oxide (aNa) dielectric, and a sheet of polysilicon (poly3) which forms the common node shared by all mbit capacitors. The capacitor shape can be simple, such as a rectangle, or complex, such as concentric cylinders or stacked discs. Exotic capacitor structures are the topic of many DRAM process papers [5, 6, 7]. The aNa dielectric undergoes optimization to achieve maximum capacitance with minimum leakage. It must also tolerate the maximum DRAM operating voltage without breakdown. A cross-sectional view of an mbit using a trench capacitor is shown in Fig. 17.19 [6,7].
346
Part II CMOS Digital Circuits
-.
Poly2 storage node
Poly3 cellplate
Word lines (polyl)
Active area
Digit line (metal!)
Figure 17.17 Mbit pair layout.
Digit line Interlayer dielectric
p-substrate
Poly2 storage node
Figure 17.18 Cross-sectional view of a buried capacitor cell, Fig. 17.17, cross section from top to bottom.
347
Chapter 17 Memory Circuits
Interlayer dielectric
Substrate or well
Poly storage node
! Heavily doped !/sUbstrate region
I
!
-,,----,'
Figure 17.19 Cross-sectional view of a trench capacitor cell.
Mbits organized in an array are shown in Fig. 17.20. A term used often in a periodic layout is pitch. The distance between like points in the array is the pitch length. In a memory array, the pitch is usually specified between adjacent bit lines as shown in Fig. 17.20. This figure is also useful to show how the size of a memory cell is specified. If we draw an imaginary box around an individual memory cell (see Fig. 17.20), the area of the box is the cell size. The feature size, F, is normally half the width of the bit line or word line pitch. The area of the memory cell of Figs. 17.17 and 17.20 is 8F 2 •
17.5.2 Folded/Open Architectures The memory cells discussed thus far are used in the folded bit line architecture shown in Fig. 17.21. The p- and n-sense amplifiers are placed on the top and bottom of the memory array. First-generation DRAM, 64 Kbits and smaller, used the open bit line architecture shown in Fig. 17.22. The sense amplifier's inputs were from two separate memory arrays. The main benefit of the open bit line configuration is the resulting 6F 2 memory cell (Fig. 17.23). The main drawback (and the reason it is no longer used) is the susceptibility to noise. Noise from the substrate and adjacent word and bit lines does not couple equally into the sense amplifier's inputs. The folded architecture essentially takes the arrays used in the open bit line configuration and "folds" them into a single array. The results are an array where the adjacent bit lines are not used at the same time for reading or writing and a larger array size for a given memory size. (This characteristic is, of course, unwanted.) The noise immunity is increased because of the close proximity. Substrate and coupled noise will ideally feed into each bit line equally.
348
Part II CMOS Digital Circuits
F = pitch/2
Figure 17.20 How memory cell size is specified (not to scale).
Row drivers Row drivers
••• Sense amplifiers
Figure 17.21 Architecture for folded bit lines.
349
Chapter 17 Memory Circuits
,-
----,Row drivers
Row drivers
Sense amplifiers
Figure 17.22 Architecture used in an open bit line architecture. Bit lines
Word lines
Figure 17.23 Layout of mbit used in an open bit line configuration.
350
Part II CMOS Digital Circuits
17.6 Other Memory Cells --_....;;.
Figure 18.16 Using MOSFETs as capacitors.
Vout
Chapter 18 Special-Purpose Digital Circuits
367
VDD
osc
Figure 18.17 Increased efficiency voltage pump.
To understand the operation of the circuit, let's assume that the voltage at point A is low and the voltage at point C is VDD - VTHN • When the output of INV 1 goes high, point A is VDD and the voltage at point C swings up to 2· VDD - VTHN • This causes M4, M5, and M6 to turn on and pull points D and E to VDD. Now when point B goes high (point A goes back to zero), points D and E swing up to 2·VDD and the output goes to 2·VDD - VTHN • Note that MOSFETs M2 and M3 are not needed; unless the pump drives a DC load, they never turn on. Also, separating points D and E is unnecessary unless the pump supplies a DC current. 18.3.2 Generating Higher Voltages The voltage pumps of the last section are limited to voltages less than 2· VDD and greater than 2·VSS. Figure 18.18 [3] shows a scheme for generating arbitrarily high voltages (limited by the breakdown voltage of the capacitors or the oxide breakdown of the MOSFETs). Again, the MOSFETs are used as diodes in this configuration.
In the following description of circuit operation, we will assume steady-state operation with no DC load present. When CLK is low, point A is pulled, by MI, to VDD - VTHN • When CLK goes high, point A swings up to 2·VDD - V11i.L-Diode M2 turns on, and point B charges to 2· VDD - 2· VTHN • When CLK goes low, CLK goes high and point B swings up to 3·VDD - 2·VTHN • When CLK goes low, point B swings back down to 2· VDD - 2· VTHN • This operation proceeds through the circuit to the last stage of the multiplier. The output of the multiplier swings from (N+ 1)·VDD - No VTHN down to (N + 1)- VDD - (N + 1). VTHN • eN can be made larger than the other capacitors to reduce this ripple.
368
Part II CMOS Digital Circuits
VDD
MI M2 A
B
M3
C
M4
•••
Vout
Figure 18.18 N-stage voltage multiplier.
In practice, several problems exist with this circuit. The threshold voltage, due to the body effect, increases for each MOSFET proceeding from Ml to MN. Stray capacitance at each node to ground lowers the efficiency of the multiplier. When the circuit supplies a current charge sharing exists between the capacitors in the circuit. In short, the output impedance of the voltage generator can be very high. This limits the circuit to supplying very small currents. Also, in a practical circuit, the output voltage should have some voltage-limiting circuit on the output of the multiplier to limit the output voltage and protect the circuit from breakdown. A simple limiting circuit is the series connection of several long L n-channel MOSFETs from the output of the circuit to ground.
18.3.3 Example A common application of a voltage generator in digital circuits is generating a negative substrate bias [4]; that is, instead of tying the substrate to ground, the substrate is held at some negative voltage. Typically, this negative voltage is between -1 and -2 V. "Pumping" the substrate negative is common in virtually all DRAMs. A negative substrate bias has several benefits. It (1) stabilizes n-channel threshold voltages, (2) increases latch-up immunity after power up, (3) prevents forward biasing n+ to p-substrate pn junction, (4) allows chip inputs to go negative without forward biasing a pn junction, (5) prevents substrate from going locally above ground, (6) reduces depletion capacitances associated with the n+ to p-substrate junction and (7) reduces subthreshold leakage current. A simple substrate pump is shown in Fig. 18.19. In this circuit we can use n-channel MOSFETs to generate a negative potential, unlike Fig. 18.15, since the negative voltage is connected to the substrate. In this situation, the drain/source implants of the n-channel MOSFETs cannot become forward biased. Note the absence of the load capacitance. It turns out that the capacitance of the substrate to everything
Chapter 18 Special-Purpose Digital Circuits
osc
369
[>.---Figure 18.19 Simple substrate pump.
else in the circuit presents a very large capacitance to the pump. In other words, the substrate itself is a very large capacitor. An example oscillator circuit used to drive the substrate pump is shown in Fig. 18.20. This is a standard ring oscillator with a NAND gate used to enable/disable the oscillator. Capacitors are added at a few points in the middle of the oscillator to increase the delay and lower the frequency of the oscillator in order to allow the pump's capacitors to fully charge. The final component in a substrate pump is the regulator, a circuit that senses the voltage on the substrate and enables or disables the substrate pump. Using a comparator with hysteresis, a precision voltage reference, and a level shifting circuit, the enable signal can be generated with the circuit of Fig. 18.21. The hysteresis of the comparator determines the amount of ripple on the substrate voltage. Forcing a constant current through the two MOSFETs, Ml and M2, compels their source-gate voltages to remain constant (note how the body effect is eliminated by using p-channel MOSFETs), causing the MOSFETs to behave as if they were batteries. The battery action of Ml and M2 shifts the substrate voltage up so that it lies in the common mode range of the comparator. The number of MOSFETs (in this case two) and the magnitude of the current I determine the substrate voltage.
Figure 18.20 Ring oscillator with enable.
370
Part II CMOS Digital Circuits
VDD
Vrej >---- Enable MI \
C omparator WIt ith hvsteri ystensis
M2
VBB = Vrej- 2VSG Substrate, VBB
Figure 18.21 Regulator circuit used in substrate pump.
A simpler and less accurate implementation of the regulator is shown in Fig. 18.22. The comparator and voltage reference are implemented with an inverter and M1-M3. MOSFET M3 causes the inverter to have hysteresis, that is, behave like a Schmitt trigger. MOSFETs M2 and M3 form an inverter with a switching point voltage of approximately VTHN • The current source of Fig. 18.22 is implemented with the long L MOSFET M4. The level shifting is performed with the n-channel MOSFETs M5 and M6. When point A gets above a potential of VTHN , the Enable output goes high, causing the substrate pump to turn on and drive the substrate voltage negative. When point A
M3 VDD
LongL
M4
LongL
XJf--....A
M5
M6
Substrate, VBB
Figure 18.22 Simpler substrate regulator.
Enable
Chapter 18 Special-Purpose Digital Circuits
371
gets pulled, via the substrate voltage through M5 and M6, below VTHN , the Enable output goes low and the pump shuts off. The substrate voltage generated with this circuit is approximately -VTHN with body effect, which is approximately -1 V.
REFERENCES [1]
D. A. Hodges and H. G. Jackson, Analysis and Design of Digital Integrated Circuits, McGraw-Hill Publishing Co., 2nd ed., 1988. ISBN 0-07-029158-6.
[2]
R. Gregorian, K. W. Martin, and G. C. Ternes, "Switched-Capacitor Circuit Design," Proceedings of the IEEE, Vol. 71, No.8, August, pp. 941-966, 1983.
[3]
J. F. Dickson, "On-Chip High-Voltage Generation in MNOS (sic) Integrated Circuits Using an Improved Voltage Multiplier Technique," IEEE Journal of Solid State Circuits, Vol. SC-l1, No.3, June 1976.
[4]
P. Zagar, 4 MEG DRAM Tutorial-Course Notes, Micron Semiconductor, Boise, Idaho.
[5]
J. Wu, Y. Chang, and K. Chang, "1.2V CMOS Switched-Capacitor Circuits," ISSCC, 1996.
PROBLEMS 18.1
Design a Schmitt trigger with VSPH = 3 and VSPL = 2.5 V. Perform a SPICE DC sweep on your design, labeling the switching point voltages.
18.2
Estimate tPHL and ln» for the Schmitt trigger of Ex. 18.1, driving a 100 tF load capacitance.
18.3
Design and simulate the operation of a Schmitt trigger-based oscillator with an output frequency of 10 MHz.
18.4
Estimate the total input capacitance on the control voltage input for the VCO shown in Fig. 18.8.
18.5
Determine, using SPICE simulations, VSPH and VSPL for the Schmitt trigger shown in Fig. 18.9.
18.6
Design an astable multivibrator with an output oscillation frequency of 20 MHz. Use minimum-size inverters in the design. What is the Vsp of the inverters?
18.7
Design and simulate the operation of a one-shot that has an output pulse width of 100 ns. Comment on the maximum rate of retrigger and how ESD diodes connected to bonding pads will affect the circuit operation if the resistor and capacitor are bonded out.
18.8
Generate, using SPICE, Fig. 18.14.
18.9
Design a nominally 7 V voltage generator that can supply at most 1 !1A of DC current (7 MEG resistor). Simulate the operation of your design with SPICE.
Part II CMOS Digital Circuits
372
18.10 Design and simulate the operation of a nominally -1 V substrate pump. Comment on the design tradeoffs. 18.11 Figure P18.11 shows a voltage generator [5] useful in increasing the efficiency of the N-stage voltage multiplier. Describe the operation of the circuit. Use timing diagrams to illustrate your understanding.
VDD
L..+--Vout
C,
CLK CLK
JlfLI l.fl..r Figure P18.1l
Chapter
19 Digital Phase-Locked Loops
The digital phase-locked loop, DPLL, is a circuit that is used frequently in modern integrated circuit design [1]. Consider the waveform and block diagram of a communication system shown in Fig. 19.1. Digital data are loaded into the shift register at the transmitting end. The data are shifted out sequentially to the transmitter output driver. At the receiving end, where the data may be analog (i.e., not have well-defined amplitudes) after passing through the communication channel, the receiver amplifies and changes the data back into digital logic levels. The next logical step in this sequence of events is to shift the data back into a shift register at the receiver and process the received data. However, the absence of a clock signal makes this difficult. The DPLL performs the function of generating a clock signal which is locked or in synchronization with the incoming signal. The generated clock signal is used in the receiver to clock the shift register and thus recover the data. This application of a DPLL is often termed a clock-recovery circuit or bit synchronization circuit. Transmitter
Receiver
Driver
Channel
Input amp Shift register
Shift register
System clock Data out of shift register
/
...fU1.JL.
Figure 19.1 Block diagram of a communication system using a DPLL for the generation of a clock signal.
Clock out of DPLL
374
Part II CMOS Digital Circuits
o
o
o
o
o
o
data
XOR clock
PFD clock
time Figure 19.2 Data input to DPLL in lock and possible clock outputs using the XOR phase detector and PFD.
A more detailed picture of the incoming data and possible clock signals out of the DPLL are shown in Fig. 19.2. The possible clock signals are labeled XOR clock and PFD (phase frequency detector) clock corresponding to the type of phase' detector (PD) used. For the XOR PD, the rising edge of the clock occurs in the center of the data, while for the PFD the rising edge occurs at the beginning of the data. The phase of the clock signal is determined by the PD used'. A block diagram of a DPLL is shown in Fig. 19.3. The PD generates an output signal proportional to the time difference between the data in and the divided down clock, dclock. This signal is filtered by a loop filter. The filtered signal, Vinveo' is connected to the input of a voltage controlled oscillator (VCO). Each one of these blocks is discussed in detail in the following sections. Once each block is understood, we will put them together and discuss operation of the DPLL.
data in
$ data
d£1s!.f!L
$dclock
Phasedetector
~
V.In veo Loop filter
Divide byN (counter)
~
VCO
I I
Clock out
$clock
Figure 19.3 Block diagram of a digital phase locked loop.
I
A more correct name for digital applications is time difference detector (TDD).
The PFD is rarely used in clock recovery applications. Figure 19.2 is simply used to illustrate the different phase relations resulting from an XOR PD or PFD in a locked DPLL.
2
Chapter 19 Digital Phase-Locked Loops
375
19.1 The Phase Detector The first component in our DPLL is the phase detector. The two types of phase detectors, an XOR gate and a phase frequency detector (PFD), have significantly different characteristics. This makes understanding the limitations and performance very important. Selection of the type of phase detector is the first step in a DPLL design. 19.1.1 The XOR Phase Detector The XOR PD is simply an exclusive OR gate. When the output of the XOR is a pulse train with a 50 percent duty cycle (square wave), the DPLL is said to be in lock; or in other words, the clock signal out of the DPLL is synchronized to the incoming data, provided the conditions stated below are met. Consider the XOR PD shown in Fig. 19.4. Let's begin by assuming that the incoming data are a string of zeros and that a divide by two is used in the feedback loop. The output of the phase detector is simply a replica of the dclock signal. Since the dclock signal has a 50 percent duty cycle, it would appear that the DPLL is in lock. If a logic" 1" is suddenly applied, there is no way to know if the clock signal is synchronized (the clock rising edge coincides with the center of the data bit) to the data. This leads to the first characteristic of an XOR PD; 1. The incoming data must have a minimum number of transitions over a given time interval. data dclock Out
data~~ut dclock
data
----JJ/
o o
o
0
1
1 1
o
1 1 0
1
--------------------0 VDD
clock
o
dclock
o
VDD
(clock -;- 2)
Figure 19.4 Operation of the XOR phase detector.
Now consider the situation when the output of the phase detector, with the data input being a string of zeros, is applied to a simple RC low-pass filter (Fig. 19.5). If RC » period of the clock signal, the output of the filter is simply VDD/2. This leads to the second characteristic of the XOR phase detector. R
Figure 19.5 How the filtered output of the phase detector becomes VDD/2.
376
Part II CMOS Digital Circuits 2. With no input data, the filtered output of the phase detector is VDDI2.
The voltage out of the loop filter is connected to the input of the VCO. Consider the typical characteristics of a VCO shown in Fig. 19.6. The frequency of the square wave output of the VCO is fcenler when Vin ( = Vcenler) is VDDI2 (typically). The other two frequencies of interest are the minimum and maximum oscillator frequencies, frnin andfrnax possible, with input voltage V rnin and Vrnax ,respectively. It is important that the VCO continue to oscillate with no input data. Normally, the VCO is designed so that the nominal data input rate and the VCO center frequency are the same. This minimizes the time it takes the DPLL to lock (and is critical for proper operation of the XORPD). fclock Vcenter
frnax feenter
frnin Vrnin
Vin
Vrnax
VDDI2
Figure 19.6 Output frequency of yeO versus input control voltage.
Now let's consider an example input to the phase-detector and corresponding output. The data shown in Fig. 19.7 is leading the dclock signal. The corresponding output of the phase detector is also shown. If this output is applied to a low-pass filter, the result is an average voltage less than VDDI2. This causes the VCO frequency to decrease until the edge of the dclock is centered on the data.
o
o
o
o
o
o
data
dclock
clock
PDout
Figure 19.7 Possible XOR phase-detector inputs and the resulting output.
o
Chapter 19 Digital Phase-Locked Loops
377
3. The time it takes the loop to lock is dependent on the data pattern input to the DPLL and the loop-filter characteristics. Since the output of the PD is averaged, or more correctly integrated, noise injected into the data stream (a false bit) can be rejected. A fourth characteristic of this PD is: 4. The XOR DPLL has good noise rejection.
Another important characteristic of a DPLL is whether or not it will lock on a harmonic of the input data. The XOR DPLL will lock on harmonics of the data. To prove that this is indeed the case, consider replacing any of the clock signals of Figs. 19.2, 19.4, or 19.7 with a clock at twice or half the frequency. The average of the waveforms will remain essentially the same. A fifth characteristic of a DPLL using an XORgate is: 5. The VCO operating frequency range should be limited to frequencies much less than 2!clock and much greater than O.5J;.lock where !clock is the nominal clock frequency for proper lock with a XOR PD. The loop filter used with this type of PD is a simple RC low-pass filter as shown in Fig. 19.5. Since the output of the PD is oscillating, the output of the filter will show a ripple as well, even when the loop is locked. This modulates the clock frequency, an unwanted characteristic of a DPLL using the XOR PD. This characteristic can be added to our list:
6. A ripple on the output of the loop filter with a frequency equal to the clock frequency will modulate the control voltage of the VCO. To characterize the phase detector (see Fig. 19.8) we can define the time difference between the rising edge of the dclock and the beginning of the data as M. The phase difference between the dclock and data, $data -$dcLock, is given by M
A$=$data-$dcLock=T dcLock
. 21t (radians)
(19.1)
or, in terms of the DPLL output clock frequency, AIj> = -M- . 21t
(19.2)
2TcLock fcLock
1
= -T = clock
2fdcLock
2
= -T--
(19.3)
dcLock
When the loop is locked, the clock rising edge is centered on the data; the time difference, M, between the dclock rising edge and the beginning of the data is simply TclocJ2 or Tdclock/4 (see Fig. 19.8c). Therefore, the phase difference between dclock and the data, under locked conditions, may be written as (19.4)
378
Part II CMOS Digital Circuits
I'D:fW .~'"
d a t a = : ! [ ) - VPDout
output over
T'dod
dclock
VDDI2~ T clock
~
o cjldata
~
"'1
1t
21t
i1 = data - dclock
o
o
=0
data
data
data
dclock
dclock
clock
clock
No phase difference
$dc/ock
=-~
cjlclock =-1t
(a)
(c)
(b)
Figure 19.8 XOR PD output for variousinputs (assuminginput data are a string of alternatingones and zeros). Note that, the phase difference between clock and data when in lock is 1t. The average voltage out of the phase detector (Fig. 19.8) may be expressed by mpUI
VPDout
i1
,..-......
= VDD· x =KPD·i1
(19.5)
where the gain of the PD may be written as K pD =
VDD -rr
(V/radians)
(19.6)
To aid in the understanding of these equations, consider the diagrams shown in Fig. 19.8. If the edges of the clock and data are coincident in time (Fig. 19.8a), the XOR output, V p Dou,' is 0 V and the phase difference is O. The loop filter averages the output of the PD and causes the VCO to lower its output frequency. This causes i1 to increase, thus increasing VPDou, ' Depending on the selection of the loop filter, this increase could cause the rising edges to increase beyond, or overshoot, the desirable center point as shown in Fig. 19.8b. In this case, the phase difference is -~1t, and VPDout is ~VDD. Figure 19.8c shows the condition when the loop is in lock and the phase difference is 1tI2.
Chapter 19 Digital Phase-Locked Loops
379
Here we should point out the importance of having the veo center frequency, equal to the desired clock frequency. If henter =hloek , the veo control voltage, depending on the loop filter, will look similar to Fig. 19.9a during acquisition (the loop trying to lock). If these frequencies are not equal, the control voltage will oscillate, causing the clock to move, in time, around some other point than the center of the data bit (Fig. 19.9b). The actual control voltages will look different from those portrayed in Fig. 19.9 because the veo control voltage is dependent on the input data pattern as discussed earlier.
feenter'
Control voltage
Control voltage
VDD
VDD
2
2
(a)
time
(b)
time
Figure 19.9 Average output voltage of phase detector during acquisition.
To summarize the design criteria of the veo with the XOR PD, we desire that; 1. The center frequency,
feen,er'
should be equal to the clock frequency when the
veo control voltage is VDD/2. 2. The maximum and minimum oscillation frequencies, I.: and t.: ' of the veo should be selected to avoid locking on harmonics of the input data. 3. It is important that the veo duty cycle be 50 percent. If this is not the case, the DPLL will have problems locking, or once locked the clock will jitter (move around in time). 19.1.2 Phase Frequency Detector A schematic diagram of the phase frequency detector is shown in Fig. 19.10 [1]. The output of the PFD depends on both the phase and frequency of the inputs. This type of phase detector is also termed a sequential phase detector. It compares the leading edges of the data and dclock. A dclock rising edge cannot be present without a data rising edge. To aid in understanding the PFD, consider the examples shown in Fig. 19.11. The first thing we notice is that the data pulse width and the dclock pulse width do not matter. If the rising edge of the data leads the dclock rising edge (Fig. 19.1la), the "up" output of the phase detector goes high while the Down output remains low. This causes the dclock frequency to increase, having the effect of moving the edges closer together. When the dclock signal leads the data (Fig. 19.11b) Up remains low while the Down goes high a time equal to the phase difference between dclock and data. Figure 19.11c shows the condition of the loop being locked. Notice that, unlike the XOR PD, the outputs remain low when the loop is locked. Again, several characteristics of the PFD can be described:
380
Part II CMOS Digital Circuits
"]"
Q
D
data
Up
Clk Clr
~~
"'-~
Clr dclock
Clk "]"
D
Down
Q
Figure 19.10 Phase frequency detector (PFD).
VDD for tristate I p ump for charge pump
-data
~
Up
:d =
2n
PFD
dala - dclock
+--+---...,jL----+-~
2n -
Down - -
dclock
o for tristate
~
-Ipump for charge pump
data
data
dclock
dclock
Up
Up
Down
~
*-
d ~ +0.4· 2n (a)
data
Up
Down
Down ~~
M ~ -0.25· 2n
~
Inlock
d=O
(b)
Figure 19.11 PFD phase-detector inputs and outputs.
(c)
Chapter 19 Digital Phase-Locked Loops
381
1. A rising edge from the dclock and data must be present when doing a phase comparison. 2. The width of the dclock and the data is irrelevant. 3. The PFD will not lock on a harmonic of the data. 4. The outputs (Up and Down) of the PFD are both logic low when the loop is in lock, eliminating ripple on the output of the loop filter. 5. This PFD has poor noise rejection; a false edge on either the data or the dclock inputs will drastically affect the output of the PFD. The output of the PFD should be combined into a single output for driving the loop filter. There are two methods of doing this, both of which are shown in Fig. 19.12. The first method is called a tri-state output. When both signals, Up and Down, are low, both MOSFETs are off and the output is in a high-impedance state. If the Up signal goes high, M2 turns on and pulls the output up to VDD while if the Down signal is high the output is pulled low through Ml. The main problem that exists with this configuration is that the power supply variations can significantly affect the output voltage when M2 is on. The effect is to modulate the VCO control voltage. This wasn't as big a problem when the XOR PFD was used because of the averaging taking place. The second configuration shown in this figure is the so-called charge pump [2]. MOS current sources are placed in series with Ml and M2. When the PFD Up signal goes high, M2 turns on, connecting the current source to the loop filter. Since the current source can be made insensitive to supply variations, modulation of the VCO control voltage is absent.
VDD
VDD
~ Down
I
Tristate
Down
Charge pump (a)
(b)
Figure 19.12 (a) Tri-state and (b) charge pump outputs of the PFD.
382
Part II CMOS Digital Circuits
We can characterize the PFD in much the same manner as we did the XOR PD. We will assume that !clock and fdclock are equal in this analysis. Therefore, the feedback loop, Fig. 19.3, divides by one (N = 1). If we again assume that the time difference between the rising edges of the data and dclock is labeled I1t and the time between leading edges of the clock (or the time differences between the leading edges of the data since we must have both leading edges present to do a phase comparison) is labeled T clock then we can write the phase (Tclock = Tdclock) as l1t 11 = T . 21t (radians)
(19.7)
clock
The phase difference, 11, is zero when the loop is in lock. The output voltage of the PFD using the tri-state output configuration (see Fig. 19.11) is VPDlri =
VDD-O
41t
·11 = Knu« ·11
(19.8)
where the gain is, KPDtri =
V~: (volts/radian)
(19.9)
If the output of the PFD uses the charge-pump configuration, the output current can be
written (again see Fig. 19.11) as [ PDf
=
[ pump -
(-[pump )
41t
All. _
. L},'I' -
K
All.
PDf' L},'I'
(19.10)
where KpDf
=
[pump • 21t (amps/radian)
(19.11)
The loop filters used with tri-state and the charge-pump outputs are shown in Fig. 19.13. The first loop filter has a transfer function given by 1 + jroR2C
In
from charge-pump phase detector (b)
Figure 19.13 Loop filters for (a) tristate output and (b) charge-pump output.
Chapter 19 Digital Phase-Locked Loops
383
The charge-pump loop-filter transfer function is given (noting the input variable is a current while the output is a voltage) by 1 +jroRCI
(19.13)
To qualitatively understand how these loop filters work, let's begin by considering the loop filter for use with the tri-state output. For slow variations in the phase difference, the filter acts like an integrator averaging the output of the PD. For fast variations, however, the filter looks like a resistive divider without any integration. This allows the loop filter to track fast variations in the time difference between the rising edges. A similar discussion can be made for the loop filter used with the charge pump. For slow variations in the phase, the current, [pump' linearly charges C, and C2 • This gives an averaging effect. For fast variations, the charge pump simply drives the resistor R (assuming C2 is small), eliminating the averaging and allowing the veo to track quickly moving variations in the input data. The design requirements of the veo used with the PFD can be much more relaxed than those for the XOR PD; therefore, it is preferred over the XOR PD. Since the output of the PD can be a voltage from 0 to VDD, the requirement that!cenrer =!clock is not present, although it is still a good idea to design the veo so that this is true. The oscillation range, fmax is not limited by the harmonics of !clock since the PFD will not lock on a harmonic of the clock frequency. The veo clock duty cycle is irrelevant with the PFD since the PD looks only at rising edges. In high-speed or data communications applications, however, one may be forced to use the XOR PD.
t.: '
19.2 The Voltage-Controlled Oscillator The gain of the voltage-controlled oscillator is simply the slope of the curves given in Fig. 19.6. This gain can be written as
K veo = 21t. The
f max - f rrim (radi ra tans / S . V)
Vrmx
-
(19.14)
V IlIin
veo output frequency, fclock' is related to the veo input voltage (see Fig. 19.6) by (19.15) roclock = 21t . fclock = K veo . Vinveo + roo (radians/s)
where roo is a constant. However, the variable we are feeding back is not frequency but phase. The phase of the veo clock output is related to !clock by
o
o
o
o
o
o
data
clock
dclock
111 ns
222 ns
222 ns
Ffgure 19.23 Example waveforms for the DPLL of Example 19.3 in lock.
Next let's discuss the veo. From the previous discussion of Sec. 19.1.1, the maximum f clock can be is 18 MHz and the minimum is 4.5 MHz. When the control voltage is VDDI2, the !center of the veo is 9 MHz. (This is important!) If we try to use the basic current-starved veo of the previous section, we run into the problem of locking on harmonics of the desired clock frequency. A simple method of setting the maximum current in this veo, and thus the maximum frequency, is to place a current limiting resistor in series with the drains of M5 and M6 (see Fig. 19.24). The current that flows in M5 and M6 is mirrored by M8 and M9 and sets the variable current in the veo. To set the minimum current, we add MOSFET M7 to provide a minimum current through M6 when VinVCO < V THN • (Note that this current is always present and added to the voltage-variable current through M6.) In all practical situations, the veo System considerations concerning selection of a data pattern as well as regenerating the clock from NRZ data will be discussed in greater detail later in the chapter.
3
394
Part II CMOS Digital Circuits must be hand tailored to operate over the desired frequency range. Here in itself is the main problem using the XOR-based DPLL in a pure monolithic form. Bringing the frequency setting components off chip can help solve this problem. Precision components can be used to set the operating frequencies. One last concern when designing the VCO, or any CMOS circuit for that matter, is its temperature behavior. This subject is covered in more detail in the corning chapters. VDD
VDD
•••
First stage of veo Figure 19.24 Modifications to the current-starved and maximum frequencies.
veo
to set minimum and
If we design the VCO so that when VinVCO = 4V = V mllx' the output oscillator frequencY,lmllx is 9.1 MHz; when VinVCO = 1V = V min ' the output frequency, t.: is 8.9 MHz then the gain of the oscillator, K vco ' is 21[·67 kHzIV, or
Kvco = 418 X 103 radians/V-s The only component left in the first-cut design of the loop is selection of RC. Let's begin by setting the damping ratio Sto 0.7. Using Eq. (19.36) results in 1 1 07=-· . 2
=-2
~. (418 x 103)RC
-->tRC= 1.5 s
Il
The natural frequency of the second-order system is, from Eq. (19.36), (On
= 2. RIC 'S =476 X 103 radians/s
The lock range is Ll(OL = 1[S(On = 1 X 10 6 radians/s or Ll/L = 167 kHz
Chapter 19 Digital Phase-Locked Loops
395
which is outside the VCO operating range. Therefore, the DPLL will lock over the entire VCO operating range, that is, from 8.9 to 9.1 Mbits/s. We do not need to calculate the pull-in range since it is greater than the lock-in range. Again, the design of the oscillator is important in this DPLL. The lock time, TL , of the DPLL is approximately 13 us, A simulation of this DPLL using the software provided with [1] is shown in Fig. 19.25. Initially, at t< 0, the data rate input is 9.0 Mbits/s, and both the average phase-detector output and the output of the filter are 2.5 V (VDDI2 and Aq> =rc/2), point A in Fig. 19.25. At t =0, the data rate jumps to 9.04 Mbits/s. Both the average phase-detector and filter outputs increase in voltage to 3.1 V. The dclock is now aligned slightly off center of the data, (3.1 VIKPD = Aq> or Aq> = 0.62·n), keeping the loop locked. •
3.200
r--""""T--""'---:---"l""'"-""':---""'---:---"l""'"--:---'"
3.000
.Y.
U
:.c
s -0
2.800 -----
s
::>
Lock time 2.iOO ' - _....._-...,j,-_....._ _....._ _I.-_...,j,-_....._ _....._ _I.-_-' 0.000
2.000
i.ODO
6.000
8.000
10.000
Time
Figure 19.25
12.000
Ii.ODO
16.000
18.000
20.000
(}IS)
Simulation of the DPLL of Ex. 19.3 with a 40 kbiUs data rate step. This corresponds to a frequency step of 20 kHz.
Adding a zero to the simple passive RC loop filter, Fig. 19.26 (called a passive lag loop filter), the loop-filter pole can be made small (and thus the gain of the VCO can be made larger) while at the same time acheiving a reasonable damping factor. The result is an increase ill the lock range of a DPLL using the XOR PD and a shorter lock time[l] see Eqs. (19.37) - (19.40). The passive lag loop filter is, in most situations preferred over the simple RC. Again, as Ex. 19.3 showed, if the center frequency of the VCO doesn't match the input frequency the clock will not align at n12. The clock misalignment encountered in a DPLL using an XOR PD and passive filter can be minimized by using the active proportional + integral (active PI) loop filter shown in Fig. 19.27. The transfer function ofthis filter is given by
396
Part II CMOS Digital Circuits
KF
= VinVCO = V PDout
Rz
1 +jroRzC 1 +jro(R1 + R Z)C
KPDKvco N(RI +Rz)C
~C
~ = ~n
.
(RZC+
KPD~VCO)
Figure 19.26 Passive lag loop filter used to increase DPLL lock range.
K = 1 +sRzC F SRIC
(19.41)
The natural frequency of the resulting second-order system is given by (19.42) and the damping ratio is given by (19.43) The lock range is (19.44) while the lock time remains 2rc1ron • The pull-in range, using the active PI loop filter, is limited by the VCO oscillator frequency. Consider the following example.
Large R to reduce op-amp offset voltage effects (Gain at DC is not infinite.)
Rz
C
VPDout
----1
> ........--VinVCO VDDI2
Figure 19.27 Active PI loop filter.
Chapter 19 Digital Phase-Locked Loops
397
Example 19.4 Repeat Ex. 19.3 using the active PI loop filter. If the output of the VCO is 10 MHz (= fma)' when the input voltage is 4 V and 8 MHz (= f mi) when the input to the VCO is 1 V, then the gain of the VCO is K vco
6 = 2rc· 10-8 4 -1 =4.2 x 10 radians/Vs
which is much easier to realize in CMOS. If the lock range between data and dclock is set so that the VCO limits the operating frequency range, say li.fL = 1 MHz, then the natural frequency using Eq. (19.44) and assuming ~ = 0.7 is ffin
=
2~~1. ~.~06 = 713 X 10 3 radians/s
Using Eqs. (19.42) and (19.43) with N = 2, we can solve for RIC and R 2C as approximately 6.6 us and 2 us, respectively. The lock time of this loop is now 8.8 us, Simulation results showing a 500 kbit/s data rate step are shown in Fig. 19.28. This corresponds to the data changing from 9 Mbits/s to 9.5 Mbits/s. The DPLL of Ex. 19.3 cannot lock to data input at 9.5 Mbits/s. Note the average PD output is 2.5 V keeping the phase difference between the dclock and data at rc/2 independent of the VCO center frequency and the DPLL input frequency. •
i.200 , . . . - - , . . . . - - , . . . - - , . . . . - - , . . . . - - , . . . . - . . . . , : - - - . . . . , : - - - . . . . , - - . . . . , - - . . . ,
i.OOO
3.800
3.600
Figure 19.28 Simulation of the DPLL of Ex. 19.4 with a 500 kbitls input data rate step.
398
Part II CMOS Digital Circuits
19.3.2 PFD DPLL A block diagram of a DPLL using the PFD with tri-state output is shown in Fig. 19.29. The phase transfer function is the same as Eq. (19.30) H(s)
=
(b) Decision level too high
J
L
(c) Decision level too low
Figure 19.37 Timing errors in regenerating digital data.
406
Part II CMOS Digital Circuits
- - - - - - - - - - - - - OV
Input Vin~1 (Analog bitstream)
J
+
comparat_or_ _
1;t5-
-
Output (digital data)
Figure 19.38 The effectof data pattern on the decision-making circuit.
method encodes the digital data so that the duty cycle of the resulting encoded data is 50 percent. The encoding increases the channel bandwidth for a constant data rate. Consider the peak detector circuit shown in Fig. 19.39. When the input, Via' is greater than the output, vpeak ' the comparator output goes high, turning the MOSFET on. This causes the capacitor to charge toward VDD. When vp eak gets slightly larger than the input voltage, the comparator turns off. This in turn shuts the MOSFET off, leaving the capacitor essentially charged to the peak value of v j a ' The peak detector is used in the digital decision circuit shown in Fig. 19.40. Current sources, of a small value, are added to the basic decision circuit to make the peak detectors lossy. This may be necessary so that the decision circuit can follow the slow amplitude and data variations. The buffers shown in the circuit isolate the peak detectors from one another. These buffers can be implemented in some cases using the MOSFET source follower configuration (see Ch. 22). The two resistors perform the averaging function. The average of the analog input is feedback to the inverting input of the comparator. This scheme forces the data to be sliced in the middle, eliminating timing errors. VDD
V in - - - - - - I
+
L - - - - - - - - - - - - - ' t - - - - 7 V peak
Figure 19.39 CMOS peakdetector.
407
Chapter 19 Digital Phase-Locked Loops
Analog input
Ana~ t-.----....---'-----'--------i+
Decision comparator
bit stream
Digital output
>--------'
Average of the analog input
VDD
Positive peak detector
...-----1+ V +peak
+ V -peak 2
R
VDD
R
'---~+
Figure 19.40 Decision circuit.
Encoding the data can eliminate the need for a decision circuit. If the resulting encoded data has a 50 percent duty cycle, it can be passed through a capacitor in the receiver (Fig. 19.38), resulting in an analog signal centered around ground. The comparator can then have its noninverting input connected to ground and slice the data at the correct moments in time (in the middle of the data bit). An example of an encoding scheme is shown in Fig. 19.41. Encoding occurs in the transmitter prior to transmission over the channel. This particular encoding scheme is referred to as the bi-phase format, or more precisely, the bi-phase-level (sometimes called bi-phase-L or Manchester NRZ) format. The cost of using this scheme over the NRZ data format is increased channel bandwidth. Other encoding schemes are shown in Fig. 19.42 [1].
19.4.1 Clock Recovery from NRZ Data One of the most important steps in the design of a communication system is selection of the transmission format, that is, NRZ, bi-phase, or some other format, together with use of parity, cyclic redundancy code, or some other encoding format.
408
Part II CMOS Digital Circuits
d a t a = j D - Bi-phase encoded data out clock
o
o
o
o
o
o
data
clock
Bi-phase
time Figure 19.41 Bi-phase data encoding.
In this section, we discuss some of the considerations that go into the design of a clock-recovery DPLL in a system that uses NRZ. The reasons for the selection of the formats used in Ex. 19.3 and the need for a divide by 2 in the feedback loop will be explained. Let's begin this discussion by considering the NRZ data and clock shown in Fig. 19.43. Let's further assume that these signals are the inputs to an XOR PD in a DPLL, which is not in lock since the clock is not aligned properly to the data. The resulting output of the XOR PD is shown in this figure as well. If we were to average this output using a loop filter, we would get VDDI2. In fact, it is easy to show that shifting the clock signal in time has no effect on the average output of the PD. Why? To answer this question, let's use some numbers. Assume that a bit width of data is 10 ns (which is also the period of the clock). The frequency of the square wave resulting from the alternating strings of ones and zeros is 50 MHz. We know that if we take the Fourier Transform of a square-wave, only the odd harmonics (i.e., 50, 150, and 250 MHz) are present. Since the clock signal is at 100 MHz, there is no energy or information common between the clock and data signals. To remedy this, we divide the clock down in frequency, dclock, so that it is at the same frequency as the alternating ones and zeros of the data (divide by 2). The next problem we encounter, if we use the divide by two in the feedback loop, occurs when we get data that is a repeating string of two-ones followed by two-zeroes, Fig. 19.44 (the dclock is not locked to the data). Again, there is no common information between the two inputs, and the resulting XOR PD output will always have
409
Chapter 19 Digital Phase-Locked Loops
o
o
o 1 = high O=low
NRZ-Ievel
1 = transition at beginning of bit
NRZ-mark
o = no transition
o = transition
at beginning of bit I = no transition
NRZ-space
o
o
o 1 = high first half of bit interval
Return to zero
o = low entire bit interval
Bi-phase-level
1 = high first half of bit interval
o = low first half of bit interval
o Bi-phase-mark
o
o I = transition at beginning and middle of bit interval o = transition at beginning of bit interval only (Bi-phase-space inverted from this)
Delay1 = transition in the center of modulationbit interval mark -1==--+--+--=::::jF=~-l-~=:j::::=:::j.---l-~ 0 after I = no transition time o after 0 = transition at beginning of bit interval (Delay-modulation-space inverted from this) Figure 19.42 Data transmission formats [1].
410
Part II CMOS Digital Circuits
data
clock
XORPD out
Averageof XOR output is VDD/2 even though the loop is not locked.
2005
Figure 19.43 The problems of using clock without the divide by 2 to lock on data.
an average of VDDI2. In this case, however, the dclock is running at 50 MHz and the data is a square-wave of 25 MHz. Should we divide the clock down further to avoid this situation? The answer is no. However many times we divide the clock down, we can still come up with a data string that will not allow the loop to lock. Also, it is the actual edge transitions (the frequency of the data and dclock) that is used when the inputs are not pure square-waves. Increasing the width of dclock has the effect of removing information and making it more difficult to lock up to the data. One solution to this problem, for an eight-bit word, was given in Ex. 19.3. If we use odd-parity with an eight-bit word (nine bits total) and eliminate, at the transmitting end, the possibility of all eight bits being high, that is, 11111111 or 255, then it is impossible to generate a square-wave.
o
o
o
o
o
o
data
dclock
XORPD out
Averageof XOR output is VDD/2 even though the loop is not locked.
time
Figure 19.44 Problems trying to lock on a data stream that is one-half the dclock frequency.
Chapter 19 Digital Phase-Locked Loops
1
r---
0
0
0
1
411
1
0
0
-
0
1
1
0
r---
NRZ in
-
1
Edge out
---)
1
~
1 1 ~
~ \
r---
L time
Inverter delay
Figure 19.45 Detecting the edges in NRZ data.
The restrictions on the data pattern in a communications system using NRZ data can be reduced by detecting the edges of the input data using an edge detector circuit (Fig. 19.45) [1]. The delay through the inverters sets the width of the output pulses, labeled "Edge out" in this circuit. The frequency content of the output pulses will always contain energy at the clock frequency and thus the loop can lock up on the data. As an example, consider the block diagram and data shown in Fig. 19.46. The Edge output is connected as the input of an XOR based DPLL. The output of the VCO, clock, will lock up on the center of the Edge output, that is, the rising edge of the clock signal will become aligned with the center of Edge out. Averaging PD out, in this figure, results in VDDI2. If the clock is shifted to the left or right in time, the average value of PD out will shift down or up, causing the VCO frequency to change, keeping the clock aligned to the center of Edge out. Several practical problems exist with this configuration. The delay through the inverters should be constant whether a high-to-low or a low-to-high transition is propagating through the inverters. Also, the delay of the inverters, or whatever element is used for the delay (one common element for high-speed applications is a microstrip line), should be close to one-half of the bit-interval time for best performance. For example, if the bit interval, for the data shown in Fig. 19.46, is 10 ns, then the delay used in the edge detector should be 5 ns. This delay is important since it directly affects the gain of the phase detector and therefore the transient properties of the DPLL. Not having the clock aligned to the center of the data bit can cause problems in high-speed clock-recovery circuits. Simply adding a delay in series with the clock
412
Part II CMOS Digital Circuits
NRZ in
Edge detector
lock
10 ns
o
o
o
NRZin
Edge out
clock
PDout
time
Figure 19.46 Clock-recovery circuit for NRZ using an edge detector. Note that the DPLL is in lock, when the rising edge of clock is centered on the edge output pulse.
signal will not solve this problem since the temperature dependence and process variations of the associated circuit would not guarantee proper alignment. What is needed is a circuit that is self-correcting, causing the clock signal to align to the center of the data bit independent of the data-rate, temperature, or process variations. The phase-detector portion of a self-correcting clock-recovery circuit is shown in Fig. 19.47 [7] along with associated waveforms for a locked DPLL. Nodes A and Bare simply the input NRZ data shifted in time by one-half bit-interval and one bit-interval, respectively. The outputs of the phase detector are labeled Increase and Decrease. If Increase is low more often than Decrease the average voltage out of the loop filter and thus the frequency out of the VCO will decrease. A loop filter that can be used in a self-correcting DPLL is shown in Fig. 19.48a. This filter is the active-PI loop filter discussed in Sec. 19.3.1, with an added input to accommodate both outputs of the PD. Figure 19.48b shows the resulting waveforms in a DPLL where the clock is leading the center of the NRZ data, and thus Increase is high less often than Decrease. If the NRZ data were lagging the center of the data bit Decrease would be high less often than Increase, resulting in an increase in the loop-filter output voltage. Note that in this discussion we have neglected the propagation delays present in the circuit. For a
413
Chapter 19 Digital Phase-Locked Loops
-.......- - VinVCO
VDD/2
(a)
0
0
0
0
0
0
0
NRZin
I
clock
Node A
clock
NodeB
NRZ E9A
Increase
A E9B
time (b)
Figure 19.48 (a) Possible loop filter used in a self-correcting DPLL and (b) waveforms when the loop is not in lock and the clock leads the center of the data.
Chapter 19 Digital Phase-Locked Loops
415
high-speed self-correcting PD design, we would have to analyze each delay in the PD to determine their effect on the perfomance of the DPLL. Jitter
Jitter, in the most general sense, for clock-recovery and synchronization circuits, can be defined as the amount of time the regenerated clock varies once the loop is locked. Figure 19.49a shows the idealized case when the clock doesn't jitter, while Fig. 19.49b shows the actual situation where the clock-rising edge moves in time (jitters). In these figures, the oscilloscope is triggered by the rising edge of the data.
...
Scope triggeredhere
data
data
clock
clock
time (a)
time
~
)
,
(b)
Jitter
Figure 19.49 (a) Idealized view of clock and data without jitter and (b) with jitter.
In the following discussion, we will neglect power supply and oscillator noise, that is, we will assume that the oscillator frequency is an exact number that is directly related to the VCO input voltage. In the section following this one, we will cover delay-locked loops and will further discuss the limitations of the VCO. Consider using the charge pump with the self-correcting PD shown in Fig. 19.50. When the loop is locked (from Fig. 19.47), both increase and decrease occur (with the same width) for every transition in the incoming data. Note that unlike a PFD/charge pump combination where the output of the charge pump remains unchanged when the loop is locked, the self-correcting PD/charge-pump combination will generate a voltage ripple on the input of the VCO (similar to the XOR PD with RC or Active PI filter)", Let's assume that this ripple is 10 mV and use the values for VCO gain and frequencies given in Ex. 19.5 to illustrate the resulting jitter introduced into the output clock. The change in output frequency resulting from this ripple is lOmV·(628 x 103 radiansN·s)·(1I21t) or 1 kHz. This means that the output of the
Of course, the self-correcting PD should not be used in most frequency synthesis applications. Similarly, the PFD should not be used in most data-recovery applications.
4
416
Part II CMOS Digital Circuits
VDD
G>data
data Self-correcting PD
G>dclock
:1 Ie,
.-------------1~-+VinVCO
dclock
Charge pump
Loop filter
Figure 19.50 Self-correcting PD with charge pump output.
DPLL will vary from 255.5 to 260.5 kHz or, in terms of a jitter specification the clock jitter is 75 ns. From this example, jitter can be reduced by
1.
Reducing the gain of the VCO. Ripple on the input of the VCO has less of an effect on the output frequency. The main disadvantage, in the most general sense, of reducing the gain of the VCO is that the range of frequencies the DPLL can lock up on is reduced. Also, the VCO gain strongly affects the ability to fabricate the VCO without postproduction tuning.
2.
Reducing the bandwidth of the loop filter. This has the effect of reducing the actual ripple on the input of the VCO. The main drawback here is the increase in chip real estate needed to realize the larger components used in the filter.
3.
Reducing the gain of the PD. This also has the effect of reducing the ripple on the input of the VCO. This method is, in general, the easiest when using the charge pump since reducing the gain is a simple matter of reducing [pump' Substrate noise can become more of a factor in the design.
Another way of stating the above methods of reducing jitter is simply to say that the forward loop gain of the DPLL, that is, KpDKFKvco' should be made small. The main problems with using small forward loop gain are the reductions in lock range and pull-in range coupled with the associated increases in pull-in and lock times. We have not discussed jitter reduction in DPLLs employed in frequency synthesizers or clock synchronizers where the input is a clock signal rather than a bit stream. In these circuits the VCO performance, in general, is the limiting factor.
Chapter 19 Digital Phase-Locked Loops
417
19.5 Delay-Locked Loops Problems with PLL output jitter resulting from the VCO output frequency changing (often called oscillator or phase noise) with a constant input voltage (Y;nvco = constant) has led to the concept of a delay-locked loop (DLL). Figure 19.51 shows the basic block diagram of a DLL. Assuming a reference clock is available at exactly the correct frequency, the input data are delayed through a voltage-variable delay line (VVDL) a time to until it is synchronized with the reference clock. Jitter is reduced by using an element, the VVDL, that does not generate a signal (like the VCO did). The transfer function G>cloctlG>OUI is zero[8] (the phase of the reference clock is taken as the reference for the other signals in the DLL, i.e., G>clOCk = 0), so that oscillator noise and the resulting jitter are not factors in DLL design. The jitter considerations discussed in the last section, however, are still a concern since any ripple on the output of the loop filter will cause jitter.
G>in data in
Voltage variable delay line (VVDL) K v with delay to
G>our - -.....- - i Self-correct.
Chrg. pump
Phase detect.
KD G>dock
=0
\
Loop filter
KF
Switched to provide negative feedback
clock
---------------------------"-=::...-~
Reference clock in
Figure 19.51 Block diagram of a delay-locked loop.
The phase (in radians) of the input data is related to the phase of the output data by G>our = G>in
+ to . -21t T
(19.62)
dock
where Tclock is the period of the reference clock (or half of the period of the data in for a string of alternating ones and zeros). The gain of the VVDL can be written in terms of the delay, to' by to
= K v . Voutfilter
(19.63)
where K; has units of seconds/V and VOU(filter is the voltage input to the VVDL from the loop filter. The minimum and maximum delays of the VVDL should, in general, lie between Tclo j 2 and 1.5Tclock for proper operation. The output of the loop filter can be written as Voutfilter
= G>out . KD . KF
(19.64)
418
Part II CMOS Digital Circuits
The overall transfer function may now be written as .
(21.14)
or
~ =1.125
(21.15)
Zero temperature coefficient, to a first order, can be met by satisfying this equation. However, this ratio is most often set by the desired Vrer Example 21.1 Design a 3 V reference using the MOSFET-only voltage divider assuming VDD = +5 V and VSS = 0 V. Determine the temperature coefficient of the reference. Verify your hand calculations with SPICE. Compare the power dissipation when L1 = L; = 5 urn with L] = Lz = 50 urn, Since we know that VTHN = 0.8 V and VTHP = 0.9 V, we can determine the ratio of ~I to ~z using Eq. (21.9):
~= [5 -3 -0.9Jz =0.25 ~z
3-0-0.8
Setting L] = L; = WI = 5 urn gives
KPnWILz = KPpWzLI
(50XI0~~ )51l51l =0.25
(17 x 10- ~ 6
)
Wz51l
or solving gives Wz = 60 urn, The temperature coefficient is given by TC(Vref) =
t·~ 17-60
+1
.[.0027 + J;rio (-0.0024)J = 337 ppm/X'
The PSPICE simulation results are shown in Fig. 21.4. The temperature coefficient of this reference calculated from the figure is approximately 400 ppm/rC. The small difference between PSPICE and our hand calculations can be attributed to the temperature coefficients of the threshold voltages. The drain current when L = 5 urn is 125 /lA, and the power dissipated by the circuit is 600 J..lW. When L = 50 urn, the drain current drops to 12.5 J..lA and the power dissipation becomes 60 J..lW. Reducing the power dissipation requires that we
Chapter 21 References
467
use larger devices. Using the threshold voltage drop of an additional device in series with the two of Fig. 21.3 will help with this problem. • R3.3V.--------------------------, e f e r e
actual V"j r--"--.
n
~ 3.2V
Vre.t02(l + gm2rol) IIr03 _ [(rdl + gm2roI)llro3] v2- V d 1 - · . ...!...(1+~) 1
(22.70)
The total harmonic distortion (THD) is given by THD=
. . +a~
(22.71)
Output buffers, amplifiers used to drive a large load capacitance or low resistance, are examples of amplifiers where low THD is important. If the output amplifier is biased so that the DC component of the drain current is large compared to the transient or time-varying current, the buffer dissipates too much power for most applications. Therefore, in almost all situations, the biasing current in an output buffer is comparable, or even smaller for class B operation than the time-varying current. We reduce the distortion by employing feedback around the amplifier (see Ch. 23). If the open-loop gain of an op-amp varies from 1,000 to 10,000 depending on the amplitude of the input signal, then the feedback around the amplifier reduces the gain sensitivity. In fact, it is nearly impossible to design a linear output amplifier with low distortion without the use of feedback.
514
Part III CMOS Analog Circuits
Modeling Distortion with SPICE
SPICE can be used to simulate distortion using a transient analysis and the .FOUR (Fourier) statement [5]. The general form of this statement is .FOUR FREQ OVI __---
V CMFB
R Buffers R
2 Figure 25.59 Improved range CMFB circuit.
A simple method of changing a single-ended input signal referenced to ground into a signal usable in a differential system is shown in Fig. 25.60. The p-channel MOSFETs perform two functions: (1) DC level shifting (adding VSG of the p-channel VDD
VDD
VSG
Vin
+ Feedback is not shown. See Sec. 26.3.2 for a detailed discussion of single to differential conversion.
Figure 25.60 Circuit used to change a single-ended input signal into a differential signal.
670
Part III CMOS Analog Circuits
MOSFETs to the input signal) and (2) buffering the input signal. Note that the value of VSG is not critical - it simply moves the input signal into the CMR of the op-amp. The output DC level of the op-amp is determined by the CMFB circuit. (VSG should be close to VCM if resistive feedback is used in order to reduce the amplifier input DC current.) Compensating the CMFB Circuit
The CMFB circuit combined with the folded-cascode OTA forms a feedback loop. As with any feedback loop, we must ensure stability. If we apply a common AC signal (let's call it vo ) to both inputs of the CMFB amplifier of Fig. 25.58, the resulting gain is :!..f!:!f!!..=gm5""1 gm9 V oc
(25.64)
where gm5 is the small-signal transconductance of MF5, MF6, MF7, or MF8 and gm9 is the small-signal transconductance of MF9. The bandwidth of this configuration is very wide. This is important since we do not want any phase shift through the CMFB circuit to degrade the phase-margin of the feedback loop. To actually understand the feedback mechanism present, consider the simplified drawing of the OTNCMFB circuit shown in Fig. 25.61. One side of the folded-cascode amplifier is shown, and the CMFB circuit is drawn as a gain block. The gain from the gate of M5 to the output (the drain of M8) is gmS·Ro , where Ro is output resistance of the cascode configuration given by Eq. (25.56). If the bandwidth of the CMFB amp is wide compared to the OTA and the gain is approximately one, then the same load capacitance used to compensate the OTA can be used to compensate the CMFB amp.
VDD - - - - ,
V CMFB
',---_----+---Vout
'-----C x 1
v oc
CMFB amp
n-channel MOSFETs M9-M12 not drawn
Figure 25.61 Feedback circuit resulting from addition of the CMFB circuit.
Simulation results for the fully differential folded-cascode OTA of Fig. 25.57, using a CL of 6.1 pF (fu = I MHz) on each output, are shown in Fig. 25.62. For these simulations, VDD = 5 V, VSS = 0, and v, = 2.5 V (DC) + AC, while v. = 2.5 V + AC@180° phase. Interdigitated layout was employed in the folded-cascode section to increase matching. The folded-cascode OTA with common-source output buffers is shown, drawn slightly different than Fig. 25.57, in Fig. 25.63. The CMFB circuit inputs can now be connected to the outputs of the source followers. Layout of the fully-differential folded-cascode OTA is shown in Fig. 25.64. The bias voltages are supplied on polyl.
Chapter 25 Operational Amplifiers
671
o- v--o+- o r -v-v v v v 80.0
200.0
r....
Lv o1500
60.0
\
\
100.0 40.0
1\
20.0
......
50.0
i\
00
0.0
Lvo+
1\
-50.0
-200
1\ \ r-....
-100.0
-150.0
-40.0 100
10A3
10A4
frequency
1QA5
1QA6
10A7
100
1QA8
1QA3 10A4 1QA5 10"6 frequency
Hz
1QA7 1QA8
Hz
Figure 25.62 Magnitude and phase responses of the folded-eascode OTA of Fig. 25.57. VDD
VCMFB
b----------------+llr--.
Vbias2--~I__------+---I__----_d
v o-
Vbias4 ---++--------++---------11
VSS Figure 25.63 Fully differential folded-eascode op-amp.
672
Part III CMOS Analog Circuits
N
~
0)
0)
... a::i
a::i
...Q
:>
=
I:
+
....
::I D
:> (T)
~
0)
I/)
...
....
OJ
rtI
...Q
..Q
:>-
:>
I:
Figure 25.64 Layout of the folded-cascade OTA.
A buffered differential op-amp topology is seen in Fig. 25.65 without the input diff-amp drawn. This topology uses the floating current sources discussed in Sec. 25.2.2. The middle string of MOSFETs shown in this figure are used for biasing. However, if the diff-amps source or sink current into the outer MOSFETs, in this section of the op-amp, the biasing can be affected to the point where the op-amp doesn't
Chapter 25 Operational Amplifiers
673
VDD
VSS Figure 25.65 Buffered differential output op-amp using floating current sources. Note that the output buffers will not operate class AB when one of the diff-amps is off.
VDD
v---+t---il
I f----+t--v +
VSS
v _---- v., then Vout = VDD
= logic 1
< v., then Vout = VSS
=logic 0
>----Vout V+
Figure 26.1 Comparator operation.
686
Part IV Mixed-Signal Circuits
A block diagram of a high-performance comparator is shown in Fig. 26.2. The comparator consists of three stages; the input preamplifier, a positive feedback or decision stage, and an output buffer. The preamp stage (or stages) amplifies the input signal to improve the comparator sensitivity (i.e., increases the minimum input signal with which the comparator can make a decision) and isolates the input of the comparator from switching noise coming from the positive feedback stage (this is important). The positive feedback stage is used to determine which of the input signals is larger. The output buffer amplifies this information and outputs a digital signal. Designing a comparator can begin with considering input common-mode range, power dissipation, propagation delay, and comparator gain. We will develop a basic comparator design using a procedure similar to the last chapter's development of the basic op-amp.
v, v.,
--P-----+ ~.--r + ~ +~~ +""";>'---__----,~_Lo-g-iC-le-ve~:ut v o+ v o-
10--
Preamplification
Decision circuit (positive feedback)
Postamp lification (output buffer)
Figure 26.2 Block diagram of a voltage comparator.
Preamplification
For the preamplification stage, we chose the circuit of Fig. 26.3. This circuit is a differential amplifier with active loads. The sizes of MI and M2 are set by considering the diff-amp transconductance and the input capacitance. The transconductance sets the gain of the stage, while the input capacitance of the comparator is determined by the size of Ml and M2. We will concentrate on speed in this design, and therefore we will set the channel lengths of the MOSFETs to 211m. (Channel length modulation gives rise to an unwanted offset voltage.) Notice that there are no high-impedance nodes in this circuit, other than the input and output nodes. Using the sizes given in the schematic, we can relate the input voltages to the output currents by .
10 + =
gm( v+-v_ ) +"'2= Iss I SS-I.o- = 20 ~A - 1.0 "'2
(26.1)
where, for the present case, 10
~A
2-·50-·IO~A 2 V2
~A
=71V
(26.2)
Chapter 26 Nonlinear Analog Circuits
687
In other words, if v+ is 10 mV greater than v_, the output currents, i o + and i., are 10.35 J1A and 9.65 J1A, respectively. To further increase the gain of the first stage, we can size up the widths of MOSFETs M3 and M4 relative to the widths ofM31 and M41.
VDD =5 V
M4 3/2
Figure 26.3 Preamplification stage of comparator.
Decision Circuit
The decision circuit is the heart of the comparator and should be capable of discriminating mV level signals. We should also be able to design the circuit with some hysteresis (see Ch. 18) for use in rejecting noise on a signal. The circuit used in the present comparator is shown in Fig. 26.4 [1]. The circuit uses positive feedback from the cross-gate connection of M6 and M7 to increase the gain of the decision element. Let's begin by assuming that io + is much larger than t: so that M5 and M7 are on and M6 and M8 are off. We will also assume that ~5 = ~8 = ~A and ~6 = ~7 = ~B' Under these circumstances, v o_ is approximately 0 V and vo + is v o+ =
J2i137" + o+
VTHN
(26.3)
t; and decrease i.: switching takes place when the drain-source voltage of M7 is equal to VTHN of M6. At this point, M6 starts to take current away from M5. This decreases the drain-source voltage of M5 and thus starts to turn M7 off. If we assume that the maximum value of v0+ or v is equal to 2 VTHN , then M6 and M7 operate,
If we start to increase
0-
688
Part IV Mixed-Signal Circuits
M7
M6
Figure 26.4 Positive feedback decision circuit.
under steady-state conditions, in either cutoff or the triode regions. Under these circumstances, the voltage across M7 reaches VTHN , and thus M7 enters the saturation region, when the current through M7 is
. = 2PB(v o+ -
10 -
V)2 THN
PB . 1. + = PA 0
(264) .
This is the point at which switching takes place; that is, M7 shuts off and M6 turns on. PH' then switching takes place when the currents, i.. and t., are equal. Unequal ps cause the comparator to exhibit hysteresis. A similar analysis for increasing i: and decreasing t; yields a switching point of
If PA =
.
10 +
=
PB. PA . 1
(26.5)
0-
Relating these equations to Eq. (26.1) yields the switching point voltages (review Ch. 18), or ~B
VSPH
1
Iss ~A R =v+-v_ = - . - - for I-'B gm ~B + 1
R
~ I-'A
(26.6)
~A
and VSPL
=-
VSPH
(26.7)
For the present design under development, we will use 3 urn and 2 urn device widths and lengths (no hysteresis and the offset voltage is not important). Example 26.1 For the circuit shown in Fig. 26.5, estimate and simulate the switching point voltages for two designs: (1) Ws = W6 = W7 = Ws = 3 urn with L =2 urn and (2) Ws = Ws = 3 urn and W6 = W7 = 4 urn with L = 2 urn.
689
Chapter 26 Nonlinear Analog Circuits
VDD =5V
M3 3/2
M31 3/2
M4 3/2
v _
Figure 26.5 Schematic of preampand decision circuit. For the first case
so that VSPH = VSPL = O. hysteresis.
In other words, the comparator does not exhibit
Simulation results are shown in Fig. 26.6. The input v_is set to 2.5 V while the input v + is swept from 2.0 to 3.0 V. Note that the amplitudes of vo + and vo_ are limited to approximately 2 VTHN • For the second case PA
= 50 IlA2 . 3 11m V
211m
A and PH = 50 Il . 4 11m V 2 2 11m
or PH = 1.33PA. Using Eqs. (26.6) and (26.7) with Iss !1AJV, we get VSPH
=-
VSPL
= 20
~
and gm
= 71
=40 mV
The simulation results are shown in Fig. 26.7. Fig. 26.7a shows a sweep of v, from 2.4 to 2.6 V, with v_ held at 2.5 V. Since VSPH is 40 mV the decision circuit switches states when v + is 40 mV above v_ (i.e. when v + = 2.54 V). The case of v + being swept from 2.6 to 2.4 V is shown in part (b) of the figure. Switching occurs in this situation when v+ = 2.46 V, or 40 mV less than 2.5 V.
•
690
Part IV Mixed-Signal Circuits
2.0
Volts
I
-
.7'
V
1.5
/
I
'\ /
~
I
--
0.5
I 0.0
2.2
2.1
)
2.4
2.5
l---'
2.3
v o+
I '\\
1.0
2.0
~
/\
v o-
1.9
-
-----
2.6
2.7
2.8
2.9
3.0
v
sweep
Input
v, swept with v., = 2.5 V
Figure 26.6 Simulation results for case 1 of Ex. 26.1.
Output Buffer The final component in our comparator design is the output buffer or postamplifier. The main purpose of the output buffer is to convert the output of the decision circuit into a logic signal (i.e., 0 or 5 V). The output buffer should accept a differential input signal and not have slew-rate limitations.
2.0
2.0
(a)
,l
Volts
Volts
1.5
I
vo-
1.0
I Vo~
V;. V
0.5
~
0.5
I r
0.0
2.40
2.45
2.55
2.50 sweep
r-.
I
2.54 V
- L.---
v
2 ' If the currents II and 12 are equal, then zero current flows in M3 and M4. Also, if 12 is greater than II' zero current flows in M3 and M4. If II is larger than 12 , the difference between these two currents (II - 12) flows in M3. Since M4 is K times wider than M3, a current of K(I 1- 12 ) flows in M4 (normally K < 1). Two of these diff-amps are needed to implement the adaptive biasing of the diff-amp of Fig. 26.21. Figure 26.23 shows the implementation of adaptive biasing into the diff-amp of Fig. 26.21. P-channel MOSFETs are added adjacent to M3 and M4 to mirror the currents through Ml and M2 (II and I). The maximum total current available through MI occurs when M2 is off. Positive feedback exists through the loop MI, M3, M5-M7. Initially, when M2 shuts off, the current in MI and M3 is Iss' This is mirrored in M5 and M6, and thus Issl becomes K·Iss' At this particular instance in time, the tail current, which flows through MI, is now Iss + KIss. However, provided the MOSFETs MI, M3 - M7 remain in saturation, this current circles back around the positive feedback loop and increases by K. This continues, resulting in a final or total tail current of
I tot = Iss . (l + K + K 2 + K 3 + ...)
(26.9)
If K < 1, this geometric series can be written as
Iss I tot = I-K
(26.10)
Setting K = 0 (MOSFET M7 doesn't exist) results in no adaptive biasing and a total tail current of Iss. Setting K = 1/2 (M7 half the size of M6) results in a total available tail current of 2·Iss' Since the tail current limits the slew rate, when the diff-amp is driving
702
Part IV Mixed-Signal Circuits
VDD
llSS2
ISSll
+
Iss
M7
VSS
Figure 26.23 Adaptively biased diff-amp.
a capacitive load, making K equal to one eliminates slew-rate limitations while at the same time not increasing static power dissipation. In practice, shuting off one side of the diff-pair, MIIM2, is difficult since the adaptive biasing has the effect of lowering the source potentials of the diff-pair, keeping both MOSFETs on. Adaptive biasing can be used in a comparator where MI or M2 can shut off. However, the static power dissipation will be large, and therefore there is no benefit over the comparators discussed earlier in the chapter. When applying adaptive biasing to an OTA design, the value of K should be unity or less. [Using a K of 1 or 2 can still result in a finite 1/0 1 since the MOSFETs have a finite output resistance and since the MOSFETs in the diff-pair will not shut off, as was assumed in the derivation of Eq. (26.10)]. An adaptively biased OTA is shown in Fig. 26.24 [5]. A final example of an adaptive voltage-follower amplifier is shown in Fig. 26.25 [6]. This amplifier can only source current to a load. If vin and Vout are equal, the current that flows in MI and M2 is Iss + ID6 • If vin is increased, the current in MI and M3 increases. This causes the currents in M4 - M6 to increase, effectively increasing the tail current of the diff-pair. The result is a large current available to drive the load. Note that M7 can be sized larger than the other MOSFETs to increase maximum output current.
Chapter 26 Nonlinear Analog Circuits
703
VDD
Vout
Figure 26.24 Adaptively biased OTA [5].
VDD
Vin--1
II-----+-------.--Vout
Load
Iss
Figure 26.25 Adaptive voltage follower [6].
704
Part IV Mixed-Signal Circuits
26.3 Analog Multipliers Analog multipliers find extensive use in communication systems. Figure 26.26 shows the voltage characteristics of a four-quadrant multiplier [7]. This multiplier is termed a four-quadrant multiplier because both inputs can be either positive or negative. The ideal output of the multiplier is related to the inputs by Vaut
= Km
(26.11)
. VxV y
where Km is the multiplier gain with units of V-I. In reality, imperfections exist in the multiplier gain, resulting in offsets and nonlinearities. The output of the multiplier can be written as [7] (26.12) where V asx' V a sy' and VaSaut are the offset voltages associated with the x-, y-inputs, and the output, respectively. The terms v~ and v~ represent nonlinearities in the multiplier. Normally, these nonlinearities are specified in terms of the total harmonic-distortion or
+
-
+ -
+
·v
v out
Analog multiplier
Vy
Vy
v, is a negative constant. Vaut
is a positive constant.
]
+-------~:_--------+ Vx
Figure 26.26 Operation of a four-quadrant analog multiplier.
Chapter 26 Nonlinear Analog Circuits
705
by specifying the maximum deviation in percentages between a straight line and the actual characteristic curves shown in Fig. 26.26 over some range of input voltages. Although many different techniques exist for implementing analog multipliers in CMOS [8], we will concentrate on a technique useful in high- and low-frequency multiplication [9, 10]. 26.3.1 The Multiplying Quad A CMOS multiplier employing a multiplying quad (MI - M4) is shown in Fig. 26.27. The multiplying quad operates in the triode region, and thus MOSFETs MI-M4 can be thought of as resistors. For the moment we will not consider the biasing of the quad. The negative output voltage of the multiplier is given by Vo- = -R· (iDi + iD2)
(26.13)
+ iD4)
(26.14)
while the positive output voltage is Vo+ = -R· (im
i», + iD2 Ml
L
M3
R
V o-
+
Vout
?~---+
V o+
R
+
vy
-
Figure 26.27 CMOS analog multiplier.
The output voltage of the multiplier is Vout
= Vo+ -
V o-
=R·
(iDi + iD2 - ios - iD4)
(26.15)
A simplified schematic of the multiplying quad with biasing is shown in Fig. 26.28. The op-amp inputs are at an AC virtual ground and at a DC voltage of VCM (the op-amp output common-mode voltage). In order to minimize the DC input current on the x-axis inputs, the common-mode DC voltage on this input is set to VCM ' The DC biasing voltage on the y-input is set to a value large enough to keep the quad in triode. The input signals have been broken into two parts (e.g., V x /2 and -vx /2) to maintain generality. In practice, the minus inputs can be connected directly to the bias voltages
706
Part IV Mixed-Signal Circuits
Ml
Held at
V?
the op-amp
+
VCM
_
Figure 26.28 Biasing of the multiplying quad.
at the cost of large-signal linearity. (The input is not truly differential in this situation.) However, as discussed earlier, a fully differential system has much better coupled noise immunity. Using Eq. (A.5) and noticing that the DC gate-source voltage of all MOSFETs is the same, the drain currents can be written as iDI
=
itn =
ttn
=
iD4 =
p{ p{ p{
)(?)- ~(? y] (VGS- i -VTHN2 )(- v;) -~(-? y] (VGS - v; - VTHN3 )(?)- ~(? y] (VGS +
i-
VTHNI
P4[ (VGS + v; - VTHN4) ( - v{ ) - ~(- ?y]
(26.16) (26.17) (26.18) (26.19)
We can design so that P= PI = P2 = P3 =P4 • We can use Eq. (26.15) together with Eqs. (26.16) - (26.19) to rewrite the output voltage of the multiplier as Vout
= Rp.
(? XV{ - VTHNI + v{ + VTHN2 + v{ + VTHN3 + v{ - VTHN4J
(26.20)
We can see that if VTHN I = (VTHN2 or VTHN3) and VTHN4 = (VTHN3 or VTHN2 ) , this equation can be rewritten as
Chapter 26 Nonlinear Analog Circuits
Vout =
707
Rp· vxv y
(26.21)
The source of a MOSFET (the terminal we label "source" depends on which way current flows in the MOSFET) in the multiplying quad is connected either to the op-amp or to the x inputs. When the sources of the MOSFETs are connected to the op-amp, all the MOSFETs in the multiplying quad have the same threshold voltage. (Since the source of each MOSFET is tied to the same potential, the body effect changes each MOSFET's threshold voltage by the same amount.) If the + x-input is sinking a current, then the sources of Ml and M3 are the "+" x-input and thus VTHN1 = VTHNJ • In any case, the threshold voltages of the MOSFETs cancel and Eq. (26.21) holds. Comparing Eqs. (26.21) and (26.11) results in defining the gain of this multiplier as (26.22) Simulating the Operation of the Multiplier
Simulating the performance and understanding the analog multiplier operation is an important step in the design process. The design of a multiplier consists of designing the op-amp, selecting the sizes of the multiplying quad, and designing the biasing network. Since we covered the design of differential input/output op-amps in the last chapter, it will not be covered here. In order to simulate the performance of a multiplier in SPICE without including the limitations of the op-amp, the simple model shown in Fig. 26.29 will be used. The sum of the multiplying factors associated with the voltage-controlled voltage sources, El and E2, is the open-loop gain of the op-amp. A typical SPICE statement for these VCVS (voltage-controlled voltage source) where the op-amp open loop gain is 20,000 is E1 E2
Voplus 8 4 3 1E4 8 Vominus 4 3 1E4
where the nodes correspond to those labeled in Fig. 26.29.
, . . - - - - - - - - v o+
3
,
V_~Vo+ v+~vo4
Notice that the polarity is switched from the multiplier output.
' - - - - - - - - V o-
EI and E2 are voltage-controlled voltage sources.
Figure 26.29 SPICE modeling a differential input/output op-amp with common-mode voltage.
708
Part IV Mixed-Signal Circuits
The next problem we encounter in simulating the operation of the multiplier is implementing the differential voltages (e.g. ± Vx 12), in addition to the DC biasing voltages. The setup shown in Fig. 26.20 will be used to implement the biasing and the differential voltage sources. The op-amp common-mode output voltage, VCM ' and the x input voltage are set to 1.5 V. The lower this voltage, the easier it is to bias the multiplying quad into the triode region. On the other hand, a reduction in the value of VCM limits the op-amp output voltage swing and thus the multiplier output range. The size of the multiplying quad was set to 10/2. The larger the WIL ratio of the MOSFETs used in this quad, the easier it is to keep the quad in the triode region. On the other hand, using a large WIL increases the required input current. The channel length can be increased to ensure the device operates as a long channel device and follows Eq. (A.5). Since the quad is part of the feedback around the op-amp, long channel devices do not affect the speed. The DC voltage at the y-inputs was set to 3.5 V as a compromise between keeping the multiplying quad in triode and the y-input voltage range. The gain of the multiplier in Fig. 26.30 is, from Eq. (26.22), A
Km = 20k50 Il .lQ = 5 V-I V2
2
A DC sweep showing the operation of the multiplier is shown in Fig. 26.31. The x-input, vx ' was swept from -1 to +1, while at the same time the y-input was stepped from -1 to 1 V in 0.5 V increments. Keeping in mind that the output of the multiplier is vo+ - vo-' we can understand the data presented in Fig. 26.31 by considering 20k
M1
Vout V o+
20k
M1-M4 are 10/2.
VeM = 1.5 V
20k This multiplier was designed assuming VDD = 5 V and VSS =0.
Figure 26.30 SPICE simulation schematic.
709
Chapter 26 Nonlinear Analog Circuits
points A and B. At point A the y-input is I V while the x-input is 0.2 V. The output voltage of the multiplier is the product of the multiplier gain and these two voltages (i.e., 5·1·0.2 = 1 V). The output voltage at point B is 5·(-0.5)-(-0.6) = 1.5 V. Note that this figure was generated using an almost ideal op-amp. The characteristics do not show the limitations of the op-amp. In particular, the limited output swing. Below is the SPICE netlist used to generate this plot. ••• Top Level Netlist ••• E1 Voplus 843 1E4 E2 8 Vominus 4 3 1E4 M1 7540 CMOSNB L=2u W=10u M2 11 640 CMOSNB L=2u W=10u M3 7630 CMOSNB L=2u W=10u M4 11 530 CMOSNB L=2u W=10u R10 107 20k R7 1011 20k R8 95 20k R9 96 20k Rln Vominus 4 20k RIp Voplus 320k VCM 80 DC 1.5 AC 0 0 VCMx 10 0 DC 1.5 AC 0 0 VDCy 9 0 DC 3.5 AC 0 0 Vx 7 11 DC 0 AC 1 0 Vy 56 DC 1 AC 0 0 .MODEL CMOSNB NMOS LEVEL=4 +VFB=-9.73820E-01, LVFB=3.67458E-O1,wVFB=-4.72340E-02 see Appendix A lor a complete BSIM listing ••••• End of spice models and macro models ••••• .OPTION ABSTOL=1u RELTOL=0.01 VNTOL=1 mv
5.0
Vout
0.0
-5.0
-1.0
-0.8
-0.6
-0.4
-0.2 sweep
-0.0
0.2
v
0.4
0.6
Vx
Figure 26.31 DC characteristics of the multiplier of Fig. 26.30.
0.8
1.0
710
Part IV Mixed-Signal Circuits .probe .DC Vx -1 1 .01 Vy -1 1 .5 .plot de all .printde all
.end
26.3.2 Level Shifting Now that we have discussed the basic operation of the multiplier, the next step is to design the level-shifting stages. Level-shifting stages are used to implement the biasing batteries shown in Fig. 26.28 for both the x- and y-inputs. Before we complete the initial design of our basic multiplier, let's discuss general-level shifting and single-ended to differential conversion since they have many applications in single-supply chip design. Consider the basic p-channel source-follower circuits shown in Fig. 26.32 without the body effect. The source-gate voltages of the p-channel MOSFETs are used to shift the input signals, which are referenced to ground, upward. This circuit could be useful in implementing the x-input level shifter in our analog multiplier. The x-inputs can actually go negative by VTHP before Ml or M2 go into the triode region. The main drawback of using this circuit is the lack of common-mode rejection on the inputs. Also, if we try to drive the circuit single-ended, that is, the minus input connected to ground, the outputs of the circuit are not truly differential. This problem is encountered in any single-ended to differential-ended conversion, including those circuits made using diff-amps. Normally, the best method of designing a single-ended to differential-ended converter is to use a high-gain differential input/output op-amp with feedback. This configuration keeps the signal levels across the input of the op-amp small. Figure 26.33 shows two op-amp configurations, which are useful in single- to
VDD
M3 and M4 are current sources.
Vpbias
[bias
Vx
_ Vx
2
2
Figure 26.32 Level shifting using p-channel source followers.
Chapter 26 Nonlinear Analog Circuits
711
>----Vout ~"--_-Vo_
i---- V CM Assuming V CM = 0
(a)
Figure 26.33 (a) Differential to singled ended converter and (b) single to differential-ended converter.
differential-ended (and vice-versa) conversion. The input/output relationship of the differential- to single-ended amplifier of Fig. 26.33a is RF
(26.23)
Vout= R/v+-v-)
The relationship between the input and outputs of the single-ended to differential amplifier of Fig. 26.33b is Vo+-V o-
RF = _.
R[
(26.24)
Vin
In this figure, we assumed a common-mode voltage of zero (ground). Figure 26.34 shows how the single- to differential-ended converter would be connected if the amplifier was used in a system with a single supply. It is important that all common-mode voltages used in the circuit have the same temperature coefficient. This avoids input DC current and keeps the output of the op-amp from moving toward VDD
.........;;::-
VCM
- - - V 0+
VCM
Figure 26.34 Implementation of a single- to differential-ended converter in single-supply system.
712
Part IV Mixed-Signal Circuits
or ground. For example, if we were to use p-channel source-followers to generate the VCM on the inputs of the amplifier, then we would also use a source follower to generate the op-amp VCM • This idea will be explained in greater detail when we discuss the design of the x-input level-shifing network in our basic multiplier. Another level-shifting circuit (also known as a floating battery) is shown in Fig. 26.35 [11]. The battery voltage generated by this circuit is given by VB
=
VSGI
+ VSG2
(26.25)
The small-signal resistance of the battery (i.e., the resistance between the drain and source of M2) is lIgm2 • Normally, to keep vs; small, ~2 is made large. This results in a VSG2 of approximately VTHP ' and therefore the size of Ml is adjusted to achieve the desired battery voltage. A potential problem exists with this configuration in its current state. Current can only flow from the source of M2 to its drain. This means that an input signal connected to the drain of M2 cannot source a current. Adding the current source, 12 , as shown in Fig. 26.36a helps solve this problem at the cost of an input current - the current 12 flows in V in under steady-state conditions. Adding the source-follower, M3, shown in Fig. 26.36b eliminates input current. Using the source-follower shifts the DC output voltage up by VSG3 • The major benefit of these configurations is that the input voltage can go negative by VTHP and Ml or M3 will remain in the saturation region. If we assume that ~2 and ~3 are large, then VSG3 = VSG2 =VTHr The DC output voltage, for the circuit of Fig. 26.36b, used to shift an input signal upward is VDC
=
VSGI +2VTHP
(26.26)
Input Level Shifting for the Multiplier of Figure 26.27 and 26.28
In the following discussion, we are assuming that the multiplier has to be DC coupled, the inputs are referenced to ground, and only a single supply voltage is used. The biasing design can be greatly simplified if these conditions do not hold. For example, if the inputs can be AC coupled, a simple resistive or MOSFET divider can be used to set
+ VB
Figure 26.35 Floating voltage source.
Chapter 26 Nonlinear Analog Circuits
713
VDD
t - - - - - V i n + VB
+
VSGl
+ VSGl
Ml
Ml
Vin
(a)
(b)
Figure 26.36 Adding input voltage source to battery: (a) with input current and (b) without input current.
the DC operating conditions while the input AC signals can be connected through a capacitor. If the inputs are referenced to, say VCM (which is what would occur if the inputs signals are supplied by a differential input/output op-amp), then diff-amps can be used to generate the bias voltages since the input signals now lie within the CMR of a diff-amp. The complete analog multiplier with level-shifting stages is shown in Fig. 26.37. Current sources M7 and M8 are biased to source 500 J.1A of current. The nominal VSG of MOSFETs M5 and M6 is 1.5 V. A channel length of 2 urn was used in all MOSFETs used in the level-shifting networks for high-speed operation. MOSFETs M9 and MIO are used to generate the VCM for the op-amp (the voltage used at the gates of MF6 and MF7 in Fig. 25.50). This guarantees that the DC reference on the x-inputs and the output of the op-amp are the same voltage and track with temperature. This eliminates DC input current through the multiplying quad and keeps the op-amp output from railing at VDD or ground. Using the same circuit (in this case a source follower) for the DC reference on the inputs and the outputs is very important. Note that in a dual supply system, where ground is the common-mode voltage, temperature drift and op-amp output wander are not a concern. The y-input level-shifting network shifts the y-inputs, which are referenced to ground up to nominally 3.6 V. MOSFETs MIl through M20 are biased at 50 /lA with a corresponding source-gate voltage of 1.2 V. This level-shifting configuration is wide-band since all MOSFETs are operated in the source-follower configuration. Also,
714
Part IV Mixed-Signal Circuits
Vpb:::ias:...e-t--_-d
20k
MI
M8
+
VoVout
Vx
V o+
+ Vx
_ Vx
2
2
vy VDD Vpbias
VPb~ VCM
MI-M4 are 10/2 M5-MI0 are 1000/2 MII-M20 are 50/2 Common-mode voltage for the
VDD =5V
op-amp
-
2
If'
Figure 26.37 Complete analog multiplier.
in both level-shifting networks, the body effect is eliminated by laying out each MOSFET in its own well. The multiplier output is shown in Fig. 26.38. Note that because the gain of the source-followers is less than one, the overall gain of the multiplier is less than five, which is what we predicted earlier with the simple battery implementation of Fig. 26.30.
Chapter 26 Nonlinear Analog Circuits
v
715
vopluEI-vominus
4.0 Voul 2.
-4.0 -1. 0
-0.8
-0.6
-0.4
-0.2
-0.0
0.2
0.4
0.6
0.8
1.0
v
sweep
Figure 26.38 Simulation results for the multiplier shown in Fig. 26.37.
26.3.3 Multiplier Design Using Squaring Circuits An analog multiplier can be designed based on the difference between the sum of two voltages squared and the difference of two voltages squared [12], or Vo = (VI
+ V2)2 - (VI - V2)2 = 4 VI V2
(26.27)
The basic sum-squaring and difference-squaring circuits are shown in Fig. 26.39. MOSFETs Ml and M4 are source-followers, while MOSFETs M2 and M4 are called squaring MOSFETs. This circuit is designed so that PI =P4 =P14' pz =P3 = PZ3 and Pl4 »PZ3' This makes almost all of the DC bias currents, IS12 and IS34 , flow in the MOSFETs Ml and M4, respectively. The squaring current, I sQ' assuming that zero current flows through the resistor when both inputs are zero volts (or whatever the common-mode voltage when a single supply is used), is given by P23
2
ISQ(a) = 7(V I + V2)
(26.28)
Similarly, the squaring current in the difference-square circuit of Fig. 26.39b is given by P23
ISQ(b) = 7(VI - V2)
2
(26.29)
The output voltage of the sum-square circuit is given by
v; = VDD-IsQ(a)R while the output voltage of the difference-square circuit is given by
(26.30)
716
Part IV Mixed-Signal Circuits Vo+ = VDD-IsQ(b)R
(26.31)
A multiplier is formed by taking the difference between these voltages. voltage of the multiplier of Fig. 26.39 is given by V Oal
=V + O
Vo- =R P23[( VI + V2) 2- (VI - V2)2J
The output
(26.32)
4
or, using Eq. (26.27) (26.33)
VDD
ISQ(ai
R
VDD
VOa l - +
ISQ(b)~
R
...----+----'
Vl~ -"-----+--+---+--+--'
VSS
VSS
Figure 26.39 (a) Sum-squaring circuit and (b) difference squaring circuit. REFERENCES [1]
D. J. Allstot, "A Precision Variable-Supply CMOS Comparator," IEEE Journal of Solid-State Circuits, Vol. SC-17, No.6, pp. 1080-1087, December 1982.
[2]
M. Bazes, "Two Novel Full Complementary Self-Biased CMOS Differential Amplifiers," IEEE Journal of Solid-State Circuits, Vol. 26, No.2, pp. 165-168, February 1991.
[3]
B-S. Song, S. Lee, and M. F. Tompsett, "A lO-b 15 MHz CMOS Recycling Two-Step AID Converter," IEEE Journal of Solid-State Circuits, Vol. 25, No. 6, pp. 1328-1338, December 1990.
Chapter 26 Nonlinear Analog Circuits
717
[4]
A. Yukawa, "A CMOS 8-bit High-Speed AID Converter IC," IEEE Journal of Solid-State Circuits, Vol. SC-20, No.3, pp. 775-779, June 1985.
[5]
M. G. Degrauwe, J. Rijmenants, E. A. Vittoz, and H. 1. DeMan, "Adaptive Biasing CMOS Amplifiers," IEEE Journal of Solid-State Circuits, Vol. SC-17, No.3, pp. 522-528, June 1982.
[6]
E. A. Vittoz, "Micropower Techniques," Chapter 3 in J. E. Franca and Y. Tsividis (eds.) Design of Analog-Digital VLSI Circuits for Telecommunications and Signal Processing, 2nd ed., Prentice Hall, 1994. ISBN 0-13-203639-8.
[7]
S. Soclof, Applications of Analog Integrated Circuits, Prentice Hall, 1985. ISBN 0-13-039173-5.
[8]
M. Ismail, S-c. Huang, and S. Sakurai, "Continuous-Time Signal Processing," Chapter 3 in M. Ismail and T. Fiez (eds.), Analog VLSI: Signal and Information Processing, McGraw Hill, 1994. ISBN 0-07-032386-0.
[9]
B-S. Song, "CMOS RF Circuits for Data Communications Applications," IEEE Journal of Solid-State Circuits, Vol. SC-21, No.2, pp. 310-317, April 1986.
[10]
1. Crols and M. S. J. Steyaert, "A 1.5 GHz Highly Linear CMOS Downconversion Mixer," IEEE Journal of Solid-State Circuits, Vol. 30, No.7, pp. 736-742, July 1995.
[11]
R. Gregorian and G. C. Ternes, Analog MOS Integrated Circuits for Signal Processing, John Wiley and Sons, 1986. ISBN 0-471-09797-7.
[12]
H-J. Song and C-K. Kim, "An MOS Four-Quadrant Analog Multiplier Using Simple Two-Input Squaring Circuits with Source Followers," IEEE Journal of Solid-State Circuits, Vol. 25, No.3, pp. 841-848, June 1990.
PROBLEMS 26.1
A very important component of a comparator is its offset voltage. The offset voltage of a comparator can be modeled as a DC voltage source in series with the gate of the MOSFET used in the input diff-pair (Fig. P26.l). Regenerate Fig. 26.6, including an offset voltage of 10 mV. Comment on the effects of an offset voltage on this plot.
Figure P26.1
718
Part IV Mixed-Signal Circuits
26.2
What is the input capacitance of the comparator shown in Fig. 26.11? How is the gain of the comparator affected by using a decision circuit with hysteresis?
26.3
Design and simulate the operation of a comparator with 100 mV hysteresis.
26.4
To determine the sensitivity of a comparator, the amplitude of a wide-input pulse is reduced until the output of the comparator does not make a full logic transition. Determine the minimum sensitivity of the comparator of Fig. 26.11 using SPICE. Note: In practice, making sensitivity measurements is very difficult. The comparator will oscillate, and coupled noise will affect the measurement.
26.5
Simulate the operation of the comparator shown in Fig. 26.18.
26.6
Discuss the benefits and problems of using the output buffer shown in Fig. P26.6 in conjunction with the preamp and decision circuit of Fig. 26.5. VDD
'----Vout
Output buffer
Figure P26.6
26.7
Can the self-biased comparator be used as a wide-swing op-amp? If so, how would the op-amp be compensated?
26.8
Sketch the schematic of an adaptive voltage follower that can source or sink current.
26.9
Discuss the benefits and problems of using long channel lengths in the multiplying quad of Fig. 26.30.
26.10 Verify, using SPICE and the differential input/output model shown in Fig. 26.29, the operation of the converters shown in Fig. 26.33. Apply sine waves to the inputs and perform a SPICE transient analysis. 26.11 Design and simulate the operation of a level-shifting circuit that will shift input signals referenced at ground up nominally 1.5 V. Comment on the frequency response of your design.
Chapter
27 Dynamic Analog Circuits
Chapter 14 discussed dynamic digital circuits, which are useful in reducing power dissipation and the number of MOSFETs used to perform a given circuit operation. Dynamic analog circuits exploit the fact that information can be stored on a capacitor or gate capacitance of a MOSFET for a period of time. In this chapter, we will discuss analog circuits such as sample and holds, current mirrors, amplifiers, and filters using dynamic techniques.
27.1 The MOSFET Switch A fundamental component of any dynamic circuit (analog or digital) is the switch (Fig. 27.1). An important attribute of the switch, in CMOS is that under DC conditions the gate of the MOSFET does not draw a current. Therefore, neglecting capacitances from the gate to the drain/source, we find that the gate control signal does not interfere with information being passed through the switch. Figure 27.2 shows the small-signal resistance of the switches of Fig. 27.1 plotted against drain-source voltage. The benefits of using the CMOS transmission gate are seen from this figure, namely, lower overall resistance. Another benefit of using the CMOS TG is that it can pass a logic high or a
~-
Switch Figure 27.1 MOSFETs used as switches.
720
Part IV Mixed-Signal Circuits
-f---f----+----+---+---+-----+ V DS 2
3
4
5
Figure 27.2 Small-signal on-resistance of MOSFET switches [1].
logic low without a threshold voltage drop. The largest voltage an n-channel switch can pass is VDD - VTHN, while the lowest voltage a p-channel switch can pass is VTHP" While MOS switches may offer substantial benefits, they are not without some detraction. Two nonideal effects typically associated with these switches may ultimately limit the use of MOS switches in some applications (particularly sampled-data circuits such as data converters). These two effects are known as charge injection and clock feedthrough. Charge Injection
Charge injection can be understood with the help of Fig. 27.3. When the MOSFET switch is on and VDS is small, the charge under the gate oxide resulting from the inverted channel is (from Ch. 5) Q'ch' When the MOSFET turns off, this charge is injected onto the capacitor and into Via' Since Via is assumed to be a low-impedance, source-driven node, the injected charge has no effect on this node. However, the charge injected onto Cloud results in a change in voltage across it.
+ Vlaad
Figure 27.3 Simple configuration using an NMOS switch to show charge injection.
721
Chapter 27 Dynamic Analog Circuits
Although the charge injection mechanism is itself a complex one, many studies have sought to characterize and minimize its effects [2-4]. It has been shown, that if the clock signal turns off fast, the channel charge distributes fairly equally between the adjacent nodes. Thus, half of the channel charge is distributed onto Cloud' From Ch. 5, the charge/unit area of an inverted channel can be approximated as Qj(y) = C~x' (VGS - VTHN)
(27.1)
The total charge in the channel must then be multiplied by the area of the channel resulting in Q[(y) = C~x' W· L· (VGS- VTHN)
Therefore, the change in voltage across
C lond
(27.2)
(if an NMOS switch is used) is
C~x' W· L· (VGS - VTHN)
2C
/).Vload=-
(27.3)
load
which can be written as /).Vload
=-
C~x'
W· L· (VDD-Vin - VTHN) 2C
(27.4)
load
if it is assumed that the clock swings between VDD and Vss' The threshold voltage can also be substituted into Eq. (27.4) to form /).Vload
=
C~x' W·
L· (VDD -Vin - [VTHNO +'Y-------- Vaut
+ (b)
Figure 27.20 Lossy integrator (a) switched-capacitor implementation and (b) continuous time circuit.
\ ,
)
,
Hz
5005kHz Figure Ex27.2
fp =
1
1
(C2 I) = 500 andfz = 21t (Ct_ . -I) = 5 kHz 21t - . C4
felk
If we setfclk to 100 kHz and 3.2pF. •
=
C3
felk
C4 to 100 fF, then C3 = 1.0 pF, C2 = 3.2 pF, and Ct
736
Part IV Mixed-Signal Circuits
We will now develop an exact relationship between the switching frequency, fclk' and the signal frequency 0) [12,13]. Referring to Fig. 27.21, we can write the output of the integrator as the sum of the previous output voltage, vout(n)' at a time nT and the contribution from the current sample as C/
v out(n+l ) = Vout(n) + CF . Vin(n)
(27.21)
Since a delay in the time domain of T corresponds to a phase shift of O)T in the frequency domain, we can take the Fourier transform of this equation and get e jroTVout ( j0))
_ Vout ( j0))
-
C/ . Vin ( j0)) + CF
(27.22)
Solving this equation for «Jv: gives Vout . V;;(j0))
=
C/( I ) CF d roT -1
where z = e jroT . Remembering fclk
C/(
= CF
jroT 2
e- / ) ejroT/2 _ e-jroT/2
C/[ 1 ] z-l
= CF
(27.23)
= liT and 0) = 2rcf, we get
VO,ut(jO)) Vm
=
(cc, 1) [~~ .
1 jO) 2 . _ tclk
.e-fttfttclk)
(27.24)
1tf Sin,
Jell
Ideally, the term on the right in parentheses is unity. This occurs when f is much less than felk' This equation describes how the magnitude and phase of the integrator are affected by finite fc/k'
Capacitor Layout An important step in the implementation of any switched-capacitor design is the layout of the capacitors. Normally, a unit size capacitor is laid out and then replicated to the desired capacitance. For the previous example, the unit size capacitance would be nominally 100-fF; see Fig. 27.22 (Fig. 7.1 O)'. Again, the absolute value of the capacitors isn't important; rather, the important value is the ratio. A total of 32 of these unit size capacitors would be used to achieve the larger nominally 3.2 pF capacitors in the previous example (see Fig. 27.23). Using this approach eliminates errors due to uneven patterning of poly to a first order. A p+ guard ring is placed around the capacitor to help reduce coupled substrate noise. Substrate noise can also be reduced by laying the capacitor out over an n-well that is tied to VDD. Injected minority carriers are collected either by the p+ or the n-well (or a combination of both). If matching of the capacitors is critical, schemes that use a common-centroid layout can be used. Also, as was discussed in Ch. 20, dummy poly strips or capacitors can be placed around the array of capacitors so that the edge differences from underetching poly are eliminated. 1 Note that here we are assuming that a circle can be accurately reproduced on the reticle and patterned on the wafer. In practice, effects such as the finite e-beam size (and the granularity of the grid) used to make the reticle can make this assumption questionable.
Chapter 27 Dynamic Analog Circuits
737
Vin >---",--_Vout
1
~--- Portion
of an input sine wave at frequency f
Vin
Vin(n)-
VA
.,.
V out(n+1}
t· AVout=Vout(n+1)-Vout(n) = ~IF -Vin(n) 4-.
Vout(n)· Vout
-1r---1r---~---+----------+
N+l
N
nT
time
(n+l)T
Figure 27.21 Switched-capacitor integrator used to determine the relationship between input frequency and switch clock frequency.
738
Part IV Mixed-Signal Circuits
~pOlyl
(a) Contact over thin oxide allowed
(b) Contact over thin oxide not allowed
Figure 27.22 Layout of a nominally 100 tF capacitor unit cell.
P la te (pol 2)
Plate (polId1) Figure 27.23 Layout of a 3.2 pF capacitor using a 100 tF unit cell.
Chapter 27 Dynamic Analog Circuits
739
Implementing Ladder Filters
Consider the ladder low-pass filter shown in Fig. 27.24. The doubly terminated structure is used to reduce sensitivity to component variations [14]. The resistors R] and R, will be implemented using switched-capacitor techniques along with the inductor and capacitors shown in the schematic. With regard to the notation shown in the figure, the voltage across L 3 and the current through L 3 are labeled v3 (= v2 - v4 ) and i 3 ' respectively. Also, we will define the product of the current through the inductor with a scaling resistance, R, (normally R, = 1 Q) as the inductor scaled voltage. This can be written for L 3 as ,
.
v3 = 13'
R
(27.25)
s
For the capacitor C2 in Fig. 27.24, we can write V2
i2
1 (.
.)
=jmC2 = j mC2 11-13
vs
(27.26)
= jmC2 RI
which results in a summing integrator, that is, C2 is replaced with a switched-capacitor summing integrator (see Fig. 27.25a). The value of the capacitors in this figure is determined using (27.27) (27.28) For the inductor L 3 we can write ,
v3
' V2 =R s ' 13 = . L IR Jm 3 s
(27.29)
This is again a summing integrator (see Fig. 27.25b). The value of the components in this figure are determined by solving
L3 C 1 - = -n . -
s,
C31
(27.30)
fclk
Vaut
Vs
Rs
Figure 27.24 Doubly terminated low-pass ladder filter.
740
Part IV Mixed-Signal Circuits
Cn
>--+---V2
V2
~ l:: 0
.~ N ';j
~ ;:l 0
Figure 28.4 Quantization levels overlap actual temperature by ± '12 "F.
28.3 Sample-and-Hold (S/H) Characteristics Sample-and-hold (SIH) circuits are critical in converting analog signals to digital signals. The behavior of the S/H is analogous to that of a camera. Its main function is to "take a picture" of the analog signal and hold its value until the ADC can process the information. It is important to characterize the S/H circuit when performing data conversion. Ignoring this component can result in serious error, for both speed and accuracy can be limited by the S/H. Ideally, the S/H circuit should have an output similar to that shown in Fig. 28.5a. Here, the analog signal is instantly captured and held until the next sampling period. However, a finite amount of time is required for the sampling to occur. During the sampling period, the analog signal may continue to vary; thus, another type of circuit is called a track-and-hold, or T/H. Here, the analog signal is "tracked" during the time required to sample the signal, as seen in Fig. 28.5b. It can be seen that SIH circuits operate in both static (hold mode) and dynamic (sample mode) circumstances. Thus, characterization of the S/H will be discussed in the context of these two categories. Figure 28.6 presents a summary of the major errors associated with a SIH [1-5]. A discussion of each error follows.
760
Part IV Mixed-Signal Circuits
Analog signal
\
Analog signal SIH output
SIH output
/'
/' -
,
-....,..;
sarr: mode (a)
'Hold mode (b)
Figure 28.5 The output of (a) an ideal SIH circuit and (b) a track-and-hold (TIH).
Sample Mode Once the sampling command has been issued, the time required for the S/H to track the analog signal to within a specified tolerance is known as acquisition time. In the worst-case scenario, the analog signal would vary from zero volts to its maximum value, v1N(max)" And the worst-case acquisition time would correspond to the time required for the output to transition from zero to v1N(max)" Since most SIH circuits use amplifiers as buffers (as seen in Fig. 28.7), it should be obvious that the acquisition will be a function of the amplifier's own specifications. For example, notice that if the input changes very quickly, then the output of the TIH could be limited by the amplifier's slew rate. The amplifier's stability is also extremely critical. If the amplifier is not compensated correctly, and the phase margin is too small, then a large overshoot will occur which requires a longer settling time for the SIH to settle within the specified tolerance. The error tolerance at the output of the SIH is also dependent on the amplifier's offset, gain
Overshoot and settling time
v
~
VIN(max)
\
SIH output within specified Droop tolerance and feedthrough
~
i Pedestal error .
"
- - - - - V/N
- - - vOUT
Output slewing 1
.
(b)
0 H+-h,L---"--h=1
Since the INL is simply the actual output current minus the ideal, the worst-case INL will be (29.20) The term, IMlmax,lNL represents the maximum current source mismatch error that will keep the INL less than 'h LSB. Each current source represents the value of 1 LSB; therefore, Y2 LSB is equal to 0.5 I. Since the maximum INL should correspond to the Y2 LSB, equating Eq. (29.20) to 'h I results in the value for IMlmax,lNL>
IMImax,INL --
0.51 -
2N-I -
L 2N
(2921) .
Equation (29.21) illustrates the difficulty of using this architecture at high resolutions. If the value of I is set to be 5 JlA, and the N is desired to be 12 bits, then the value of M max,lNL becomes IM Imax,lNL -- 5 x2 1O--{j 12
, 1.221 nA.
(29.22)
which means that each of the 5 JlA current sources must lie between the bounds of, 4.99878
~
s t, s 5.001221 JlA
(29.23)
to achieve a worst-case INL, which is within 'h LSB error. The DNL is easily obtained since the step height in the transfer curve is equivalent to the value of the ideal current source, I. The maximum difference between any two adjacent values of output current will be simply the value of the single source, I k , which contains the largest mismatch error for which the DNL will be less than 'h LSB, IMlmax,DNL: IOUI(x) - louI(x-1) =
h + IMlmax,DNL
(29.24)
Therefore, the DNL is simply IDNLl max =h + IMlmaxDNL -t, = ,
IMlmaxDNL ,
(29.25)
Equating the maximum DNL to the value of 1/2 LSB,
IMI max,DNL = t LSB = t I
(29.26)
804
Part IV Mixed-Signal Circuits
which is much easier to attain than the requirement for the INL. For the binary-weighted current sources seen in Fig. 29.10, a slightly different analysis is needed to determine the requirements for INL and DNL. In this case, it will be assumed that the current source corresponding to the MSB (D N • 1) has a maximum positive mismatch error value and the remainder of the bits (Do to DN•2 ) contain a maximum negative mismatch error, so that the sum of all the errors equals zero. Therefore, the INL is (29.27) IINLl max = 2 N-1(/ + IMlmax,lNL) - 2 N-1 • 1= 2 N-1 . IMlmax,lNL which is equivalent to the value of the current steering array in Fig. 29.9. The DNL is slightly different because of the binary weighting of the current sources. One cannot add a single current source with each incremental increase in the digital input code. However, the worst-case condition for binary-weighted arrays tends to occur at midscale when the code transitions from 011111....111 to 100000 ....000. The worst-case DNL at this point is N-l
DNL max = [ 2 N-1 . (I + ILVI max,DNL)- L. 2 k-l
.
(I-IMI max,DNL)
]
- I
(29.28)
bl
which can be written as DNL max = 2 N-1 • (/ + IMlmax,DNL) _(2 N-1 - 1) . (/ -IMlmax,DNL) -I = (2 N -1) ·IMlmax,DNL (29.29) and setting this value equal to Y2 LSB and solving for M max,
IMImax,DNL --
0.51 _
I
2N _ 1 - 2N+1
-
2
(29.30)
Therefore, the DNL requirements for the binary-weighted current source array is more stringent than the INL requirements. One interesting issue regarding the previous derivation is that the challenging accuracy requirements in Eq. (29.30) are placed only on the MSB current source. For each of the remaining binary-weighted sources, the DNL requirements become more relaxed. This is simply because the size of the MSB source is equivalent to all the other sources combined, and so its value plays the most important role in the DAC's accuracy. Example 29.5 Determine the tolerance of the MSB current source on a lO-bit binary-weighted current source array with a unit current source of 1 J..LA, which will result in a worst-case DNL that is less than Y2 LSB. Since Eq. (29.30) defines the maximum 1M! needed to keep the DNL less than Y2 LSB, we must first use this equation,
Chapter 29 Data Converter Architectures
IAIImax,DNL =
805 I X io11 = 0.4888 nA 2-2
For a 10-bit DAC, the MSB current source will have a value that is 2 9 times larger than the unit current source, or 0.512 rnA. Therefore, the range of values for which this array will have a DNL that is less than Y2 LSB is 0.51199995 rnA ~ I M SB s 0.5120004888 rnA •
29.1.5 Charge Scaling DACs A very popular DAC architecture used in CMOS technology is the charge scaling DAC. Shown in Fig. 29.12a, a parallel array of binary-weighted capacitors, totaling 2NC, is connected to an op-amp. The value, C, is a unit capacitance of any value. After initially being discharged, the digital signal switches each capacitor to either VREF or ground, causing the output voltage, v OUT' to be a function of the voltage division between the capacitors. Since the capacitor array totals 2NC, if the MSB is high and the remaining bits are low, then a voltage divider occurs between the MSB capacitor and the rest of the array. The analog output voltage, V OUT' becomes VOUT
= V REF
·
2 N - 1C 2 N - 1C VREF = V REF · -NC - =-(2N-l+2N-2+2N-3+ ... +4+2+1+I)C 2 2
(29.31) which confirms the fact that the MSB changes the output of a DAC by Y2 VREF • Figure 29.12b shows the equivalent circuit under this condition. The ratio between vOUT and VREF due to each capacitor can be generalized to k
VOUT
2 C V REF = 2 k- N . V REF = -;;-.
2 C
(29.32)
where it is assumed that the k-th bit, D k , is I and all other bits are zero. Superposition can then be used to find the value of v OUT for any digital input word by N-I
VOUT
=L. Dk2k-N . VREF
(29.33)
io=O
One limitation of this architecture as shown in Fig. 29.12a is the existence of a parasitic capacitance at the top plate of the capacitor array due to the op-amp. This will prohibit its use as a high-resolution data converter. A better implementation would include the use of a parasitic insensitive, switched-capacitor integrator (see Ch. 27) as the driving circuit. However, the capacitor array itself is the critical component of this data converter and is used in charge redistribution ADCs (Sec. 29.2.5). The INL and DNL calculations for the binary-weighted capacitor array are identical to those for the binary-weighted current source array, except the unit current source, I, and its corresponding error term, M, are replaced by C and ~C in Eqs. (29.27) - (29.30).
806
Part IV Mixed-Signal Circuits
R""Lt:t2~'?4C :CC I. T C
C
VOUT
L"~
VREF
Do (a)
(b)
Figure 29.12 (a) A charge scaling DAC, (b) the equivalent circuit with the MSB = 1, and all other bits set to zero.
Example 29.6 Design a 3-bit charge scaling DAC and find the value of the output voltage for DPPo= 010 and 101. Assume that VREF =5 V and C =0.5 pF. The 3-bit DAC can be seen in Fig. 29.13a. The equivalent circuits for the capacitor array can be seen in Fig. 29.13b and c. The value of the output voltage can be calculated by either using Eq. (29.32) or the equivalent circuits and performing the voltage division. For D =010, the equivalent circuit in Fig. 29.13b yields VOUT
=
VREF'
1 ('4) = 1.25 V
Using Eq. (29.33) to calculate V OUT for D = 101 yields VOUT
=~ Dk2k- N . VREF = [1· (2-3)+0. (2- 2)+ 1· (2- 1)].5 = (t+!)· 5 = 3.125 V k=O
which is the result expected. • Layout Considerations for a Binary-Weighted Capacitor Array
One problem with this converter is the need for precisely ratioed capacitors. As the number of bits increase, the ratio of the MSB capacitor to the LSB capacitor becomes more difficult to control. For example, Fig. 29.14a shows a 3-bit binary capacitor array
Chapter 29 Data Converter Architectures
807
VOUT
5V
1 pF _
2.5 pF
5V-1~VOUT ~3PF
5V-1~VOUT
(b)
(c)
~ 1.5 pF
Figure 29.13 (a) A 3-bit charge scaling DAC used in Ex. 29.6 and the equivalent circuits inputs equal to (b) 010 (c) 101.
using three capacitors. When the capacitor is fabricated, undercutting of the mask [2, 3] will cause an error in the ratio of the capacitors, causing potentially large DNL and INL errors as N increases. One solution to this problem is seen in Fig. 20.14b. Here, each capacitor in the array is constructed out of a unit capacitance. Undercutting then affects all the capacitors in the same way, and the ratio between capacitors is maintained. Another problem that affects even this layout strategy is a nonuniform oxide growth. Gradient errors will result in errors in the ratios of the capacitors. Figure 29.14c illustrates another layout strategy that overcomes this issue. The capacitors are laid out in a common-centroid scheme so that the first-order oxide errors average out to be the same for each capacitor. The Split Array
The charge scaling architecture is very popular among CMOS designers because of its simplicity and relatively good accuracy. Although a linear capacitor is required using poly2, high resolutions in the 10 to 12-bit range can be achieved. Passive, double-poly capacitors have good matching accuracy as well. However, as the resolution increases, the size of the MSB capacitor becomes a major concern. For example if the unit capacitor, C, was chosen to be 0.5 pF, and a 16-bit DAC was to be designed, the MSB capacitor would need to be C MSB = 2 N- 1 ·0.5 pF= 16.384 nF
(29.34)
Based on our 2 urn process parameters, the capacitance between polyl and poly2 is nominally 500 aF/llm2. Therefore, the area required for this one capacitor is over 30 million square microns!
808
Part IV Mixed-Signal Circuits
Undercutting
cp-EJ[] 00[1]0 2C
4C (a)
4C
C
4C
'1 -============) (c)
2C
C
(b)
Nonuniform
~ oxide gradient
x
Figure 29.14 Layout of a binary-weighted capacitorarray using (a) single capacitors (b) unit capacitors to minimize undercutting effect, and (c) commoncentroid to minimize oxide gradients.
One method to reduce the size of the capacitors is to use a split array. A 6-bit example of the array is pictured in Fig. 29.15. This architecture [1] is slightly different from the charge scaling DAC pictured in Fig. 29.13 in that the output is taken off a different node and an additional attenuation capacitor is used to separate the array into a LSB array and a MSB array. Note that the LSB, Do, now correponds to the leftmost switch and that the MSB, D s' corresponds to the rightmost switch. The value of the attenuation capacitor can be found by
C atten
- sum of the LSB array capacitors . C . sum of the MSB array capacitors
(29.35)
where the sum of the MSB array is equal to the sum of LSB capacitor array minus C. The value of the attenuation capacitor should be such that the series combination of the attenuation capacitor and the LSB array, assuming all bits are zero, is equal to C. Example 29.7 Using the 6-bit charge scaling DAC shown in Fig. 29.15, (a) show that the output voltage will be ~. VREF if (a) DpPPPPo = 100000 and (b) the output VREF if DPPPPPo = 000001. will be
i4 .
Chapter 29 Data Converter Architectures
809
Attenuation capacitor
\~C
R:;LI
vOUT
C
Do
D]
Ds
LSB array
MSB array
Figure 29.15 A charge scaling DAC using a split array.
(a) If D, = 1 and the remaining bits are all zero, then the equivalent circuit for the DAC can be represented by Fig. 29.16a. The expression for the output voltage then becomes
v OUT =
4
(~118) +3 +4
. V REF =1.
V REF
2
(b) For the second case, the equivalent circuit can be seen in Fig. 29.16b. The intermediate node voltage, VA' is simply the voltage division between C and the remainder of the circuit, or VA
= VREF'
(
1 1 Jl.7) = --5-6 . VREF 7+_ +1 8+5]
(29.36)
7_
~+7
The output voltage can be written as 8
VOUT= VA'
.§.+7
8 57
_7_=_. VA 7
(29.37)
(b)
Figure 29.16 Equivalent circuits for Example 29.7.
810
Part IV Mixed-Signal Circuits Plugging Eq. (29.36) into Eq. (29.37) yields
8
VOUT
(29.38)
= VREF· (8.57) + 56
which is the desired result. •
29.1.6 Cyclic DAC The cyclic DAC uses only a couple of simple components to perform the conversion. As seen in Fig. 29.17, a summer adds VREF or ground to the feedback signal depending on the input bits. An amplifier with a gain of 0.5 feeds the output voltage back to the summer such that the output at the end of each cycle is dependent on the value of the output during the cycle before. Notice that the input bits must be read in a serial fashion. Therefore, the conversion is performed one bit at a time, resulting in N cycles required for each conversion. The voltage output at the end of the n-th cycle of the conversion can be written as VOUT(n) = (Dn-l . VREF
+
!. -1») .!
(29.39)
vA(n
with a condition such that the output of the SIR is initially zero [vA(O)
=0 V].
The accuracy of this converter is dependent on several factors. The gain of the 0.5 amplifier needs to be highly accurate (to within the accuracy of the DAC) and is usually generated with passive capacitors. Similiarly, the summer and the sample-and-hold also need to be N-bit accurate. Limitations of the converter due to these fundamental building blocks will be discussed in more detail in Sec. 29.3. Since this converter uses a pseudo-"sampled-data" approach, implementing this architecture using switched capacitors is relatively easy. D N- t D N- 2 D2 D[
Parallelto-serial converter
DO-L.-_ _---'
Figure 29.17 A cyclic digital-to-analog converter.
Chapter 29 Data Converter Architectures
811
Example 29.8 Show the value of the output voltage at the end of each cycle for a 6-bit cyclic DAC with an input value of D sD4D3D2Dpo= 110101. Assume that VR EF= 5 V. We can predict the value of the output based on our previous experience with DACs. The digital input 110101 corresponds to 5310 , Therefore, the output voltage due to this input should be VOUT
53 = 64 . VREF = 4.140625 V
Now examine the cyclic converter in Fig. 29.17. By performing a 6-bit conversion and using Eq. (29.39), the outputs occurring at the end of each cycle can be seen in Fig. 29.18. The output voltage at the end of the sixth cycle is precisely what was predicted. Note that had this been a 3-bit conversion, the output voltage at the end of cycle 3 would correspond to the value of the 3-bit DACs studied previously with an input of 101. • Cycle Number, n
»:
vin-l)
vouln)
1
1
0
Y2 (5 + 0) = 2.5 V
2
0
5
Y2 (0 + 2.5) = 1.25 V
3
1
2.5
Y2 (5 +1.25) = 3.125 V
4
0
6.25
Y2 (0 + 3.125) = 1.5625 V
5
1
3.125
Y2 (5 + 1.5625) = 3.28125 V
6
1
6.5625
Y2 (5 + 3.28125) = 4.140625 V
Figure 29.18 Output from the 6-bit cyclic DAC used in Ex. 29.8.
29.1.7 Pipeline DAC The cyclic converter presented in the last section takes N clock cycles per N-bit conversion. Instead of recycling the output back to the input each time, we could extend the cyclic converter to N stages, where each stage performs one bit of the conversion. This extension of the cyclic converter is called a pipeline DAC and is seen in Fig. 29.19. Here, the signal is passed down the "pipeline," and as each stage works on one conversion, the previous stage can begin processing another. Therefore, an initial N clock cycle delay is experienced as the signal makes its way down the pipeline the very first time. However, after the N clock cycle delay, a conversion takes place at every clock cycle. Besides the N clock cycle delay, this architecture can be very fast. However, the amplifier gains must be very accurate to produce high resolutions. Also, this
812
Part IV Mixed-Signal Circuits
VOUT(n)
Figure 29.19 A pipeline digital-to-analog converter.
architecture uses N times more circuitry than that of the cyclic, so there is a tradeoff between speed and chip area. The output voltage of the n-th stage in the converter can be written as VOUT(n)
= [D n- 1 • VREF + VOUT(n-l)]
•
2"1
(29.40)
The operation of each stage in the pipeline can be summarized as follows: if the input bit is aI, add VREF to the output of the previous stage, divide by two, and pass the value to the next stage. If the input bit is a 0, simply divide the output of the previous stage by two and pass along the resulting value. Example 29.9 Find the output voltage for a 3-bit pipeline DAC for three cases: DA = 001, DB =110, and D; = 101 and show that the conversion time to perform all three conversions is five clock cycles using the pipeline approach. Assume that VREF = 5 V. The first stage will operate on the LSBs of each word; the second stage will operate on the middle bits; and the last stage, the MSBs. Based on the pipeline strategy, once the LSB of the first input word is performed and passed on, the LSB of the second word, DB' can begin its conversion. Similarly, once the LSB of the second stage is completed and passed on, the LSB of the third word, Dc ' can begin. The conversion cycle for all three input words will produce the output shown in Fig. 29.20. The items that are in bold are associated with the first input word, DA , whereas the italicized numbers represent the values associated with DB and the underlined items, Dc. The first output of the DAC is not valid until the end of the third clock cycle and should look familiar as the 3-bit DAC output for an input word of D2Dpo =001. The following two clock cycles that produce outputs for D2Dpo equal 110 and 101, respectively. •
Chapter 29 Data Converter Architectures
Clock Cycle
813
D1
D2
0
0
I
2.5
0
0
Do 1
2
0
1.25
0
0
0
0
3
2.5
2.5
0.625
1
J
0
1.25
3.75
Q
J
VOUT(1)
4
V OUJ(2)
V OUJ(3)
3.125
5
1
Figure 29.20 Output from the 3-bit pipeline DAC used in Example 29.9.
29.2 ADe Architectures A survey of the field of current AID converter research reveals that a majority of effort has been directed to four different types of architectures: pipeline, flash-type, successive approximation, and oversampled ADCs. Each has benefits that are unique to that architecture and span the spectrum of high speed and resolution. Since the ADC has a continuous, infinite-valued signal as its input, the important analog points on the transfer curve x-axis for an ADC are the ones that correspond to changes in the digital output word. These input transitions determine the amount of INL and DNL associated with the converter.
29.2.1 Flash Flash or parallel converters have the highest speed of any type of ADC. As seen in Fig. 29.21, they utilize one comparator per quantization level (2N - 1) and 2N resistors (a resistor string DAC). The reference voltage is divided into 2N values, each of which is fed into a comparator. The input voltage is compared with each reference value and results in a thermometer code at the output of the comparators. A thermometer code will exhibit all zeros for each resistor level if the value of VIN is less than the value on the resistor string, and ones if V IN is greater than or equal to voltage on the resistor string. A simple 2N - l:N digital thermometer decoder circuit converts the compared data into an N-bit digital word. The obvious advantage of this converter is the speed with which one conversion can take place. Each clock pulse generates an output digital word. The advantage of having high speed, however, is counterbalanced by the doubling of area with each bit of increased resolution. For example, an 8-bit converter requires 255 comparators, but a 9-bit ADC requires 511! Flash converters have traditionally been limited to 8-bit resolution with conversion speeds of 10 - 40 Ms/s using CMOS technology [4-6]. The disadvantages of the Flash ADC are the area and power requirements of the 2N - 1 comparators. The speed is limited by the switching of the comparators and the digital logic.
814
Part IV Mixed-Signal Circuits
VIN
V REF
R
Thermometer code
~
R D N- 1 D N- 2
R 2N - l :N
Decoder
D2
Digital output
D1 Do
R R
Figure 29.21 Block diagram of a FlashADC.
Example 29.10 Design a 3-bit Flash converter, listing the values of the voltages at each resistor tap, and draw the transfer curve for v/N = 0 to 5 V. Assume VREF = 5 V. Construct a table listing the values of the thermometer code and the output of the decoder for v/N = 1.5,3.0, and 4.5 V.
The 3-bit converter can be seen in Fig. 29.22.
Since the values of all the
resistors are equal, the voltage of each resistor tap, Vj , will be Vj
=V
REF
(t)
where i is the number of the resistor in the string for i = 1 to 7. Obviously, VI = 0.625 V, V2 = 1.25 V, V3 = 1.875 V, V4 = 2.5 V, Vs = 3.125, V6 = 3.75 V, V7 = 4.375 V. Therefore, when v/N first becomes equal or greater than each of these values, a transition will occur in the transfer curve. The transfer curve can be seen in Fig. 29.23 and should look similar to those seen in Ch. 28. The quantization levels and their corresponding thermometer codes can be summarized as seen in Fig. 29.24. The transfer curve of this ADC corresponds to the ADC with quantization error centered about + V2 LSB, as discussed in Ch. 28 (Fig. 28.20). To shift the curve by V2 LSB so that the code transitions occur around the LSB values and the
Chapter 29 Data Converter Architectures
815
VlN
VREF
R
R
R
2N -1: N
Decoder
R
D2 DI Do
R
Figure 29.22 Three-bit Flash AID converter to be used in Ex. 29.10.
quantization error is centered around 0 LSB, the value of the last resistor in the string would have to be adjusted to ~ and the value of the MSB resistor, closest to the reference voltage, would have to be made 1.5R. Then the first code transition would occur at V lN = 0.3125 V, and the last code transition would occur at v lN =4.0625 and so the transfer curve would exactly match that of Fig. 28.20. Based on Fig. 29.24, when vlN = 1.5 V, only comparators CI and C2 will have outputs of 1, since both VI and V2 are less than 1.5 V. The remaining comparator outputs will be 0 since V3 through Vs will be greater than 1.5 V, thus generating the thermometer code, 0000011. The encoder must then convert this into a 3-bit digital word, resulting in 010. The same reasoning can be used to construct the data shown in Fig. 29.25. It should be obvious that if the polarity of the comparators were reversed, the thermometer code would be inverted. •
816
Part IV Mixed-Signal Circuits
Digital
outputcode, D 111 110 101 100 011 010 001 L-.-+-+--+-+--4--+----1f---I-~
v IN
Figure 29.23 Transfer curve for the 3-bit Flash converter in Example 29.10.
C7C6CSC4C3CZCl
DPPo
Os; vIN < 0.625 V
0000000
000
0.625 V S; V IN < 1.25 V
0000001
001
V IN
1.25 V S; vIN < 1.875 V
0000011
010
1.875 V S; vIN < 2.5 V
0000111
011
2.5 V S; V IN < 3.125 V
0001111
100
3.125 V S; V IN < 3.75 V
0011111
101
3.75 V S; V IN < 4.375 V
0111111
110
4.375...s; V IN
1111111
111
Figure 29.24 Code transitions for the Flash ADC used in Ex. 29.10.
Accuracy Issues for the Flash ADC
Accuracy is dependent on the matching of the resistor string and the input offset voltage of the comparators. From Sec. 26.1, we know that an ideal comparator should switch at the point at which the two inputs, v, and v_, are the same potential. However, the offset voltage Vos' prohibits this from occurring as the comparator output switches state as follows: vo = 1
(29.41)
Chapter 29 Data Converter Architectures
817
VIN
C7C6CSC4C3C2Cl
DPPo
1.5
0000011
010
3.0
0001111
100
1111111
111
4.5
Figure 29.25 Output for the Flash ADC usedin Ex. 29.10. vo
=0
when v+ < v, + Vos
(29.42)
The resistor string DAC was analyzed and presented in Sec. 29.1.2; the voltage on the i-th tap of the resistor string was found to be
~ ARk Vi = Vi,ideal + -VREF N-' ~ T
2
(2943) .
k=l
where V"l,t deaI is the voltage at the i-th tap if all the resistors had an ideal value of R. The term, ARk' is the value of the resistance error (difference from ideal) due to the mismatch. Note that for the resistor string DAC, the sum of the mismatch terms plays an important factor in the overall voltage at each tap. The switching point for the i-th comparator, Vsw,i' then becomes Vsw,i = Vi + Vos,i
(29.44)
where Vos,i is the input referred offset voltage of the i-th comparator. The INL for the converter can then be described as INL = Vsw,i - V"w,ideal = Vsw,i - Vi,ideal
(29.45)
which becomes INL = VREF.± ARk + V . 2 N k=l R OS,I
(29.46)
The worst-case INL will occur at the middle of the string (i = 2N• l ) as described in Sec. 29.1.2 and Eq. (29.10). Including the offset voltage, the maximum INL will be
2;1 ARk I I
VREF
2N - 1
IINLlmax=2N'~ T+ Vos,i max = VREF' 2N R ·IARklmax+lvos,dmax (29.47) which can be rewritten as IINLI max = VREF 2 ·IARkl R max +Ivi OS,I max
(29.48)
where it is assumed that the maximum positive mismatch occurs in all the resistors in the lower half of the string and the maximum negative mismatch occurs in the upper
818
Part IV Mixed-Signal Circuits
half (or vice versa) and that the comparator at the i-th tap contains the maximum offset voltage, lVos,;lmax, Notice that the offset contributes directly to the maximum value for the INL This explains another limitation to using Flash converters at high resolutions. The offset voltage alone can make the INL greater than Y2 LSB.
Example 29.11 If a 10-bit Flash converter is designed, determine the maximum offset voltage of
the comparators which will make the INL less than Yz LSB. Assume that the resistor string is perfectly matched and VREF = 5 V. Equation (29.48) requires that the offset voltage be equal to Yz LSB. Therefore,
lVosl max =
-t- = 2
2.44 mV •
The DNL calculation for the Flash converter is also attained using the analysis first presented in Sec. 29.1.2. Using the definition of DNL, DNL =
Vsw,i - Vsw,i-I -
1 LSB (in volts)
(29.49)
1 LSB
(29.50)
Plugging in Eq. (29.44), DNL =
Vi
+ Vos,; -
Vi-I - Vos,i-I -
which can be written by using Eq. (29.6) as DNL =
Vi,ideal- Vi-I,ideal
V REF
ARi
+ 7 ' R + Vos,i
- Vos,i-I -
AR 7VREF . R
Vos,i-I
1 LSB
(29.51)
which becomes DNL =
i
+ Vos,i -
(29.52)
The maximum DNL will occur assuming AR; is at its maximum, Vas,; is at its maximum positive value, and Vos,;_l is at its maximum negative voltage. Thus,
I I
VREF ARi max +2 Iv, Imax IDNL Imax =7' R
(29.53)
which assumes that the maximum offset voltage in the positive and negative directions are symmetrical. Therefore, both resistor string matching and offset voltage affect the DNL of the converter.
29.2.2 The Two-Step Flash ADC Another type of Flash converter is called the two-step Flash converter or a parallel, feed-forward ADC [7-10]. The basic block diagram of a two-step converter is seen in Fig. 29.26. The converter is separated into two complete Flash ADCs with feed-forward circuitry. The first converter generates a rough estimate of the value of the input, and the second converter performs a fine conversion. The advantages of this architecture are that the number of comparators is greatly reduced from that of the Flash converter -
Chapter 29 Data Converter Architectures
819
VIN
LSB ADC
MSB ADC
MSBs
LSBs
Latches
D N- 1 D N- 2 D 2 D 1 Do
Digital output
Figure 29.26 Block diagram of a two-step Flash ADC.
from 2 - 1 comparators to 2(2 N12 - 1) comparators. For example, an 8-bit Flash converter requires 255 comparators, while the two-step Flash requires only 30. The tradeoff is that the conversion process takes two steps instead of one, with the speed limited by the bandwidth and settling time required by the residue amplifier and the summer. The conversion process is as follows: N
1. After the input is sampled, the most significant bits (MSBs) are converted by the first Flash ADC. 2. The result is then converted back to an analog voltage with the DAC and subtracted with the original input. 3. The result of the subtraction, known as the residue, is then multiplied by 2N12 and input into the second ADC. The multiplication not only allows the two ADCs to be identical, but also increases the quantum level of the signal input into the second ADC. 4. The second ADC produces the least significant bits through a Flash conversion. Some architectures use the same set of comparators in order to perform both steps. The multiplication mentioned in step 3 can be eliminated if the second converter is designed to handle very small input signals. The accuracy of the two-step ADC is dependent primarily on the linearity of the first ADC. Figure 29.27 illustrates the two-step nature of the converter. A more intuitive approach can be explained with this picture. The first conversion identifies the segment in which the analog voltage resides. This is also known as a coarse conversion of the MSBs. The results of the coarse conversion are then multiplied by 2N12 so that the segment within which VIN resides will be scaled to the same reference as the first
820
Part IV Mixed-Signal Circuits
conversion. The second conversion is known as the fine conversion and will generate the final LSBs using the same Flash approach. One can see why the accuracy of the first converter is so important. If the input value is close to the boundary between two coarse segments and the first ADC is unable to choose the correct coarse segment, then the second conversion will be completely erroneous. The following example further illustrates the two-step algorithm.
VR EF
VREF II
II--p--
10
me 10 --mnversion
01
01
00
00
VlN - - - - .
Figure 29.27 Coarse and fine conversions using a two-step ADC.
Example 29.12 Assume that the two-step ADC shown in Fig. 29.26 has four bits of resolution. Make a table listing the MSBs, Vi' Vz, V3 , and the LSBs for V1N = 2, 4, 9, and 15 V assuming that VR EF = 16 V. Since VRE F was conveniently made 16 V, each LSB will be 1 V. If V1N =2 V, the output of the first 2-bit Flash converter will be 00 since VR EF = 16 V and each resistor drops 4 V. The output of the 2-bit DAC, Vi' will therefore be 0, resulting in Vz = 2 V. The multiplication of Vz by the 4 results in V3 = 8 V. Remember that each 2-bit Flash converter resembles that of Fig. 29.21. The thermometer code from the second Flash converter will be 0011, which results in 10 as the LSBs. The other values can be calculated as seen in Fig. 29.28. • V1N
2
4 9 15
Dpo (LSBs)
DPz (MSBs) VI 00 0 01 4
Vz 2
8
10
o
o
00
10
8
1
4
01
11
12
3
12
11
V3
Figure 29.28 Outputfor the FlashADC used in Ex. 29.12.
Accuracy Issues Related to the Two-Step Flash Converters
As stated previously, the overall accuracy of the converter is dependent on the first ADC. The second Flash must have only the accuracy of a stand-alone Flash converter. This means that if an 8-bit two-step Flash converter contains two 4-bit Flash converters, the second Flash needs only to have the resolution of a 4-bit Flash, which is not difficult
Chapter 29 Data Converter Architectures
821
to achieve. However, the first 4-bit Flash must have the accuracy of an 8-bit Flash, meaning that the worst-case INL and DNL for the first bit Flash must be less than ±V2 LSB for an 8-bit ADC. Thus, the resistor matching and comparators contained in the first ADC must possess the accuracy of the overall converter. Refer to Sec. 29.2.1 for derivations on INL and DNL for a Flash. The DAC must also be accurate to within the resolution of the ADC. Accuracy Issues Related to the Operational Amplifiers
With the addition of the summer and the amplifier, other sources of accuracy errors are present in this converter. The summer and the amplifier must add and amplify the signal to within ±V2 LSB of the ideal value. It is quite difficult to implement standard operational amplifiers within high-resolution data converters because of these accuracy requirements. The nonideal characteristics of the op-amp are well known and in many cases alone limit the accuracy of the data converter. In this case, the amplifier is required to multiply the residue signal by some factor of two. Although this may not seem difficult at first glance, a closer examination will reveal a dependency on the open-loop gain. Suppose that the amplifier was being used in a 12-bit, two-step data converter. Remember that in order for a data converter to be N-bit accurate, the INL and DNL need to be kept below ±V2 LSB and one-half of an LSB can be defined as 0.5 LSB =
VREF 2N+1
(29.54)
Since the output of the amplifier gets quantized to 6 bits, the amplifier would need to be 6-bit accurate, resulting in an accuracy of 1 Accuracy = 2 6+1
1 = 128 = 0.0078 =0.78%
(29.55)
And suppose that a feedback amplifier with a gain of 64, or 2N12, is used as the residue amplifier. The gain would need to be within the following range: 63.5 VN V 1N , the comparator output is 1, which resets the current SAR bit, D 1, to a Oat the end of period T2. Lastly, the LSB is examined, and V 1N is compared with 5 V. Since V1N > V0 1fT' The comparator output is a 0, and the current SAR bit, Do' remains a 1. The results can be examined in Fig. 29.38a. The final value for DPPo is 101, which is what is expected considering that 101 in binary is equivalent to 5 10 , Figure 29.38b shows the data for the ADC using V 1N = 2.5 V. The final value for v/N = 2.5 is 010, which again is what is expected for 3-bit resolution. • The successive approximation ADC is one of the most popular architectures used today. The simplicity of the design allows for both high speed and high resolution while maintaining relatively small area. The limit to the ADC's accuracy is dependent mainly on the accuracy of the DAC. If the DAC does not produce the correct analog voltage with which to compare the input voltage, the entire converter output will contain an error. Referring again to Fig. 29.37, we can see that if a wrong decision is made early, a massive error will result as the converter attempts to search for the correct quantization level in the wrong half of the binary tree.
Chapter 29 Data Converter Architectures
Step
v/N
T1
5.5
100
100
T2 5.5
010
110
T3 5.5
001
101
B2B1Bo D 2'D1'Do'
835
VOUT
CompOut
DzVPo
a
100
(1/2+1/4)V Ru= 6 V
1
100
(1/2+1/8)V REF= 5 V
a
101
1/2 VRU= 4 V
(a) Step
V 1N
B2B 1Bo D'2D')D'0
VOUT
CompOut
D 2D1Do
2.5
100
100
2.5
010
010
1/2 VREF= 4 V 1/4 VRU= 2 V
a
010
T3 2.5
001
all
(1/4+1/8)VRU = 3 V
1
010
T1
T2
1
000
(b) Figure 29.38 Results from the 3-bit successive approximation ADCusing (a) v/N= 5.5
and (b) 2.5 V.
The Charge-Redistribution Successive Approximation ADC One of the most popular types of successive approximation architectures uses the binary-weighted capacitor array (analyzed in Sec. 29.1.5) as its DAC. Called a charge redistribution successive approximation ADC [2,16,17], this converter samples the input signal and then performs the binary search based on the amount of charge on each of the DAC capacitors. Figure 29.39 shows an N-bit architecture. A comparator has replaced the unity gain buffer used in the DAC architecture. The binary-weighted capacitor array also samples the input voltage, so no external sample-and-hold is needed. The conversion process begins by discharging capacitor array, via the reset switch. Although this may appear to be an insignificant action, the converter is also performing automatic offset cancellation. Once the reset switch is closed, the comparator acts as a unity gain buffer. Thus, the capacitor array charges to the offset
Bitout
Successive approximation register SAR Figure 29.39 A charge redistribution ADC using a binary-weighted capacitor array DAC.
836
Part IV Mixed-Signal Circuits
voltage of the comparator. This requires that the comparator be designed so as to be unity gain stable, which means that internal compensation may have to be switched in during the reset period. Next, the input voltage, V/N' is sampled onto the capacitor array. The reset switch is still closed, for the top plate of the capacitor array needs to be connected to virtual ground of the unity gain buffer. The equivalent circuit is seen in Fig. 29.40a. The reset switch is then opened, and the bottom plates of each capacitor in the array are switched to ground, so that the voltage appearing at the top plate of the array is now Vas - V1N (Fig. 29.40b). The conversion process begins by switching the bottom plate of the MSB capacitor to VREF (Fig. 29.40c). If the output of the comparator is high, the bottom plate of the MSB capacitor remains connected to VR EF • If the comparator output is low, the bottom plate of the MSB is connected back to ground. The output of the comparator is DN _1• The voltage at the top of the capacitor array, VTOP ' is now VREF VTOP =-V/N+ Vas+DN-I' -2-
(29.88)
The next largest capacitor is tested in the same manner as seen in Fig. 29.40d. The voltage at the top plate of the capacitor after the second capacitor is tested becomes VREF VREF VTOP =-V/N+ Vas +D N-1 . -2-+DN-2' -4-
(29.89)
The conversion process continues on with the remaining capacitors so that the voltage on the top plate of the array, VTap, converges to the value of the offset voltage, Vas (within the resolution of the converter), or
(a)
(c)
Figure 29.40 The charge redistribution process: (a) Sampling the input while autozeroing the offset, (b) the voltage at the top plate after sampling, (c) the equivalent circuit while converting the MSB, and (d) the equivalent circuit while converting the next largest capacitor with the MSB result equal to one.
Chapter 29 Data Converter Architectures ~u
837
V~
~u
~u
VTOP = -VlN+ Vas +DN-I . -2-+DN-2' -4-+ .... +DI . 2 N-2 +D o ' 2N- 1
""
Vas (29.90)
Note that the initial charge stored on the capacitor array is now redistributed onto only those capacitors that have their bottom plates connected to VREF • Accuracy Issues Related to the Charge Redistribution Successive Approximation ADC
Obviously, the limitation of this architecture is the capacitor matching. The mismatch is analyzed in the same manner as the binary-weighted current source array of Sec. 29.1.4. Thus, substituting the value of the unit capacitance, C, for the value of the unit current source, I, and using Eqs. (29.27) - (29.30), IINLImax
= 2N- 1 (C + l~cl max.lNd -
2N - 1 . C = 2N- 1 . I~CI max,lNL
(29.91)
where the maximum ~C that will result in an INL that is less than Y2 LSB is O.SC
l~cl max,lNL = 2N-1
C
(29.92)
= 2N
and DNL is defined by DNL max = (2 N -1)· I~Clmax.DNL
with the maximum
~C
(29.93)
which will result in a DNL less than Y2 LSB being
I ~C I max,DNL --
O.SC _
C
2 N -1 - 2N+1 - 2
(29.94)
29.2.6 The Oversampling ADC ADCs can be separated into two categories depending on the rate of sampling. The first category samples the input at the Nyquist rate, or iN = 2F where F is the bandwidth of the signal and iN is the sampling rate. The second type samples the signal at a rate much higher than the signal bandwidth. This type of converter is called an oversampling converter. Traditionally, successive approximation or dual-slope converters are used when high resolution is desired. However, trimming is required when attempting to achieve higher accuracy. Dual-slope converters require high-speed, high-accuracy integrators that are only available using a highj, bipolar process. Having to design a high-precision sample-and-hold is another factor that limits the realization of a high-resolution ADC using these architectures. The oversampling ADC [18-20] is able to achieve much higher resolution than the Nyquist rate converters. This is because digital signal processing techniques are used in place of complex and precise analog components. The accuracy of the converter does not depend on the component matching, precise sample-and-hold circuitry, or trimming, and only a small amount of analog circuitry is required. Switched-capacitor implementations are easily achieved, and, as a result of the high sampling rate, only simplistic anti-aliasing circuitry needs to be used. However, because of the amount of
838
Part IV Mixed-Signal Circuits
time required to sample the input signal, the throughput is considerably less than the Nyquist rate ADCs. Differences in Nyquist Rate and Oversampling ADCs
The typical process used in analog-to-digital conversion is seen in Fig. 29.41a, while the block diagram for the oversampling ADC is seen in Fig. 29.41b. After filtering the signal to help minimize anti-aliasing effects, the signal is sampled, quantized, and encoded or decoded using simple digital logic to provide the digital data in the proper format. When using oversampling ADCs, little if any, anti-alias filtering is needed, no dedicated S/H is required, the quantization is performed with a modulator, and the encoding usually takes the form of a digital filter.
Analog input
Digital output (a)
Analog input
Digital output (b)
Figure 29.41 Typical block diagram for (a) Nyquist rate converters and (b) oversampling ADCs.
Since the oversampling converter samples at many times the signal bandwidth, aliasing is not a serious problem. A discussion of the frequency characteristics of aliasing was presented in Ch. 28. Figure 29.42a shows that when using Nyquist rate converters, a sampled signal in the frequency domain appears as a series of band-limited signals at multiples of the sampling frequency (see Fig. 28.26 for more details). As the sampling frequency decreases, the frequency spectra begin to overlap, and aliasing (Fig. 29.42b) occurs. Complex, "brickwall" filters are needed to correct the problem. For oversampled ADCs, aliasing becomes much less of a factor. Since the sampling rate is much greater than the bandwidth of the signal, the frequency domain representation shows that the spectra are widely spaced, as seen in Fig. 29.42c. Therefore, overlapping of the spectra, and thus aliasing, will not occur, and only simple, first-order filters are required. Oversampling converters typically employ switched-capacitor circuits and therefore do not need sample-and-hold circuits. The output of the modulator is a pulse-density modulated signal that represents the average of the input signal. The modulator is able to construct these pulses in real time, and so it is not necessary to hold the input value and perform the conversion.
Chapter 29 Data Converter Architectures
839
Sampling frequency is twice the signal bandwidth.
~b;~~~ -2f, -f, (~)
Is
u,
,11 {Sf
-2/s
I
0
2/s
I
Aliasing (b)
Oversamplingfrequency is many times the signal bandwidth.
Lh,------,-rh,-----,rtL -f,
0
Is
I
(c)
Figure 29.42 Frequencydomain for (a) Nyquistrate converters (b) the aliasing that occurs;and (c) an oversampling converter.
As stated previously, the modulator actually provides the quantization in the Referred to as sigma-delta (LLl) or form of a pulse-density modulated signal. delta-sigma (LlL) modulation, the density of the pulses represents the average value of the signal over a specific period. Figure 29.43 illustrates the output of the modulator for the positive half of a sine wave input. Note that for the peak of the sine wave, most of the pulses are high. As the sine wave decreases in value, the pulses become distributed between high and low according to the sine wave value.
v
Figure 29.43 Pulse-densityoutput from a sigma-deltamodulatorfor a sine wave input.
840
Part IV Mixed-Signal Circuits
If the frequency of the sine wave represented the highest frequency component of the input signal, a Nyquist rate converter would take only two samples. The oversampling converter, however, may take hundreds of samples over the same period to produce this pulse-density signal.
Digital signal processing is then utilized, which has two purposes: to filter any out-of-band quantization noise and to attenuate any spurious out-of-band signals. The output of the filter is then downsampled to the Nyquist rate so that the resulting output of the ADC is the digital data, which represents the average value of the analog voltage over the oversampling period. The effective resolution of oversampling converters is determined by the values of signal-to-noise ratio and dynamic range obtained. The First-Order LL1 Modulator
Now that the basic function of the LL1 modulator has been described, it would be useful to examine its inner workings and determine why U modulation is so beneficial for generating high-resolution data. A basic first-order LL1 modulator can be seen in Fig. 29.44. Here, an integrator and a I-bit ADC are in the forward path, and a l-bit DAC is in the feedback path of a single-feedback loop system. The variables labeled are in terms of time, T, which is the inverse of the sampling frequency and k, which is an integer. The l-bit ADC is simply a comparator that converts an analog signal into either a high or a low. The l-bit DAC uses the comparator output to determine if +VREF or - VREF is summed with the input. While the benefits of LL1 modulation are not obvious, a simple derivation of the output, y(kn, will illuminate its distinct advantages. The output of the integrator, u(kn, can be described as u(kn
=x(kT - n - q(kT - n + u(kT - n
(29.95)
Integrator y(k1)
x(k1) _----':w
Figure 29.44 A first-order sigma-delta modulator.
841
Chapter 29 Data Converter Architectures
where, x(kT - n - q(kT - n is equal to the integrator's previous input, and u(kT - n is its previous output. The quantization error for the I-bit ADC, as discussed in Ch. 28, is again defined as the difference between its output and input such that Q;(kn
=y(kn -
(29.96)
u(kn
Plugging Eq. (29.95) into Eq. (29.96), the output response, y(kn is y(kn
=Qe(kn + x(kT - n - q(kT - n + u(kT - n
(29.97)
An ideal l-bit DAC has the following characteristic; if the input, y(kn := 0, the output, q(kn = - V REF, and if y(kn = 1, then q(kn = VREF" In reality, a l-bit DAC consists of a couple of switches connecting V REF or - V REF to a common node, so it is not difficult to assume that the DAC is ideal. Therefore, (29.98)
y(kn = q(kn
Utilizing Eq. (29.96) and Eq. (29.97), we find that Eq. (29.98) becomes y(kn
=x(kT - n + Qe(kn -
Qe(kT-
n
(29.99)
Therefore, the output of the modulator consists of a quantized value of the input signal delayed by one sample period, plus a differencing of the quantization en-or between the present and previous values. Thus, the real power of ~Ll modulation is that the quantization noise, Qe' cancels itself out to the first order. A frequency domain example will further illuminate this important fact. Suppose that the first-order modulator can be modeled in the S domain as seen in Fig. 29.45, with an ideal integrator represented with transfer function of the I-bit ADC is modeled as a simple error source, Qe(s), and again the DAC is considered to be ideal, such that yes) is equal to q(s). It is also assumed that the bandwidth of the input signal is much less than the bandwidth of the modulator. Therefore, using simple feedback theory, vo~s)becomes
t,
1 VOUT(S) = Qe(s) + S . [v /N(s) - VOUT(S)]
(29.100)
and solving for v OUT yields, S 1 VOUT(S) = Qe(s)· --1 +V/N(s) --1 S+ s+
(29.101)
Figure 29.45 A frequency domain model for the first-order sigma-delta modulator.
842
Part IV Mixed-Signal Circuits
Note that the transfer function from v/N to V OUT follows that of a low-pass filter and that the transfer function of the quantization noise follows that of a high-pass filter. Plotted together in Fig. 29.46, it is seen that in the region where the signal is of interest, the noise has a small value while the signal has a high gain, and that at higher frequencies, beyond the bandwidth of the signal, the noise increases. The modulator has essentially pushed the power of the noise out of the bandwidth of the signal. This high-pass characteristic is known as noise shaping and is a powerful concept used within oversampling ADCs. Low-pass filtering will then be performed by the digital filteiIn order to remove all of the out-of-band quantization noise, which then permits the signal to be downsampled to yield the final high-resolution output.
VOUT
~IV/N' s~II
---------
0)
t i Bandwidth of the modulator Signal bandwidth Figure 29.46 Frequency response of the first-order sigma-delta modulator.
As the LLl modulator is generating the pulse-density modulated output, it is interesting to examine the mechanics occurring in the loop, which result in an average of the input. An actual LLl modulator might resemble Fig. 29.47. A switched-capacitor integrator (see Sec. 27.2) provides the summing as well as the delay needed. The l-bit ADC is a simple comparator, and l-bit DAC is simply two voltage-controlled switches that select either V2VREF or -YzVREF to be summed with the input. A latched comparator is used to provide the necessary loop delay. Notice that the variables used are voltage representations of the variables used in Fig. 29.44. Remember that the function of the integrator is to accumulate differences between the input signal and the output of the DAC. If it is assumed that the input, vxCkT), is a positive DC voltage, then the output of the integrator should increase. However, the feedback mechanism is such that the l-bit ADC (the comparator) has a low output if the integrator output, vu(kT ), is positive. Thus, V2 VREF appears at the output of the DAC and is subtracted from the input, and the integrator output is driven back toward zero. The opposite occurs when vu(kT ) is negative such that the integrator output is always driven toward zero by the feedback mechanism. An example will illustrate the operation of the modulator in more detail.
Chapter 29 Data Converter Architectures
843
-VR EF 2
Figure 29.47 Implementation of a first-order sigma-delta modulator using a switched capacitor integrator.
Example 29.16 Using a general first-order LLl modulator, assume that the input to the modulator, v/k1) is a positive DC voltage of 0.4 V. Show the values of each variable around the LLl modulator loop and prove that the overall average output of the DAC approaches 0.4 V after 10 cycles. Assume that the DAC output is ±1 V, and that the integrator output has a unity gain with an initial output voltage of 0.1 V, and that the comparator output is either ±1 V.
The present integrator output will be equal to the sum of the previous integrator output and the previous integrator input. Therefore, Eq. (29.95) becomes (29.102) where v.(kT)
=v/kT) -
v/kT)
(29.103)
and the quantizing error, Qe(kT), is defined by Eqs. (29.96) and (29.98) as (29.104) The initial conditions define the values of the variable for k = O. The output of the integrator is given to be 0.1 V. Thus, the ADC output is low, the DAC output is VR EF • and the output of the summer, v.(O), is 0.4 - VR EF =- 0.6 V. The output for k = 1 begins again with the integrator output. Using Eq. (29.102), vu(kT) becomes vu(T)
=0.1 + (- 0.6) =- 0.5 V
844
Part IV Mixed-Signal Circuits
Since the output of the integrator is negative, the output of the comparator is positive and - VREF is subtracted from 0.4 to arrive at the value for va(T). Continuing in the same manner and using the above equations, we note the voltages for each cycle in Fig. 29.48. After 10 cycles through the modulator, the average value of v/kT ) becomes,
-v q(k7)
7-3 =1'0 =0.4 V
Notice that the behavior of vq(kT) swings around the desired value 0.4 V. If we were to continue computing values, as k increases, the amount that vq{kT) differs from 0.4 V would decrease. Ideally, we could make the deviation of vq(kT) as small as desired by allowing the modulator to take as many samples as necessary to meet that accuracy. • k
va(kT)
vu(kT)
0
-D.6
0.1
1.0
0.9
1
1.4
-D.5
-1.0
-D.5
0
2
-D.6
0.9
1.0
0.1
0.333
3
-D.6
0.3
1.0
0.7
0.50
-D.3
-1.0
-D.7
0.20
vikT)= vy(kT) Q,(kT)
vq(kT)
1.0
4
1.4
5
-D.6
1.1
1.0
-o.i
0.333
6
-D.6
0.5
1.0
0.5
0.429
7
1.4
-o.i
-1.0
-D.9
0.25
8
-D.6
1.3
1.0
-D.3
0.333
9
-D.6
0.7
1.0
0.3
0.40
Figure 29.48 Data from the first-order
~~
modulator.
One interesting note is to examine the effects of using a nonideal comparator. Suppose the integrator's output was smaller than the offset voltage of the comparator. A wrong decision would be made, causing v,(k7) to be the opposite of the desired value. However, as k increases, this error is averaged out, and the modulator still converges on the correct answer. Therefore, the comparator does not have to be very accurate in its ability to distinguish between two voltages, in contrast to Nyquist rate comparators. An interesting application of the first-order L~ modulator was reported in [20]. First-order L~ modulators were used to perform pixel-level AID conversion within a CMOS image sensor. In most digital imaging systems, ADCs are used to convert the analog signal representing the light intensity gathered by a charge-coupled device (CCD). Either a single high-speed ADC is used to convert the entire signal off of the CCD, or a parallel array of lower performance ADCs is used with one ADC assigned to
Chapter 29 Data Converter Architectures
845
each column of the sensor. Both of these configurations suffer performance loss because of the analog communication required between the sensor and the converter. It would be optimum to provide an ADC for each pixel in the sensor. However, the size of the ADC becomes critical as the number of converters increases. By using l-bit, first-order LLl modulators, the author was able to minimize the area required for each pixel (including the first-order LLl) to 30 urn by 30 urn and designed a first-order LLl using only 19 transistors, as seen in Fig. 29.49.
Integrator
Bit
I-bit DAC
Figure 29.49 A pixel block using a first-order sigma-delta modulator [20].
Photocurrent from the photodiode is integrated on Cl, using one side of a simple differential amplifier for the gain. The output of the integrator is passed on to a clocked comparator (via MlO), which is a crude version of the first clocked comparator presented in Sec. 16.1.3. The comparator performs a l-bit analog-to-digital conversion and passes the decision on to transistors, M16, M17, and M18, which actually form a I-bit switched-capacitor DAC. This cleverly designed DAC does not convert the output of the comparator to an analog voltage, but instead uses C2 to remove charge from Cl, thus resulting in an increase in output voltage of the integrator. The capacitor, C2, is discharged when 2 is high. However, when the output of the comparator is high, I is high, and 2 is low, the capacitor C2 is connected directly to the input of the integrator, thus transferring charge off of C1. If the comparator output is low, no charge is transferred from C1. The author was able to achieve a SNR of 52 dB and a dynamic range of 85 dB using a 0.8 urn process.
846
Part IV Mixed-Signal Circuits
The Higher Order U Modulators
Higher order L.1. modulators exist which provide a greater amount of noise shaping. A second-order L.1. modulator can be seen in Fig. 29.50. A derivation of the second-order transfer function would reveal that the output contained a delayed version of the input plus a second-order differencing of the quantization noise, Qe (see Problem 29.38). A third-order modulator would contain third-order differencing of the quantization and can be constructed by adding another integrator similar to integrator A into the system.
Integrator A
Integrator B y(kT)
x(kT)
Figure 29.50 A second-order sigma-delta modulator.
Figure 29.51 shows the noise-shaping functions of a first-, second-, and third-order modulator. The cross-hatched area under each of the curves represents the noise that remains in the signal bandwidth and is a magnified version of the blackened area of Fig. 29.46. As the order increases, notice that more of the noise is pushed out into the higher frequencies, thus decreasing the noise in the signal bandwidth. It should be reiterated that L.1. modulators do not attenuate noise at all. In fact, they add quantization noise that is very large at high frequencies. But because almost all of the
Third-order
I ) f
t Signal bandwidth
i
Sampling frequency
Figure 29.51 Noise shaping comparison of a first-, second-, and third-order modulator.
847
Chapter 29 Data Converter Architectures
noise is out of the signal bandwidth, it can be easily filtered, leaving only a small portion within the signal bandwidth. This point is important because the LA modulator should not be construed as a filtering circuit. The resolution also increases as the order of the LA modulator and the oversampling ratio increases, as seen in Fig. 29.52 [21]. Using a first-order modulator, one can expect an increase in dynamic range of 9 dB with every doubling of the oversampling ratio. This correlates to an approximate increase in resolution of 1.5 bits according to Eq. (28.28). The higher-order modulators have even greater gains in resolution as a 2.5-bit increase is attained with each doubling of the oversampling ratio using a second-order modulator, while the third-order modulator increases 3.5 bits.
20
Third-order .'~
Second-order
4
4
8
16
32 64 128 Oversampling ratio
256
512
Figure 29.52 Comparison of first-, second-, and third-order modulators versus oversampling ratio and resolution.
One could essentially construct a high-order LA modulator with many integrators. However, as with any system employing feedback, stability becomes a critical issue. The same holds true for the high-order LA modulators. Several other topologies have been developed which can implement modulators in a cascaded fashion and are guaranteed to be stable [22, 23]. However, considerable matching requirements need to be overcome.
848
Part IV Mixed-Signal Circuits
REFERENCES
[I]
R. L. Geiger, P. E. Allen, and N. R. Strader, VLSI - Design Techniques for Analog and Digital Circuits, McGraw-Hill Publishing Co., 1990.
[2]
R. E. Suarez, P. R. Gray, and D. A. Hodges, "AII-MOS Charge Redistribution Analog-to-Digital Conversion Techniques - Part II," IEEE Journal of Solid State Circuits, Vol. 10, No.6, pp. 379-385, December 1975.
[3]
J. Shyu, G. C. Ternes, and F. Krummenacher, "Random Errors in MOS Capacitors and Current Sources," IEEE Journal of Solid State Circuits, Vol. 16, No.6, pp. 948-955, December 1984.
[4]
M. J. M. Pelgrom et. al, "25-Ms/s 8-bit CMOS AID Converter for Embedded Application," IEEE Journal of Solid-State Circuits, Vol. 29, No.8, pp. 879-886, August 1994.
[5]
D. Choi et. al, "Analog Front-End Signal Processor for a 64 Mbits/s PRML Hard-Disk Drive Channel," IEEE Journal of Solid-State Circuits, Vol. 29, No. 12, pp. 1596-1605, December 1994.
[6]
N. Shiwaku, "A Rail-to-Rail Video-band Full Nyquist 8-bit AID Converter," Proceedings of the 1991 Custom Integrated Circuits Conference.
[7]
B. Razavi and B. A. Wooley, "A 12-b, 5-MSample/s Two-Step CMOS AID Converter," IEEE Journal of Solid State Circuits, Vol. 27, No. 12, pp. 1667-1678, December 1992.
[8]
J. Dornberg, P. R. Gray, and D. A. Hodges, "A 10-bit, 5-Msample/s CMOS Two-Step Flash ADC," IEEE Journal of Solid State Circuits, Vol. 24, No.2, pp. 241-249, April 1989.
[9]
T. Shimizu, et aI., "A lO-bit, 20 MHz Two-Step Parallel AID Converter with Internal S/H," IEEE Journal of Solid State Circuits, Vol. 24, No.1, pp. 13-20, February 1989.
[10]
B. S. Song, S. H. Lee, and M. F. Tompsett, "A lO-bit 15 MHz CMOS Recycling Two-Step AID Converter," IEEE Journal of Solid State Circuits, Vol. 25, No. 12, pp. 1328-1338, December 1990.
[11]
B. S. Song, M. F. Tompsett, and K. R. Lakshmikumar, "A 12-bit, 1-MSample/s Capacitor Error-Averaging Pipelined AID Converter," IEEE Journal of Solid State Circuits, Vol. 23, No.6, pp. 1324-1333, December 1988.
[12]
S. H. Lewis and P. R. Gray, "A Pipelined 5-Msample/s 9 bit Analog-to-Digital Converter," IEEE Journal of Solid State Circuits, Vol. 22, No.6, pp. 954-961, December 1987.
Chapter 29 Data Converter Architectures
849
[13]
S. Sutarja and P. R. Gray, "A Pipelined 13-bit, 250-ks/s, 5-V Analog-to-Digital Converter," IEEE Journal of Solid State Circuits, Vol. 23, No.6, pp. 1316-1323, December 1988.
[14]
P. Vorenkamp and J. P. M. Verdaasdonk, "A 10 b 50 Ms/s Pipelined ADC," IEEE ISSCC Digest of Technical Papers, pp. 34-35, February 1992.
[15]
M. Yotsuyanagi, T. Etoh, and K. Hirata, "A 10 Bit 50 MHz Pipelined CMOS AID Converter with S/H," IEEE Journal of Solid State Circuits, Vol. 28, No.3, pp. 292-300, March 1993.
[16]
J. L. McCreary and P. R. Gray, "AII-MOS Charge Redistribution Analog-to-Digital Conversion Techniques - Part I," IEEE Journal of Solid State Circuits, Vol. 10, No.6, pp. 371-379, December 1975.
[17]
K. Bacrania, "A 12 Bit Successive-Approximation ADC with Digital Error Correction," IEEE Journal of Solid State Circuits, Vol. 21, No.6, pp. 1016-1025, December 1986.
[18]
M. Ismail and T. Fiez, Analog VLSI Signal and Information Processing, McGraw-Hill, 1994.
[19]
B. E. Boser, "Design and Implementation of Oversampled Analog-to-Digital Converters," Ph.D. Dissertation, Stanford University, 1988.
[20]
B. Fowler, "CMOS Area Image Sensors with Pixel Level AID Conversion," Ph.D. Dissertation, Stanford University, October 1995.
[21]
B. P. Brandt, Oversampled Analog-to-Digital Conversion, Integrated Circuits Laboratory, Technical Report No. ICL91-009, Stanford University, 1991.
[22]
Y. Matsuya, K. Uchimura, et al, "A 16-bit Oversampling AID Conversion Technology Using Triple Integration Noise Shaping," IEEE Journal of Solid State Circuits, Vol. 22, No.6, pp. 921-929, December 1987.
[23]
K. Uchimura et al, "Oversampling A-to-D and D-to-A Converters with Multistage Noise Shaping Modulators," IEEE Transactions on Acoustics, Speech and Signal Processing, pp. 1899-1905, December 1988.
PROBLEMS 29.1
A 3-bit resistor string DAC similiar to the one shown in Fig. 29.2a was designed with a desired resistor of 500 Q. After fabrication, mismatch caused the actual value of the resistors to be R[ = 500, R2 = 480, R3 = 470, R4 = 520,
n, = 510, R
6
= 490, R7 = 530,
Determine the maximum INL and DNL for the DAC assuming VREF 29.2
n, = 500
=5 V.
An 8-bit resistor string DAC similiar to the one shown in Fig. 29.2b was fabricated with a nominal resistor value of 1 kQ. If the process was able to
850
Part IV Mixed-Signal Circuits provide matching of resistors to within 1 percent, find the effective resolution of the converter. What is the maximum INL and DNL of the converter? Assume that VREF =5 V.
29.3
Compare the digital input codes necessary to generate all eight output values for a 3-bit resistor string DAC similiar to those shown in Fig. 29.2a and b. Design a digital circuit that will allow a 3-bit binary digital input code to be used for the DAC in Fig. 29.2a. Discuss the advantages and disadvantages of both architectures.
29.4
Plot the transfer curve of a 3-bit R-2R DAC if all Rs = 1.1 kQ and 2Rs = 2 kQ. What is the maximum INL and DNL for the converter? Assume all of the switches to be ideal and VREF = 5 V.
29.5
Suppose that a 3-bit R-2R DAC contained resistors that were perfectly matched and that R = 1 kQ and VREF = 5 V. Determine the maximum switch resistance that can be tolerated for which the converter will still have 3-bit resolution. What are the values oflNL and DNL?
29.6
The circuit illustrated in Fig. 29.5 is known as a current-mode R-2R DAC, since the output voltage is defined by the current through R F • Shown in Fig. P29.6 is an N-bit voltage-mode R-2R DAC. Design a 3-bit voltage mode DAC and determine the output voltage for each of the eight input codes. Label each node voltage for each input. Assume that R = 1 kQ and that R 2 =R 1 = 10 kQ and VREF =5V.
VOUT
Do
Figure P29.6 29.7
Design a 3-bit current steering DAC using the generic current steering DAC shown in Fig. 29.9. Assume that each current source, I, is 5 rnA, and find the total output current for each input code.
29.8
A certain process is able to fabricate matched current sources to within 0.05 percent. Determine the maximum resolution that a current steering (nonbinary weighted) DAC can attain using this process.
Chapter 29 Data Converter Architectures
29.9
851
Design an 8-bit current steering DAC using binary-weighted current sources. Assume that the smallest current source will have a value of 1 ~A. What is the range of values that the current source corresponding to the MSB can have while maintaining an INL of Yz LSB? Repeat for a DNL less than or equal to Yz LSB.
29.10 Prove that the 3-bit charge scaling DAC used in Ex. 29.6 has the same output voltage increments as the R-2R DAC in Ex. 29.3 for VREF = 5 V and C =0.5 pF. 29.11 Determine the output of the 6-bit charge scaling DAC used in Ex. 29.7 for each of the following inputs: D = 000010,000100,001000, and 010000. 29.12 Design a 4-bit charge scaling DAC using a split array. Assume that VREF = 5 V and that C =0.5 pF. Draw the equivalent circuit for each of the following input words and determine the value of the output voltage: D = 0001, 0010, 0100, 1000. Assuming the capacitor associated with the MSB had a mismatch of 4 percent, calculate the INL and DNL. 29.13 For the cyclic converter shown in Fig. 29.17, determine the gain error for a 3-bit conversion if the feedback amplifier had a gain of 0.45 V N. Assume that VR EF = 5 V. 29.14 Repeat Problem 29.13 assuming that the output of the summer was always 0.2 V greater than the ideal and that the amplifier in the feedback path had a perfect gain of 0.5 VN. 29.15 Repeat Problem 29.13 assuming that the output of the summer was always 0.2 V greater than ideal and that the amplifier in the feedback path had a gain of 0.45 VN. 29.16 Design a 3-bit pipeline DAC using VREF = 5 V. (a) Determine the maximum and minimum gain values for the first-stage amplifier for the DAC to have less than ±Yz LSBs of DNL assuming the rest of the circuit is ideal. (b) Repeat for the second-stage amplifier. (c) Repeat for the last-stage amplifier. 29.17 Using the same DAC designed in Problem 29.16, (a) determine the overall error (offset, DNL, and INL) for the DAC designed in Problem 29.16 if the S/H amplifier in the first stage produces an offset at its output of 0.25 V. Assume that all the remaining components are ideal. (b) Repeat for the second-stage SIH. (c) Repeat for the last-stage S/H. 29.18 Design a 3-bit Flash ADC with its quantization error centered about zero LSBs. Determine the worst-case DNL and INL if resistor matching is known to be 5 percent. Assume that VREF =5 V. 29.19 Using the ADC designed in Problem 29.18, determine maximum offset which can be tolerated if all the comparators had the same magnitude of offset, but with different polarities, to attain a DNL of less than or equal to ±Yz LSB.
852
Part IV Mixed-Signal Circuits
29.20 A 4-bit Flash ADC converter has a resistor string with mismatch as shown in Table P29.20. Determine the DNL and INL of the converter. How many bits of resolution does this converter possess? VREF =5 V. Resistor
Mismatch (%)
1
2
2
1.5
3
0
4
-1
5
-0.5
6
1
7
1.5
8
2
9
2.5
10
1
11
-0.5
12
-1.5
13
-2
14
0
15
1
16
1
Table P29.20
29.21 Determine the open-loop gain required for the residue amplifier of a two step ADC necessary to keep the converter to within 'h LSB of accuracy with resolutions of (a) 4 bits, (b) 8 bits, and (c) 10 bits. 29.22 Assume that a 4-bit, two-step Flash ADC uses two separate Flash converters for the MSB and LSB ADCs. Assuming that all other components are ideal, show that the first Flash converter needs to be more accurate than the second converter. Assume that VREF = 5 V. 29.23 Repeat Ex. 29.12 for VIN = 3, 5, 7.5, 14.75 V. 29.24 Repeat Ex. 29.13 for VEN = 1,4,6,7 V and VREF =8 V. 29.25 Assume that an 8-bit pipeline ADC was fabricated and that all the amplifiers had a gain of 2.1 VN instead of 2 VN. If VEN = 3 V and VREF =5 V, what would be the resulting digital output if the remaining components were considered to be ideal? What are the DNL and INL for this converter? 29.26 Show that the first-stage accuracy is the most critical for a 3-bit, l-bit per stage pipeline ADC by generating a transfer curve and determining DNL and INL for the ADC for three cases: (1) The gain of the first-stage residue amplifier set
Chapter 29 Data Converter Architectures
853
equal to 2.2 VN, (2) the second-stage residue amplifier set equal to 2.2 VN, and (3) the third-stage residue amplifier set equal to 2.2 VN. For each case, assume that the remaining components are ideal. Assume that VR EF =5 V. 29.27 An 8-bit single-slope ADC with a 5 V reference is used to convert a slow-moving analog signal. What is the maximum conversion time assuming that the clock frequency is 1 MHz? What is the maximum frequency of the analog signal? What is the maximum value of the analog signal which can be converted? 29.28 An 8-bit single slope ADC with a 5 V reference uses a clock frequency of I MHz. Assuming all other components to be ideal, what is the limitation on the value of RC? What is the tolerance of the clock frequency which will ensure less than 0.5 LSB ofINL? 29.29 An 8-bit dual slope ADC with a 5 V reference is used to convert the same analog signal in Problem 29.27. What is the maximum conversion time assuming that the clock frequency is 1 MHz? What is the mimimum conversion time that can be attained? If the analog signal is 2.5 V, what will be the total conversion time? 29.30 Discuss the advantages and disadvantages of using a dual-slope versus a single slope ADC architecture. 29.31 Repeat Ex. 29.15 for a 4-bit successive approximation ADC using VREF = 5 V for v/N = I, 3, and full-scale. 29.32 Assume that v/N = 2.49 V for the ADC used in Problem 29.31 and that the comparator, because of its offset, makes the wrong decision for the MSB conversion. What will be the final digital output? Repeat for v/N = 0.3025, assuming that the comparator makes the wrong decision on the LSB. 29.33 Design a 3-bit, charge redistribution ADC similiar to that shown in Fig. 29.39 and determine the voltage on the top plate of the capacitor array throughout the conversion process for v/N = 2, 3, and 4 V, assuming that VREF = 5 V. Assume that all components are ideal. Draw the equivalent circuit for each bit decision. 29.34 Determine the maximum INL and maximum DNL of the ADC designed in Problem 29.33 assuming that the capacitor array matching is 1 percent. Assume that the remaining components are ideal and that the unit capacitance, C, is 1 pF.
29.35 Show that the charge redistribution ADC used in Problems 29.32 and 29.33 is immune to comparator offset by assuming an initial offset voltage of 0.3 and determining the conversion for v/N = 2 V. 29.36 Discuss the differences between Nyquist rate ADCs and oversampling ADCs.
854
Part IV Mixed-Signal Circuits
29.37 Write a simple computer program or use a math program to perform the analysis shown in Ex. 29.15. Run the program for k = 200 clock cycles and show that the average value of v/kT) converges to the correct answer. How many clock cycles will it take to obtain an average value if v/kT) stays within 8-bit accuracy of the ideal value of 0.4 V? 12-bit accuracy? 16-bit accuracy? 29.38 Prove that the output of the second-order I:Ll modulator shown in Fig. 29.50 is, y(kT) = x(kT - T) + Qe


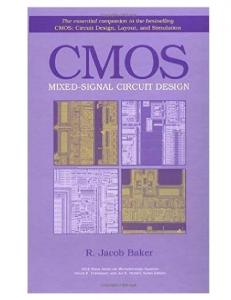


![[PDF] CMOS Analog Circuit Design - Google Sites](https://m.moam.info/img/260x300/pdf-cmos-analog-circuit-design-google-sites_64771592097c47a9708b4be2.jpg)