SSC
TJ881-08
November 17, 2003
11:43
Soil & Sediment Contamination, 12: 885–899, 2003 Copyright © ASP ISSN: 1058-8337 print DOI: 10.1080/10588330390254937
Co-Composting of Soil Heavily Contaminated with Creosote with Cattle Manure and Vegetable Waste for the Bioremediation of Creosote–Contaminated Soil Harrison I. Atagana,1 R. J. Haynes,2 and F. M. Wallis2
selected hydrocarbons in the compost systems were determined at the end of composting. Temperature rose to about 45◦ C in the cattle manure compost within two months of incubation while temperature in the control and vegetable waste remained below 30◦ C until the fourth month. Creosote concentration was reduced by 17% in the control and by more than 99% in the cattle manure and vegetable waste compost after composting. The rate of reduction in concentration in the mixed vegetable waste compost was initially lower than in the cattle manure compost. The reduction rate became similar in later months with only small differences towards the end of the composting. The concentrations of selected creosote components were reduced by between 96% and 100% after composting. There was no significant difference in reduction in concentration in both compost systems at p 0.05. Microbial activity correlated with reduction in creosote concentration.
1 School of Earth Sciences, Mangosuthu Technikon, Jacobs, Durban, South Africa; 2 School of Applied Environmental Sciences, University of Natal, Scottsville, Pietermaritzburg, South Africa
Mispah form (FAO: Lithosol) soil contaminated with >380 000 mg kg−1 creosote was co-composted with cattle manure and mixed vegetable waste for 19 months. The soil was mixed with wood chips to improve aeration and then mixed with cattle manure or mixed vegetable waste in a ratio of 4:1. Moisture, temperature, pH, ash content, C:N ratios, and the concentrations of creosote in the compost systems were monitored monthly. The concentrations of
Address correspondence to Harrison I. Atagana, School of Earth Sciences, Mangosuthu Technikon, Jacobs, Durban 4026, South Africa. E-mail:
[email protected]
KEY WORDS: bioremediation, co-composting, creosote, cattle-manure, PAHs, vegetable-waste.
885
SSC
TJ881-08
November 17, 2003
11:43
INTRODUCTION
C
OMPOSTING, the process by which compost is produced from raw materials, is an above-ground systems in which organic waste materials are biologically converted to humus-like product. Composting systems are used to stabilize organics such as manure, municipal sewage sludge, municipal refuse, yard waste and food processing wastes (Fan and Tafuri, 1994; Potter et al., 1999). Compost used in bioremediation is referred to as tailored or designed compost, in that it is specially made to treat specific contaminants at specific sites (USEPA, 1997). Soil remediation carried out by composting decontaminates the soil as well as providing the nutrients required for revegetation. Compost bioremediation, more than any other soil clean-up technology, results in an enriched soil as end-product and can leave the soil in better condition than before it was contaminated (Cole et al., 1995). Composting is characterized by a variable temperature range during degradation of organic compounds. In the early stages of composting, the temperature increases from ambient to approximately 40◦ C. With continued degradation of organic matter, more heat is evolved, raising the temperature to thermophilic ranges (40–70◦ C) (Fan and Tafuri,1994). It has been suggested that optimal organic decomposition takes place in the thermophilic range 55 to 60◦ C (Fan and Tafuri,1994). Further increase in temperature results in a decrease in decomposition rate and consequent cooling of the compost. This decrease is due to loss of water from the compost as a result of high temperature in the system (Fan and Tafuri, 1994). Compost bioremediation is carried out by co-composting the contaminated soil with suitable compost materials to effect biodegradation of the contaminant. Previous studies have examined the degradation of organic pollutants in composts (Reid et al., 1999). For example, it has been shown that the microbes present in windrow composts are capable of mineralizing pentachlorophenol (Valo and Slakinoja-Salonen, 1986). Although composting has been used in the remediation of soils contaminated with a number of organic compounds, including PAHs, the use of composting as a bioremediation technology has been given very little attention (Potter et al., 1999). Much of the work on treatment of contaminated soils by composting (Valo and Slakinoja-Salonen, 1986; Potter et al., 1999; Reid et al., 1999) has been done on soils contaminated with low concentrations of the contaminating substances as compared to the soil in the present study, in spite of the fact that composts have been reported to have good potential for remediation of heavily contaminated sites (Reid et al., 1999). The aim of this research is to study the effects of co-composting different compost materials with soil contaminated with >380 000 mg kg−1 creosote, on the degradation of creosote in a static-pile compost system. It is also aimed at investigating the temperature profiles of the different compost systems, the changes in nutrient composition and moisture occurring therein, during the composting period. This will help determine the requirements of each compost type and their practical application on large-scale treatment of contaminated soils. The contaminated 886
SSC
TJ881-08
November 17, 2003
11:43
soil used for the study is a mispah form (FAO:Lithosol) obtained from a creosote wood-treatment plant in the midlands of KwaZulu-Natal, South Africa. Previous studies on the same contaminated soil showed that after long periods of treatment with other bioremediation techniques, reasonable amounts of high molecular mass PAHs persisted in the soil (Atagana et al., 2000, 2001, 2002).
MATERIALS AND METHODS Soil Samples
Creosote-contaminated soil (2000 kg) was excavated from the experimental site. The soil was transported to the laboratory in nylon fiber bags and stored at 4◦ C. The concentrations of creosote and selected creosote components in the soil at the start of the experiment were determined by using EPA method 418.1 (USEPA, 1983). The bulk soil was homogenized in an electric concrete mixer before being used to make the soil-compost mixture.
Compost Materials
Cattle manure was obtained from the University of Natal’s Experimental Farm at Ukulinga, Pietermaritzburg, South Africa. Mixed vegetable waste was obtained from a fresh produce market at Nkondeni in Pietermaritzburg. Compost heaps were made on slatted, sawn wood pallets overlaid with nylon fiber bags, which allowed passage of air and excess water in and out of the compost heaps.
Preparation of Compost Mixtures
Three hundred and fifty kilograms of homogenized contaminated soil were mixed with wood chips (20 cm × 4 cm) in a ratio of 1:1 (v/v). The mixture was then mixed separately with vegetable waste and cattle manure in a ratio of 4:1(contaminated soil + wood chips: compost material) (v/v). The control was a mixture of contaminated soil and wood chips without compost material. Each treatment was duplicated and placed on a separate palette and covered with hay for insulation.
Temperature Measurement
Thermocouples were located in the middle of the heap about 45 cm from the top. Because of the threat of periodic malfunctioning of the data logger, the temperature was also measured manually at three depths (15 cm, 35 cm and 50 cm) in each of the compost heaps every two weeks. Measurements were taken biweekly at noon. 887
SSC
TJ881-08
November 17, 2003
11:43
Determination of Moisture Content
The moisture content of the compost was determined weekly during the dry months and, when necessary, water was added using a garden water sprinkler, to maintain a water content of about 70% field capacity.
Measurement of pH
Compost samples were air-dried for 72 hours in the dark at room temperature (25◦ C). The compost was then ground and passed through a 2 mm sieve. Ten grams of each soil sample were put in 50 ml beakers into which 25 ml of sterile distilled water were added. The slurry was stirred for one minute and allowed to stand for 15 minutes. The pH of the supernatant was measured with a standard pH meter (Crison Micro pH 2000).
Measurement of Ash Content
The ash content of each compost mixture and the control was measured by weighing 10 g of each treatment mixture separately into a preweighed crucible and reweighing before heating in a furnace at 400◦ C for 6 hours. The crucible and ash were cooled to a constant temperature in a desiccator before being weighed again. These measurements were carried out at the start and at the end of the experiment.
Respiration of Compost Microorganisms
Determination of the respiration rate of the compost-inhabiting microorganisms was carried out by measuring carbon dioxide evolution in the compost. Duplicate 30 g of compost were placed in beakers inside glass jars. A plastic vial containing 20 ml of a 0.1 M sodium hydroxide solution was suspended from a tripod in each jar. The jars were tightly closed and incubated for 3 days at room temperature. The vials’ contents were transferred to flasks and 2 ml of barium chloride solution added. To each flask was added 3–4 drops of indicator (phenolphthalein) solution and the mixture titrated with 2 M HCl. Controls were set up identically but without soil. Results were calculated as follows: µg CO2 − C/g/day = Vsample − Vblank × 2.2 × 0.27/dw × day × 1000 Where Vblank is the volume of HCl for the blank, Vsample is the volume of HCl for the sample, 2.2 is the conversion factor (1 ml 0.1 M NaOH = 2.2 mg CO2 ); 0.27 is mg CO2 −C and dw is dry mass (Alef, 1995). 888
SSC
TJ881-08
November 17, 2003
11:43
Microbial Plate Counts
Three samples (about 100 g each) were taken from each heap every month by inserting a glass tube of about 3 mm in diameter horizontally into the middle of the heap. The samples were taken at about 20 cm, 35 cm and 50 cm from the top of each heap. Plate counts of microorganisms present in the compost mixture were done by weighing 1 g samples of the soil-compost mixtures into separate beakers and preparing a serial dilution, before inoculating onto solidified nutrient agar. The plates were incubated in an inverted position for 48 hours at 30◦ C. The results are represented as colony forming units per gram (cfu g−1 ). Nutrients
Carbon, hydrogen and nitrogen contents of the compost was determined by using a Perkin Elmer 2400 CHN Elemental Analyser. Tin boats were used for holding the samples, the combustant was oxygen, the carrier gas was helium and the furnace temperature ranged between 98◦ C and 150◦ C (University of Natal, Chemistry Department). The nitrogen in the sample was converted to nitrogen gas (N2 ), the carbon was converted to carbon dioxide (CO2 ) and the hydrogen was converted to water (H2 O). The gases produced were analyzed using frontal gas chromatography. Determination of Concentration of Residual Creosote and Selected Creosote Components
Creosote concentration in the compost was analyzed by using the EPA method 418.1 (USEPA, 1983) described as follows: compost (2 g) and 2 g anhydrous Na2 SO4 were placed in a 30 ml amber glass vial. Carbon tetrachloride (10 ml) was added before sealing the vial with a teflon-lined screw cap. The sealed vial was vortexed for 15 seconds and placed in a sonicating bath (Whaledent Biosonic) for 15 minutes before remixing on the vortex mixer for about 15 seconds. It was then placed in the sonicating bath for another 15 minutes. The solvent was transferred to a clean, dry vial containing 1 g activated FlorosilTM (Sigma) and 0.6 ml water [i.e. 6% water (w/w)]. The sealed vial was shaken for one minute and allowed to stand overnight at ambient temperature. This silica “clean-up” procedure was used to remove interfering humic materials (USEPA, 1983). The extract was finally filtered through a Whatman GF/C glass fiber filter. The filtrate was made up to 10 ml in a volumetric flask and the absorbance determined with a Nicolet Avater 320 Infra-red Spectrophotometer at wave numbers between 400 and 4000 cm−1 . Calibration of the reference creosote was done by diluting commercial grade creosote with carbon tetrachloride to a series of five working standards (10; 100; 250; 500; 1000 mg L−1 ) and a calibration curve was derived by determining the absorbance of each standard. A calibration plot of the absorbance versus mg creosote (100 ml L−1 ) solution was generated with OmnicTM software. The concentration of creosote in 889
SSC
TJ881-08
November 17, 2003
11:43
each extract was determined by comparing the response with the calibration plot. To calculate the results, a linear equation (y = 1.192 x + 1.363) was generated by OmnicTM software, where x = creosote concentration of sample (kg −1 soil) and y = peak area. The actual hydrocarbon concentration in mg kg−1 soil was then calculated by multiplying x by a factor of 50, which compensates for the cell path length, sample size and dilution factor. This formula was then programmed into a spreadsheet, which automatically calculated the creosote concentration in mg kg−1 from the infra-red absorbance values as they were entered. All concentration results were corrected with a dilution factor to compensate for the 62.5% dilution due to addition of wood chips and compost materials. Changes in concentrations of selected creosote hydrocarbons were determined by Soxhlet extraction and GC/FID. The GC was a Varian-3800 with argon as the carrier gas and fitted with a 30 m capillary column with 0.25 mm internal diameter and 0.25 µm film thickness, and a flame ionization detector (FID). Two temperature programmes were run in order to obtain good separation and quantification of the more volatile compounds. The first temperature programme was: 60◦ C, 4 min., followed by ramping at 10◦ C/min. up to 235◦ C, maintained for 40 min.; injector temperature 220◦ C. The second temperature programme was used for the analysis of the more volatile compounds, viz. 20◦ C; 1 min 40◦ C, 1 min., 10◦ C/min., ramping up to 200◦ C, maintained for 20 min.; injector temperature 220◦ C (Eriksson et al., 2000). RESULTS AND DISCUSSION Compost pH
The pH of the compost and control was observed to increase up until the fifth month, reaching between 7.6 and 7.9, and then decreasing to about 6.7 by the sixth month. Between the sixth and thirteenth month it fluctuated between 6.3 and 7.3. It, however, became relatively stable between fourteenth month and the nineteenth month with the pH ranging between 6.3 and 6.4. The pH range observed in this experiment is well within the range recommended for composting of organic materials (Hunter et al., 1981; Kubota and Nakasaki, 1991). The decrease in pH as from the sixth month is attributed to decomposition of the compost materials and the pollutant hydrocarbons, which may have caused the release of probably intermediate and final products that have lowering effect on the pH of the compostsoil mixture (Alexander, 1999). The prevalence of pH lower than 7, for most of the experimental period, may account for the large presence of fungal species in the microbial consortia utilizing the contaminant hydrocarbons. Compost Nutrient
The initial C:N ratios in the contaminated soil was determined to be 200:1 This nitrogen content was very deficient when compared to the recommended range of 890
SSC
TJ881-08
November 17, 2003
11:43
TABLE 1 Changes in C:N Ratio of the Creosote-Contaminated Soil Compost Mixture During Co-Composting. Values are Means of Three ±1 Standard Deviation Compost-soil mixture Control (without compost) Vegetable waste compost Cattle manure compost
0 Month
6 Months
12 Months
18 Months
200:1 12:1 7:1
126:1 6:1 6:1
225:1 8:1 8:1
189:1 11:1 14:1
between 25:1 and 35:1 for composting (Anderson, 1991; Kubota and Nakasaki, 1991). However, after mixing with the compost materials the C:N ratio of the vegetable waste compost was 12:1 and that of the cattle manure was 7:1, a much higher ratio than recommended. This, however, did not show any adverse effect on the decomposition of the creosote. The C:N ratios in the three sets of compost heaps (control, vegetable waste and cattle manure) changed over time as the incubation progressed (Table 1). The ratio decreased in the sixth month but increased again in the twelfth and eighteenth months (Table 1). The initial decrease in the C:N ratio can be attributed to changes in aeration, moisture and overall microbial activity as affected by the latter two conditions, which resulted in the depletion of the carbon content of the mixture. The increase in the C:N ratio in subsequent months can be attributed to the increased availability of the carbon components of the mixture as a result of desorption from soil matrix and further decomposition of the plant materials in vegetable waste and cattle manure. The increase helped to sustain the continued growth of the degrading microorganisms through the incubation period. Measurements of the ash components of the compost mixtures and the control showed changes of 6.37 to 6.41 for the control and 5.26 to 5.27 for the cattle manure while there was no change in the vegetable waste which was 5.27. These changes are represents no significant difference between the initial and final results and hence no significant change in the mineral components of the soil at the end of the treatment. The changes are however thought to be due to measurement procedures.
Microbial Populations and Changes in Concentrations of Creosote and Selected Creosote Components
The reduction in creosote concentration in the control experiment was significantly different from those observed in the vegetable waste and the cattle manure compost. While the control experiment showed only a 17% reduction in creosote concentration, both the vegetable waste and cattle manure compost showed a reduction of more than 99% each. The rate of decrease in concentration was initially faster in the cattle manure compost (Figure 1). This was probably due to the partially decomposed nature of the cattle manure, which supported a high population of microorganisms (Figure 2) including bacteria, actinomycetes and fungi that have 891
SSC
TJ881-08
November 17, 2003
11:43
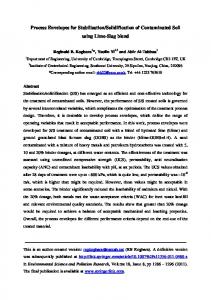
FIGURE 1 Changes in the concentration of creosote in creosote-contaminated soil compost mixture during co-composting. Values are means of three ±1 Standard Error.
FIGURE 2 Counts of soil microorganisms in creosote-contaminated soil compost mixture during cocomposting. Values are means of three ±1 Standard Error.
892
SSC
TJ881-08
November 17, 2003
11:43
the capability to degrade substances such as cellulose (Alexander, 1977; Atlas and Bartha, 1987; Criddle, 1993), an attribute, which is advantageous to the degradation of the contaminant creosote. The cellulose base of the manure afforded the organisms the opportunity to adapt to creosote while growing on the manure and producing enzymes that were subsequently used in co-metabolizing the creosote (Bardos, 1996). The heterogeneity of the manure microflora may also be partly responsible for the fast rate of degradation in the cattle manure compost. It is suspected that the different microorganisms present in the manure may have capability to metabolize the different components of creosote, hence the components were attacked by different organisms simultaneously or at different times. Degradation of creosote in the vegetable waste compost was slow initially, probably due to the low population of microorganisms present in the compost mixture (Figure 2), but accelerated during the third month of composting. This is attributed to the nature of the mixed vegetable waste, which was specially selected for it slow decomposition rate so as to facilitate continued microbial growth over a protracted period of time, thus allowing for adaptation of the organisms to the compost-creosote-contaminated soil mixture. The high concentration of creosote in the mixture may have also partially inhibited microbial proliferation at the beginning of the process (Baker and Herson, 1994), which would explain the limited degradation by the end of the first month. Although population of microorganisms started to decline from the thirteenth and fifteenth months in the cattle manure and vegetable manure respectively, the decrease in creosote concentration continued until the eighteenth month. Despite the lower populations of microorganisms observed in the vegetable waste compost as compared to the populations in the cattle manure compost (Figure 2), the overall effect of the organisms on the reduction of creosote concentration was not significantly different from each other. Results of the analyses of residual concentrations of selected creosote components at the end of the composting period showed that all the phenolic compounds (phenol, o-cresol, m-cresol and p-cresol), the 2-ring PAH (naphthalene) and the 3-ring PAHs (anthracene, phenanthrene, pyrrole and fluorine) were removed to below detectable limits in the vegetable waste and cattle manure compost (Figure 3). Trace amounts of the 4- and 5-ring PAHs (pyrene, chrysene, fluoranthene and benzo(a)pyrene) continued to persist in these treatments to the end of the composting period. Although the phenolics compounds and naphthalene were also completely removed from the control experiment, the 3-, 4- and 5-ring PAHs persisted to the end of the composting period. The differential removal of these compounds from the composted soil is attributed to the differences in their physical and chemical properties such as their aqueous solubility, molecular mass, number of rings in their structure, and position of substituting molecules. The more soluble compounds were degraded faster and the ones with fewer rings in their structure were also more susceptible to degradation while the compounds with more rings and that are less soluble in aqueous solution are more recalcitrant. Chrysene was the most recalcitrant of all the compounds measured with about 1.6 mg kg−1 detected in the vegetable waste compost. 893
SSC
TJ881-08
November 17, 2003
11:43
FIGURE 3 Residual concentrations of selected creosote components after 19 months of co-composting of creosote-contaminated soil. Values are means of three ±1 Standard Error.
Respiration of Compost Inhabiting Microorganisms and Monthly Rates of Reduction in Creosote Concentration
Results from microbial respiration experiments (Figure 4) show that increases in microbial activity correlates to increases in the rates of creosote degradation (Figure 5). This relationship was only evident in the first four months of composting. However, the high rate of reduction in creosote concentration in the first month of composting could not be completely associated with microbial action since the population of microorganisms at this stage was relatively low (Figure 2). Volatilization of some components of creosote due to homogenization could be responsible to a large extent in the rate of reduction observed. The high rates of reduction in creosote concentration maintained in months 2–4 could be due to the rapid microbial breakdown of readily degradable components of creosote present in the compost mixture. The Duncan’s New Multiple Range Test at p 0.05 showed that there was a significant decrease in the rate of degradation in the fifth month (Figure 5) followed by slight increases up until the eighth month. This period was followed by a gradual decline up until the sixteenth month. The increases that followed in the last three months were not significant at p 0.05. These periods of low rates of concentration reduction was not complemented by a comparable decrease in respiration rates. The respiration rates and microbial counts continued to remain high until the end of the composting period with only small decreases between the fifteenth and eighteenth months. The slow rates of degradation observed in the last fifteen months could be 894
SSC
TJ881-08
November 17, 2003
11:43
FIGURE 4 Respiration rates of soil microorganisms during co-composting of creosote-contaminated soil. Values are means of three ±1 Standard Error.
FIGURE 5 Rate (%) of decrease per month in creosote concentration during co-composting of creosotecontaminated soil. Values are ±1 Standard Error.
895
SSC
TJ881-08
November 17, 2003
11:43
due to the difficulty with which the organisms co-metabolized the more recalcitrant components of creosote remaining in the compost mixture. It could also be due probably to the low amount of creosote present in the compost by the fifth month as a result of the rapid decreases during the first four months of composting. Low concentrations of hydrocarbons have been reported to reduce or inhibit the rate of degradation in contaminated environment (Alexander, 1999). Although microbial population and respiration continued to increase beyond the fifth month, it was observed that the diversity in the population decreased significantly towards the end of the composting period. Hence the first four months represent the period during which the more susceptible components were rapidly removed under a regime of a wide variety of microorganisms and the later period represent when the more recalcitrant components were being slowly degraded by the specialized population of microorganisms, which was now dominant in the compost system. During both periods, there were large populations of microorganisms hence the high rate of respiration. Notwithstanding the differences in microbial biomass and respiratory activity, substantial degradation of creosote occurred in both compost systems. This suggests that the level of creosote degradation observed in the compost systems may not all be directly due to biological attack. Chemical and physical conditions established by the process may exert an important influence on the breakdown of certain organic compounds, which are known to be affected by changes in conditions such as UV light, temperature and pH (Diaz et al., 1996). Volatilization as earlier explained, could also play a major role in concentration reduction. Hence, the overall results observed are an aggregate of the effects of physical, chemical and biological destructive agents, combined to degrade the pollutant, thus magnifying the effectiveness of the composting. The Duncan’s New Multiple Range Test showed that there was no significant difference at p 0.05 in the degradation capabilities of the microorganisms present in the vegetable waste compost and the cattle manure compost. This is due to the similarity in their microbial complement, dictated by their common substrate, plant cellulose. However respiration rates of the microorganisms in the vegetable waste compost was significantly different from those of the microorganisms present in the cattle manure compost at p 0.05. This was largely due to the difficulty experienced in establishing a microbial population in the vegetable waste and the difference in the microbial populations between this and the cattle manure first month of the experiment. Microbial populations and respiration in the control experiment were relatively very low throughout the composting period (Figures 2 and 4). This correlates to the low level of reduction in concentration observed in this experiment (Figure 1). As earlier discussed, the relative higher levels of reduction in the first two months could be largely attributed to volatilization. The rate of reduction in concentration showed only small changes in this experiment. The poor performance of the control experiment can be attributed to the lack of a booster microbial population supplied by a composting material such as cattle manure and the inhibitory effect of the high concentration of creosote as the concentration in this experiment was not diluted 896
SSC
TJ881-08
November 17, 2003
11:43
by the addition of a compost material. The poor nutrient status (Table 1) may have played a significant role in restricting the growth of the microbial population.
Changes in Temperature During the Composting Period
Temperatures remained in the mesophilic range through out the composting period. Temperature in the cattle manure compost rose rapidly to 45◦ C during the first eight weeks and then started to decline, reaching 23◦ C on the twentieth week before rising again to 35◦ C. The vegetable waste compost and the control followed the pattern of the diurnal air temperature, decreasing up until the fourteenth week before rising. The temperatures of all the treatments were similar to the daily diurnal temperature of the outside air after the twentieth week, ranging between 12◦ C and 24◦ C in the winter months and between 25◦ C and 35◦ C in the summer months. This partly accounts for the slow rate of degradation and the prolonged period used to completely degrade the contaminant. The low initial temperature can also be attributed to the low microbial activity due to the initial inhibitory effect of the high concentration of creosote (>380 000 mg kg−1 ). The rapid degradation rates observed during the first four months in the cattle manure corresponded with the period of rapid increase in the temperature of the compost. This was more obvious in the vegetable waste compost which showed the highest rate of degradation (30%) on the fourth month when the temperature was about 35◦ C, the highest recorded for the vegetable waste compost. The experiment, which was originally planned for twelve months, was extended to nineteen months because of the continued presence of the more recalcitrant high molecular mass PAHs such as chrysene, benzo(a)pyrene, fluoranthene and pyrene beyond this period. Results obtained (Figure 3) demonstrates that with the exception of chrysene and benzo(a)pyrene, these compounds were removed below detectable limits in both compost systems and that where residual concentrations were detectable, they were below 1 mg kg−1 . Degradation of such high concentrations of creosote would normally have taken more than two years to complete (Overcash, 1979). However, the choice of compost material, improved aeration and closely monitored water content of the soil-compost matrix greatly accelerated the rate of creosote degradation.
CONCLUSIONS Results obtained from this experiment show that compost bioremediation can be used to treat soils heavily contaminated with creosote in a reasonable period of time, including the high molecular mass PAHs. The microorganisms in vegetable waste and cattle manure compost did not differ significantly in their degradation of creosote components. Changes in pH of the compost did not affect the degradation of creosote significantly during the composting period. 897
SSC
TJ881-08
November 17, 2003
11:43
REFERENCES Alef, K. 1995. Soil respiration. In: Alef, K. and Nannipieri, P. (Eds.), Methods in Applied Soil Microbiology and Biochemistry. Academic Press, Harcourt Brace & Company, London, p. 214. Alexander, M. 1977. Introduction to Soil Microbiology. John Wiley and Sons, New York. Alexander, M. 1999. Biodegradation and Bioremediation. Academic Press, San Diego. p. 302. Anderson, J.G. 1991. Treatment of wastes by composting. In: Senior, E. (Ed.), Microbiology of Landfill Sites. CRC Press Inc., Boca Raton, FL, pp. 59–77. Atagana, H.I. 2002. Bioremediation of creosote-contaminated soil by microbial intervention. A PhD thesis submitted to the Department of Microbiology, University of Natal, Pietermaritzburg, South Africa. Atagana, H.I., Haynes, R.J., and Wallis, F.M. 2001. Bioremediation of creosote contaminated soil by indigenous soil fungi. In: Magar, V.S., von Fahnstock, F.M., and Leeson, A. (Eds.), Ex Situ Treatment Technologies. Battelle Press, Columbus, OH. Atagana, H.I., Haynes, R.J., and Wallis, F.M. 2000. Bioremediation of creosote contaminated soils by microbial intervention. In: Wickramanayake, G.B., Gavaska, A.R. Gibbs, J.T. Means, J.L. (Eds.), Case Studies in the Remediation of Chlorinated and Recalcitrant Compounds. Battelle Press, Columbus. Atlas, R.M. and Bartha, R. 1987. Microbial Ecology: Fundamentals and Applications. Benjamin/ Cummings Publishing Company, Menlo Park, CA. Baker, K.H., and Herson, D.S. 1994. Bioremediation. McGraw-Hill, Toronto. Bardos, R.P., Forsythe, S., and Westlake, K. 1996. The co-treatment of municipal and industrial waste. In: de Bertoldi, M., Sequi, P., Lemmes, B., and Papi, T. (Eds.), The Science of Composting. Blackie Academic and Professional, London, pp. 767–783. Cole, M.A., Liu, X., and Zhang, L. 1995. Effect of compost addition on pesticide degradation in planted soils. In: Hinchee, R.E., Anderson, D.B., and Hoeppel, R.E. (Eds.), Bioremediation of Recalcitrant Organic. Battelle Press, Columbus, OH. Criddle, C. 1993. The kinetics of co-metabolism. Biotech. Bioengineering. 41, 1048–1056. Diaz, L.F., Savage, G.M., and Golueke, C.G. 1996. Stabilization of hazardous wastes through biotreatment. In: de Bertoldi, M., Bert, P., and Tiziano, P. (Eds.), The Science of Composting. Blackie Academic and Professional, London, pp. 1152–1156. Eriksson, M., Dalhammar, G., and Borg-Karlson, A.-K. 2000. Biological degradation of selected hydrocarbons in an old PAH/creosote contaminated soil from a gas work site. Appl. Microbiol. Biotechnol. 53, 619–626. Fan, C. and Tafuri, A.N. 1994. Engineering applications of biooxidation processes for treating petroleum contaminated soil. In: Wise, D.L. and Trantolo, D.J. (Eds.), Remediation of Hazardous Waste Contaminated Soils. Marcel Dekker, Inc., New York, p. 929. Hunter, J.V., Finstein, M.S., Suler, D.J., and Bopal, R.R. 1981. Cited by Feinstein, M.S., Miller, F.C., and Strom, P.E. 1986. Waste treatment composting as a controlled system. In: Rhelm, H.J. and Reed, G. (Eds.), Biotechnology, Vol. 8, Microbial Degradation. VCH Publishers, NY, pp. 363–398. Kubota, H. and Nakasaki, K. 1991. Accelerated thermophilic composting of garbage. BioCycle 32, 66–68. Overcash, M.R. 1979. Design of Land Treatment Systems for Industrial Wastes: Theory and Practice. Ann Arbor Science, Ann Arbor, MI. Potter, C.L., Glaser, J.A., Hermann, R., and Dosani, M.A. 1999. Remediation of contaminated East River sediment by composting technology. In: Leeson, A. and Alleman, B.C. (Eds.), Bioremediation Technologies for Polyclic Aromatic Hydrocarbon Compounds. The Fifth International In Situ and On-Site Bioremediation Symposium. San Diego, CA, April 19–22, 1999. Battelle Press, Columbus, OH, pp. 31–36.
898
SSC
TJ881-08
November 17, 2003
11:43
Reid, B.J., Jones, K.C., Semple, K.T., and Fermor, T.R. 1999. Bioremediation potential of PAHs in compost. In: Leeson, A. and Alleman, B.C. (Eds.), Bioremediation Technologies for Polycyclic Aromatic Hydrocarbon Compounds. Battelle, Columbus, OH, pp. 25–30. USEPA. 1997. EPA’s contaminated sediment management strategy. Office of Water and Solid Waste, US EPA, Washington, D.C. USEPA. 1983. Methods for chemical analysis of water and wastes. EPA 600/4-79-020, Washington, D.C. Valo, R. and Salkinoja-Salonen, M. 1986. Bioremediation of chlorophenol-contaminated land. Appl. Microbiol. Biotechnol. 25, 68–75.
899