Coarse-Grained Traffic Matrix Estimation for Data Center Networks I Zhiming Hua,∗, Yan Qiaoa,b,1,∗, Jun Luoa a School
of Computer Engineering, Nanyang Technological University, Singapore of Information and Computer, Anhui Agricultural University, China
b School
Abstract We address the problem of estimating the real-time traffic flows in data center networks (DCNs), using the light-weight SNMP data. Unlike the problem of estimating the traffic matrix (TM) across origin-destination (OD) pairs in ISP networks, the traffic flows across servers or Top of Rack (ToR) switch pairs in DCNs are notoriously more irregular and volatile. Although numerous methods have been proposed in past several years to solve the TM estimation problem in ISP networks, none of them could be applied to DCNs directly. In this paper, we make the first step to solve the TM estimation problem in DCNs by leveraging the characteristics of prevailing data center architectures and decomposing the topologies of DCNs, which makes TM estimation problems in DCNs easy to handle. We also state a basic theory to obtain the aggregate traffic characteristics of these clusters unbiasedly. We propose two efficient TM estimation algorithms based on the decomposed topology and the aggregate traffic information, which improves the state-of-theart tomography methods without requiring any additional instrumentation. Finally, we compare our proposal with a recent representative TM estimation algorithm through both real experiments and extensive simulations, the results show that, i) the data center TM estimation problem could be well handled after the decomposition step, ii) our two algorithms outperforms the former one in both speed and accuracy. Keywords: Data Center Networks, Network Tomography, Traffic Matrix Estimation
1. Introduction As data center networks (DCNs) become increasingly central in cloud computing, both academic and industrial communities have started to explore how to better design and manage them. The main topics include network structure design [2, 3, 4], traffic engineering [5], capacity planning [6], anomaly detection [7], etc. However, until recently, very little is known about the characteristics of traffic flows within DCNs. For instance, how do traffic volumes exchanged by two servers or Top of Rack (ToR) switches vary with time? Which server communicates to other servers the most in DCNs? Actually the real-time traffic matrix (TM) IA
preliminary version of the article has been published in IFIP Networking 2013 [1]. ∗ Correspondence to: Yan Qiao, Zhiming Hu, School of Computer Engineering, Nanyang Technological University, Singapore, 639798, Tel.: +65 97716942 Email addresses:
[email protected] (Zhiming Hu ),
[email protected] (Yan Qiao),
[email protected] (Jun Luo) 1 The work was done when she was a postdoc fellow of SCE NTU. Preprint submitted to Computer Communications
across servers or ToR switches is a critical input to all above network designs and operations. Lack of this information hampers both research and practice. With the increasing demands for the detailed flow level information of DCNs, a few works have studied the flow characteristics of the data centers in their hands [8, 9, 10]. However, the main barrier for them is the difficulty in flow data collection, for the flow level instrumentation is unavailable in most data centers. Besides, installing these additional modules requires substantial development and lots of administrative costs. As the SNMP counters are ubiquitously available in all DCN devices, it is natural to ask if we could borrow from the well known tomography methods [11, 12, 13] and use link level information (such as SNMP bytes counters) to infer the TMs in DCNs. Unfortunately, both Kandula et al.’s experiments in real DCNs [10] and our testbed show that all existing tomography based methods (reviewed in Sec. 2) perform poorly in DCNs. This is due to the irregular flow behaviors and the large quantity of redundant paths between each pair of servers or ToR switches in these networks. February 21, 2014
2. Related Work
In this paper, we demonstrate that the prevailing DCN topologies (including conventional data center architecture [14], Fat-Tree [2], VL2 [3], etc.) can be divided into several clusters, and the complexity of original TM estimation problem can be reduced accordingly. Based on that, we design two efficient algorithms to infer, with high accuracy, the TMs i) across these clusters and ii) among ToR switches within each cluster. Then we verify their performance in our experiments. More specifically, this paper makes the following contributions to the field of data center networking. We decompose DCN topology into several clusters to deal with the large quantity of paths between origindestination (OD) pairs. By doing this, the complexity of the intractable inference problem can be dramatically reduced, and tomography methods may hence be applied. We also state a basic theory that the total traffics exchanged among clusters and within each cluster can both be unbiasedly inferred from the link loads on switches. Such aggregate traffic characteristics are of great significance for the network administrators. For instance, clusters with much more intra traffic may have been well designed, as the intra traffic often costs lower network and computational resources. And the administrators should pay more attention to the clusters that communicate a lot with other clusters, whose traffic may cause relative high network delay. We propose two efficient algorithms to infer the detailed inter and intra clusters’ TMs. The first algorithm, which is more appropriate to infer the TMs without explicit structures, utilizes the aggregate traffic information to calculate a hypothesis flow volume on each path and then refine the assignments by a least square problem. The second one models the inference problem as a state-space network which incorporates both the spatial and temporal structure of TM, and updates the states of TM elements whenever a new observation arrives. Finally, we design several experiments on testbed and extensive simulations in ns-3 to validate the performances of our two proposals. Through comparing with a recent representative TM estimation method, the experiment results show that our two algorithms outperform the former algorithms in both accuracy and speed, especially for large scale TMs. The rest of the paper is organized as follows: we survey the related works in Sec. 2, and present the problem formulation in Sec. 3. In Sec. 4, we present DCN topology decomposition principles. We propose two efficient TM estimation algorithms in Sec. 5 and Sec. 6, respectively and evaluate them through both experiments and simulations in Sec. 7. Finally we give a discussion in Sec. 8 and conclude our work in Sec. 9.
As DCN has recently emerged as an intriguing topic, there are numerous studies working on approaches for traffic engineering [5], anomaly detection [7], provisioning and capacity planning [6], etc. However, almost no existing work has devoted to the traffic measurement approaches, although the estimation of traffic flows is a critical input to all above network designs and operations. Previous studies [8, 9] have exploited the traffic characteristics within DCNs. The former focuses on cloud data centers that host Web services as well as those running MapReduce [15], while the latter considers more generic DCNs such as enterprise and campus data centers. Both of them collected packet traces by attaching a dedicated packet sniffer on the switches in data centers. It is an impractical solution to turn on the packet sniffers all the time since it will consume a lot of switch resources. Therefore, Benson et al. in [9] only selected a handful of locations at random per data center and installed sniffers on them. Kandula et al. [10] studied the nature of data center traffic on a single MapReduce data center. They firstly measure the traffic on data center servers, providing socket level logs. They also question whether TM can be inferred from link counters by tomography methods in DCNs as they perform in the ISP counterpart? If they do so, the barrier to understand the traffic characteristics of data centers will be lowered from the expensive instrumentation to analyzing the more easily available SNMP link counters. Unfortunately, they show with their evaluations that tomography performs poorly for data center traffic, due to the following reasons. • Most existing topography based methods model the traffic flows at the granularity of volumes exchanged by OD pairs, assuming that there is only one path between an OD pair and the routing matrix will always be constant over time. However, this assumption may be violated in DCNs. There are a great number of redundant paths in DCNs to deal with the congestion, and choosing which route depends on the particular scheduling strategy within the network. • To address the under-determined problem in network topography, some methods make additional assumptions such as gravity traffic model [11] and rank minimization [12], both of which perform poorly in DCNs, since servers in data centers do not have the same behaviors as terminals in ISP networks. 2
x(t) and y(t) can be formulated as
Internet Core Switches
y(t) = Ax(t)
Aggregation Switches
t = 1, ..., T,
(1)
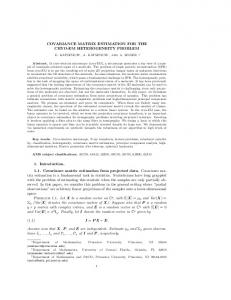
where A is the routing matrix indicating all possible paths between ToR/cluster pairs. Ai j = 1 denotes flow j traverses the switch si , and Ai j = 0 otherwise. Although Eqn. (1) is a typical linear system, it is very difficult to solve. Since the number of equations is much less than the number of variables, the problem is highly illposed. Especially, the case for the conventional data center topologies (as shown in Fig. 1) makes the problem even worse as many ToR switches connect to one or a few high-degree aggregation switches. For example in Fig. 1, the network consists of 8 ToR switches, 4 aggregation switches and 2 core switches. The number of possible paths between all ToR switches is more than 300, while the number of observations is only 14. Moreover, the number of paths grows dramatically with the network scale. When the numbers of corresponding switches double, the number of paths will grow up to thousands. Hence, inferring TMs of DCNs directly from Eqn. (1) is impractical. In the next section, we introduce a novel methodology which turns the intractable problem into an easy one.
Top-of-rack switches
Figure 1: An example of conventional DCN architecture (adopted from Cisco [14]).
• Methods that exploit the spatio-temporal structure of traffic flows [12] often have high time and space complexity, for the elements in the TM were estimated simultaneously under the global constrains. When TM is in large scale, these inference algorithms incur high time and space complexities. Moreover, when new observations or requirements arrive, they need to start over again. In this paper, we aim at designing an efficient tool to infer the traffic flows in DCNs with high accuracy by the ubiquitous SNMP data collected by switches. With the our new but powerful tool, the data center administrators could learn the real-time network traffic details at any moment they need.
4. Data Center Topologies Decomposing Due to the special architecture of prevailing DCNs, the TM across ToR switches can be decomposed to several smaller TMs. The possibility of the decomposition operation is based on the locally tree-like structure of data center topologies. For example in Fig. 1 each ToR connects with two aggregations. Then the two aggregation switches together with 4 ToR switches can form a conditional independent cluster. That is to say, if we know the traffic flows that go in (or out of) agg1 and agg2 , the traffic flows that go in (or out of) ToR1 ∼ ToR4 are independent to the traffic flows going in (or out of) ToR5 ∼ ToR8 . Hence, the DCN topology in Fig. 1 can be decomposed to two clusters as shown in Fig. 2. For architectures such as Fat-Tree [2] and VL2 [3], we can still group aggregation switches with the ToR switches directly connected to them. Therefore, the problem can be turned into inferring the TM across clusters (inter inference) and the TM across the ToR switches intra each cluster (intra inference), both of which are much more determined than the original problem in terms of network tomography. Note that, although the inter and intra TMs that we aim to estimate can reveal most of the traffic characteristics of DCNs, we still could not obtain the traffic
3. Problem Formulation Background We consider a typical DCN as shown in Fig. 1, consisting of ToR switches, aggregation switches and core switches connecting with Internet. We can poll the SNMP MIBs on the network switches for bytes/packetsin and bytes/packets-out at granularities ranging from 1 minute to 30 minutes. The SNMP data can also be interpreted as switch loads equals to the summation of volumes of flows that traverse the corresponding switches. While a fine-grained DCN TM indicates the traffic volumes exchanged between ToRs, we decompose a DCN into clusters and aim at only inferring coarse-grained TMs (among clusters and ToRs in each cluster) from switch loads. We represent switches in the network as S = {s1 , s2 , . . . , sm }, where m is the number of switches. Let y = {y1 , y2 , . . . , ym } denote the traffic loads collected by SNMP counters on the switches, and x = {x1 , x2 , . . . , xn } denote the traffic flow volumes on the paths between ToR switch pairs, where n is the number of all available paths in DCN. xi (t) and y j (t) represent the corresponding traffic at discrete time t. The correlation between 3
y(core1)
hold.
y(core2) xin(c2) xout(c2)
Core Switches Cluster c1
xintra(c2) y(agg1) y(tor1)
y(agg2)
...
y(tor4)
y(agg3) y(tor5)
xintra (ci ) X (yin (tork ) + yout (tork )) − =
Cluster c2
tork ∈TORci
y(agg4)
...
X
xout (ci ) =
X
y(agg j ) −
agg j ∈AGGci
Figure 2: Decomposing the topology in Fig. 1 to two clusters.
y(agg j )
agg j ∈AGGci
xin (ci ) =
y(tor8)
(2) X
X agg j ∈AGGci
yout (tork )
(3)
yin (tork )
(4)
tork ∈TORci
X
y(agg j ) −
tork ∈TORci
The proof can be found in [1]. The aggregate traffic nature of clusters is unbiased and simple in calculation. It is significant to the data center administrators and network designers for making more convincing decisions based on the real-time traffic information.
flows directly if their ends are in different clusters. Instead, we could learn from intra TM that how much traffic that originates from ToRi and goes to another clusters and how much traffic that originates from another cluster and enters in ToR j . We could also learn from inter TM the detailed traffic flows across clusters. We will carry the work on to estimate the TM across ToRs in different clusters in our future work based on the intra and inter TMs. Actually, decomposing data center topology not only reduces the complexity of inference problem but also motivates us to figure out the aggregate traffic characteristics for each cluster, including the total traffic exchanged within each cluster, the total traffic leaving or entering into each cluster. In the rest part of this section, we first give some definitions then state Lemma 4.1 to demonstrate the aggregate traffic information of clusters can be inferred unbiasedly from the loads on switches. Taking Fig. 2 for example, we denote the loads on the i-th core switch and aggregation switch as y(corei ) and y(aggi ), respectively. Here load on the switch is the sum of the in or out traffic of all the interfaces of a switch during a certain interval, which can be obtained by, for example, setting up SPAN on the Cisco switches. This helps us to greatly reduce the traffic generated in the process of “SNMP polling”. Practically, it is easy to distinguish the “in” and “out” traffic flows on ToR switches. We represent the “out” flows which come from servers under ToRi as yout (tori ), and the “in” flows which are transferred to servers as yin (tori ). Obviously, the total loads on ToRi switch y(tori ) = yout (tori ) + yin (tori ). Suppose the underlying DCN can be decomposed to s clusters which are grouped in C = {c1 , c2 , . . . , c s }. AGGci denotes the set of aggregation switches in cluster ci , and TORci is the set of all the ToRs within cluster ci .
5. TM Inference Method Based on Aggregate Traffic Characteristics In this section, we propose an efficient TM estimation algorithm based on the aggregate traffic characteristics (TMCG). The new algorithm first calculates a hypothesis set of TM elements based on the aggregate traffic from Lemma 4.1 and then refines the hypothesis using the constraints of switch observations by solving a least square problem. 5.1. Hypothesis for TM Elements The hypothesis for inter TM elements are calculated based on the gravity traffic model [16]. As we mentioned in Sec. 2, traffic flows across servers or ToR switches in DCNs are revealed to violate the gravity traffic model [10], since the traffic flows are often irregular. However, the DCN after being decomposed operates in a different situation. The inter TM are not as sparse as the TM in the original topology, which is more consistent with the assumptions of gravity model. Moreover, the clusters and cores are likely to play the same roles as the terminals and routers in the Internet. The sub-networks intra clusters have the similar situation as well. Thus, in this section we set the hypothesis for TMs using the gravity traffic model, which will be demonstrated feasible through the experiments in Sec. 7. Gravity models are based on the assumption of a simple proportionality relationship [17] in xi j ∝ yout i · yj ,
Lemma 4.1. Suppose xintra (ci ) is the total traffic exchanged intra the cluster ci , xin (ci ) is the total traffic entering ci from other clusters, and xout (ci ) is the total traffic going out of ci . Then the following equations
(5)
where xi j denotes the traffic from the i-th end to the j-th, yout i denotes the total traffic going out at the i-th end, and yinj denotes the total traffic entering at the j-th end. 4
Suppose there are nk aggregation switches in cluster ck . Then the number of available paths between ToRi and ToR j within a cluster is nk as well, for there is only one hop on each path. We define v = {v1 , . . . , vnk } as the weights of paths that go through the correspondPk ing aggregation switches, where ni=1 vi = 1. The traffic allocated on the k-th path of each hypothesis set is vk · xh (toriout ), vk · xh (toriin ) and vk · xh (tori , tor j ), respectively. Similar to w, the assignments to v depend on the routing strategy applied to the underlying network.
5.1.1. Hypothesis for Inter TM Since we know the out (in) traffic volumes of all clusters from Lemma 4.1, the hypothesis of inter TM elements xh (ci , c j ) can be formulated by xin (c j ) ck ∈C xin (ck )
xh (ci , c j ) = xout (ci ) · P
(6)
Suppose nc is the number of core switches. Since there is only one hop on each path between cluster pairs, there are nc paths from ci to c j . We define a vector of weights w = {w1 , . . . , wnc } for the paths between two clusters, Pc where ni=1 wi = 1. For example, in Fig. 2, there are two paths from c1 to c2 : c1 → core1 → c2 and c1 → core2 → c2 . If we suppose they have the equal weight, then w1 = w2 = 12 . Thus the traffic allocated on the k-th path is wk · xh (ci , c j ).
5.2. Refine Hypothesis TMs by Least Square Problem The intuition to refine the hypothesis of inter and intra TM elements is finding the solution that is closest to the hypothesis and subject to the switch loads we have observed, similar approach was proposed in [11, 18, 19]. This problem can be formulated as a least square problem. For the inter TM, the program can be formulated as
5.1.2. Hypothesis for Intra TM Similar to inter traffic flows, we also model the intra traffic exchanged by ToR switches as gravity traffic model. Different from inter traffic, there is a portion of traffic that goes out of (or enters into) the cluster. Therefore, we partition the total out (or in) loads on i-th ToR switches into two parts: traffic going to (or coming from) ToRs outside the cluster (denoted by xout0 (tori ) or xin0 (tori )) and traffic going to (or coming from) ToRs within the cluster (equal to xout (tori ) − xout0 (tori ) or xin (tori ) − xin0 (tori )). We also define a parameter θkout as the possibility that traffic goes out of cluster ck , and θkin as the possibility of traffic comes from other clusters, which can be calculated by xout (ck ) tor j ∈TORck xout (tor j )
θkout = P
Minimize s.t.
θkin = P
xin (ck ) tor j ∈TORck xin (tor j )
(7)
s.t.
(8)
(9)
and h in xin 0 (tori ) = θk · xin (tori )
(10)
For the intra traffic flows, let xh (tori , tor j ) denote the hypothesis for traffic volumes from ToRi to ToR j within the cluster ck , which can be calculated by xh (tori , tor j ) = (1 − θkout )xout (tori ) ·
(12)
x(C) = [y(core), yout (C), yin (C)]
||x(ci ) − xh (ci )||
(13)
A x(ci ) = [y(AGGci ), y(TORci )] ci
where x(ci ) denotes the vector of directed traffic volumes exchanged by ToR switch pairs within cluster ci , the traffic from each ToR switches going out of cluster ci , and the traffic entering each ToR switch in cluster ci from other clusters. xh (ci ) is the corresponding hypothesis values. Aci is the routing matrix, where each column represents a directed path between two ToR switches within cluster ci . Note that we denote a flow path from ToRi going out of the cluster by a column that only contains the source ToRi and the aggregation switches, and similarly with the flow entering ToRi from other clusters. y(AGGci ) is the vector of loads on aggregation switches in cluster ci . y(TORci ) consists of total in and out traffic loads on ToR switches in cluster ci , the total
The hypothesis for xout0 (tori ) and xin0 (tori ) are h out xout · xout (tori ) 0 (tori ) = θk
A
inter
where x(C) is the vector of directed traffic flows from one cluster to another, and xh (C) is its hypothesis value. Ainter is the routing matrix where each column represents a directed path between a cluster pair. y(core) is the vector of loads on the core switches, yout (C) and yin (C) are the vectors of out and in traffic of each cluster. || · || is the L2 norm of the vector (i.e., the Euclidean distance). For the intra TM of cluster ci , the program can be formulated as Minimize
and
||x(C) − xh (C)||
(1 − θkin )xin (tor j ) xintra (ck ) (11) 5
kx − xh k
Smooth
Xn(t+1)
Y1(t)
Y1(t+1)
...
kAx − yk is minimized
t+1 X1(t+1)
Xn(t)
...
s.t.
Predict
X1(t)
...
Minimize
t
...
traffic entering in and going out of cluster ci , and the total traffic exchanged intra cluster ci . Basically, we want to obtain x that is closest to xh but satisfies the tomographic conditions. This problem can be formulated as follows:
Update Ym(t)
Note that the tomography constraints may not be satisfiable due to noise or error in the collected link counts or the routing matrix. So we choose to minimize the gap between y and Ax in the experiments. To tackle this problem, we first compute the deviation y˜ = y − Axh , then we solve the following constrained least square problem to obtain the deviation x˜ as the adjustments to xh for offsetting the deviation y˜ . Minimize
kA˜x − y˜ k
s.t.
µ˜x ≥ −x
Figure 3: Linear space-state model for TM estimation problem and we add smooth step to the Kalman filter.
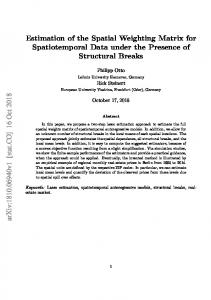
where F is a known matrix, correlating the state x(t + 1) with its state on the last discrete time t. Q is an i.i.d. Gaussian process with covariance matrix σQ , indicating the uncertainty of the relationship. y(t + 1) is the vector of observations on time t+1, which correlates x(t+1) by matrix A. V is also an i.i.d. Gaussian process with covariance matrix σV , representing the observation noise. In our TM estimation problem, we represent the inter (intra) traffic flow on each path as a state, and the switch loads together with the aggregate traffic of clusters as the observations. The state-space network for the TM estimation problem is shown in Fig. 3, where xi (t) denotes the traffic on the i-th path of inter (intra) networks, and y j (t) is the j-th observation. The arrow connecting xi (t) and y j (t) means xi (t) contributes the total traffic of y j (t). Our goal is to estimate the states of x1 (t) ∼ xn (t), t = 1, . . . , T , given the observations y1 (t) ∼ ym (t), t = 1, . . . , T , where n is the number of possible paths and m is the number of observations.
(14)
h
We use a tunable parameter µ, 0 ≤ µ ≤ 1 to make the tradeoff between the similarity to the prior solution and the precise fit to the link loads. The constraint is meant to guarantee a non-negative final estimation x. Finally, x is obtained by making a tradeoff between the prior and the tomographic constraint as x = xh + µ˜x. According to our experience, we take µ = 0.8 to give a slightly more bias towards the prior. 6. Adaptive TM Inference Method based on Linear State-space Model The TM estimation method based on aggregate traffic characteristics simply calculates a solution using the observations on current time slice. The historical observations and solutions would not be used once a new observation set arrives. However, motivated by the studies in [12, 13], we found in our experiments that the traffic flows over multiple time periods also have a spatial and temporal structure as the flows in ISP networks. To leverage this characteristics of TM structure, we model the TM estimation problem as a linear state-space network which always incorporates both historical and fresh observations. We then design an efficient adaptive inference algorithm based on the model to infer the TM with a spatio-temporal structure. 6.1. Modeling The linear state-space network is defined as x(t + 1) = F · x(t) + Q(t) y(t + 1) = A · x(t + 1) + V(t + 1)
Ym(t+1)
6.2. A Variant Kalman Filtering Algorithm Kalman filter is one of the best inference algorithms for linear state-space network. It can achieve an optimal solution to (15) under the assumption that the probability density of the state at every time step is Gaussian. In our model, we assume traffic state xi (t) follows a Gaussian distribution N(µi (t), σi (t)). We treat µi (t) as the estimation of state xi (t), and σi (t) as the uncertainty on the estimation. In the rest of the paper, we use xi (t) uniformly to represent both the state and its mean value. Obviously, the observation y j (t) also follows a Gaussian distribution. The Kalman filtering includes two steps: predict and update. The former predicts the states of traffic flows in the next time slice based on their current states, and the latter updates the predicted states with the new observations [20]. In our traffic inference method, we add a smooth step to the Kalman filter to adjust the states on
(15) 6
if the uncertainty about the predicted state A¯x(t + 1) is small enough, the Kalman filter will incline to the predicted state rather than the observation constraints. The filter keeps refining the uncertainty of the states by measuring the performance of their prediction. In some cases, the Kalman gain matrix calculated by Eqn. (20) does not make any physical sense in our inference model, for substituting it into Eqn. (19) may lead to negative traffic volumes. Therefore, we modify (20) to a least square problem by
preceding time slices using their new updated states in order to refine the TM structure. The relationship of the three steps are shown in Fig. 3. 6.2.1. Predict Step In the first step, the states of traffic flows on the next time slice are calculated by x¯ (t + 1) = Fˆx(t)
(16)
where F is the correlation among traffic flows on adjacent time slices, x¯ (t + 1) is the prediction value using the estimated state xˆ (t) at time t. The diagonal elements of F indicate a temporal correlation within a single flow, while the off-diagonal elements capture the spatial correlation across different traffic flows. Meanwhile, the covariance of states is calculated by 1
σ(t + 1) = [F · σ2 (t) · FT + σ2Q (t)] 2 ,
Minimize s.t.
||K(t + 1)[Aσ2 (t + 1)AT ] − σ2 (t + 1)AT || (21) K(t + 1)i(t + 1) > −¯x(t + 1)
The uncertainty of the states is updated by 1
σ(t + 1) = [(i(t + 1) − K(t + 1)A)σ2 (t + 1)] 2
(17)
(22)
where FT is the transpose of F. 6.2.3. Smooth Step In the last step, we use the new updated states of traffic flows to smooth the preceding states backward. The smooth process is formulated as
6.2.2. Update Step In this step, the states of flows will be updated using the new observations. To learn the gap between the states we expected and their ground truth, we first calculate the deviation between the observations we expected and their true values by i(t + 1) = y(t + 1) − A¯x(t + 1)
x˜ (t) = xˆ (t) + J(t + 1)(ˆx(t + 1) − F · xˆ (t))
(23)
Here x˜ (t) represent the smoothed states of flows on the t time slice. Similar to K, J is called Kalman smooth gain matrix, which can be calculated by
(18)
Here, i(t + 1) is called measurement innovation, which we can use to adjust the predicted state of traffic flows by xˆ (t + 1) = x¯ (t + 1) + K(t + 1)i(t + 1) (19)
J(t + 1) = [σ2 (t) · FT ] · [F · σ2 (t) · FT + σ2Q (t + 1)]−1 (24) We also modify Eqn. (24) to be a least square problem to eliminate the unreasonable results.
Here, K(t + 1) is called Kalman gain matrix, which is chosen by minimizing the posteriori error covariance E(x(t + 1) − xˆ (t + 1))2 , where x(t + 1) is the real states of the traffic flows. Through some regular linear algebra steps, the Kalman gain K(t + 1) can be written as
Minimize s.t.
||J(t + 1)[Fσ2 (t)FT + σ2Q (t + 1)] − σ2 (t)FT || (25) J(t + 1) · [ˆx(t + 1) − F · xˆ (t)] > −ˆx(t)
The uncertainty of the states in last discrete time should also be updated by
K(t + 1) = [σ2 (t + 1)AT ] · [Aσ2 (t + 1)AT + σ2V (t + 1)]−1 , (20) where AT is the transpose of A. The physical meaning of the update step is that: we try to find an optimal state for the traffic flow, which is a tradeoff between the predicted state and the linear-equation constraints. On one hand, if the measurements error covariance σV (t + 1) approaches zero, then the actual measurements y(t + 1) is trusted more and more, while the prediction state A¯x(t + 1) is trusted less and less. On the other hand,
1
σ(t) ˆ = [σ2 (t)+J(t+1)(σ2 (t)−σ2Q (t+1))JT (t+1)] 2 (26) Consider the scalability of the method, we only smooth the flow states of the direct precursor rather than pass the smooth step back to the beginning. In practice, the effect of smooth operation becomes much weaker when it passes to the last but one discrete time. 7
Now we know that the innovation measurement i(t) follows the zero-mean Gaussian process and the covariance is P(t), so we can determine the confidence interval of i j (t) to be ±2P j j (t) with the possibility of at least 95% [20]. More specifically, in each time t, we first compute the i j (t) and P j j (t) for each link, where j is the index of link in the network. Then we check whether the value of ki j (t)k is larger than 2P j j (t). If the answer is yes and it happens for 10 consecutive time slots, we take the model as inaccurate for the present traffic and start an calibration.
6.3. Model Calibration To make the Kalman filter better adapted to different kinds of traffic in different environments, it should be better to train the model listed in Eqn.(15) first before applying the model. More specifically, we need to get the matrix F, A and variables Q, V in Eqn.(15). The matrix A can be derived from the routing schemes in the network, so we only need to obtain the matrix F and variables Q, V. In this paper, we assume the availabilities of flow monitors such as Openflow [21] but it is expensive to turn on and use. So in our algorithm, we only operate the flow monitors for an limited amount of time, which has the chance to gain about 50% of improvement of accuracy while only increasing about 10 − 20% of measurement overhead [13]. In our methods, we let the flow monitors turn on for 24 hours and collect the real traffic measurements of the flows to calibrate the model in Eqn.(15). And we get the data of n flows and the SNMP counters y for T time slices. After that, we use the EM algorithm, which computes the maximum likelihood estimation of parameters, to compute the matrix F and variables Q, V given the observations of y and real flow data measurements x. The details of the EM algorithm can be found in [22].
6.5. Algorithm Pseudocode Algorithm 1 describes the adaptive TM estimation algorithm based on Linear State-space model (TMLS). We first use the real measurements to calibrate the model and get the initial inputs x(0) for the first time slice in line 1. The algorithm then predicts the state of x(t) based on x(t −1), and updates the state of x(t) by the observation y(t) in line 3 and 4, respectively. After that, line 5 performs the smooth backwards to the flow states x(t−1) using their corresponding new states. Finally, we check whether the requirements to recalibrate are meet. If it does, we start a recalibration (line 6). Note that, Algorithm 1 unifies both inter and intra TM estimation by substituting the input parameters by the inter or intra TM parameters.
6.4. Innovation In the real DCNs, it is possible that the traffic pattern changes and the parameters are not applicable any more. In this case, we need to turn on the flow monitors for 24 hours to recalibrate the model. Here we use the innovation measurement as stated before to determine whether and when we need to recalibrate the model to get the new matrix F and variables Q, V. As link counters y can be measured in the network for each interval, we can judge whether recalibrate is necessary by computing the gap between real measurements y and the estimated link count y¯ . Recall that measurement innovation is the deviation between the observations we expected and their true values. So namely the gap between y and y¯ is the measurement innovation as stated before, then if we combine it with Eqn.(18), we can get the following
Algorithm 1: Adaptive TM Inference Algorithm Based on Linear State-space Model Input: y(1 : k), A, T Output: x 1 Calibrate the model to get x(0), F,σ(0), σQ (0), σV (0). 2 for t = 1 to T do 3 [x(t)] ← Predict(x(t − 1), σ(t − 1), σQ (t − 1)) 4 [x(t), σ(t)] ← U pdate(x(t), y(t), σ(t), σV (t)) 5 [x(t − 1), σ(t − 1)] ← S mooth(x(t − 1), x(t), σ(t − 1), σ(t), σQ (t − 1)) 6 If the requirements of recalibration is satisfied, start a calibration process.
i(t + 1) = y(t + 1) − y¯ (t + 1) = y(t + 1) − A¯x(t + 1), (27) where i(t + 1) is a zero-mean Gaussian process and the covariance of i(t + 1) can be computed as 1
P(t + 1) = [σ2V (t + 1) + Aσ2 (t + 1)AT ] 2 .
7. Experiments and Simulations 7.1. Algorithms and Metrics
(28)
We implement our two TM estimation algorithms: TMCG and TMLS, together with a recent representative TM estimation algorithm—Sparsity Regularized Matrix Factorization (SRMF for short) [12] which leverages the
P(t+1) is an m×m matrix, with the diagonal elements Pii (t) denoting the covariance of the measurement innovation of link i at time t. 8
Spatio-temporal structure of traffic flows, and utilizes the compressive sensing method to infer the missing data in TM by rank minimization. The TM estimation problem that we aim to address is a special case that all elements in TM are missing. In our experiments, the SRMF algorithm can not provide a result in a limited time (more than 24 hours) when apply it directly to the data center tomography problem, simply because the number of columns of the origin routing matrix is more than 15000 while the number of its rows is only 56. Therefore, we apply all the three algorithms on the decomposed data center topology, and reconfigure the parameters of the TM estimation problem based on Lemma 4.1. We quantify the performance of the three algorithms from three aspects: The cumulative distribution of relative error (RE), the mean relative error (MRE), and the computing time. The relative error (RE) is formulated as REi = |xi − xˆi |/xi
Figure 4: Our testbed with 10 switches and more than 300 servers.
We gather the SNMP link counts for all the switches. We also record the flows exchanged between servers through socket level logs in each server (not a scalable approach) to form the ground truth for both inter TM and intra TM. The data are all collected every 5 minutes.
(29)
7.2.2. Experiment Results Fig. 5(a) plots the relative error in inter TM estimation for three algorithms. Clearly, our proposed two algorithms both outperforms SRMF. More than 90% of relative errors are less than 0.25. For TMLS (Kalman) incorporates inference with real measurements, it has a slightly better performance than TMCG. And maybe the TM of inter clusters is not low-rank, SRMF has the worst performance of the three. We then study the relative error in intra cluster TM estimation for three algorithms in Fig. 5(b). Again, our two algorithms both have a better performance than SRMF. However, as we can see that TMLS (Kalman) has a long tail in this figure, which is due to the high error rate in the innovation process. When there are some transient changes, it may first face consecutive errors and spend another 24 hours to recalibrate the model to react to the changes of the traffic. Similar results are also reported in [13]. In Fig. 6, we pick up two flows for intra and inter traffics respectively, and we compare the results of several TM estimation algorithm against the ground truth. We can clearly see that the estimated values of our two algorithm are much closer to the ground truth than SRMF in almost all the time slices; this is consistent with the CDF plots in Fig. 5.
Here xi denotes the true TM element and xˆi is the corresponding estimated value. The mean relative error (MRE) introduced by [23] can be calculated by MRE =
1 X |xi − xˆi | · nε x >ε xi
(30)
i
The sum is taken over the flow volumes larger than a threshold ε, and nε is the number of elements that larger than ε. In our experiments, we set ε to 10 packets, which mask most minor flows that we do not concern, such as some small ACK flows. The algorithm’s MRE indicates the global deviation of the estimation from the ground truth. For the computing time, we measure the time period starting from when we input the topologies and link counts to the algorithm until the time when all TM elements are returned. All three algorithms are implemented by Matlab (R2012a) on 6-core Intel Xeon CPU @2.93GHz, with 12GB of memory and the Mac OS X 10.6.5(10H574). 7.2. Experiments 7.2.1. Experiment Setup We use a testbed with 10 switches and about 300 servers as shown in Fig. 4 for our experiments. And the architecture for this testbed DCN is a conventional tree similar to Fig. 1. The testbed hosts a variety of services such as hadoop [15], multimedia and so on.
7.3. Simulations 7.3.1. Simulation Setup We adopt the conventional data center architecture [14] to conduct our simulations, but our methods 9
1
0.8
0.8
0.6
0.6
CDF
CDF
1
0.4 TMLS TMCG SRMF
0.2 0 0
0.5
1
1.5
0.4 TMLS TMCG SRMF
0.2 0 0
2
0.5
1
1.5
2
Relative Error
Relative Error (a) Estimation for inter traffic matrix.
(b) Estimation for intra traffic matrix
Figure 5: The relative error of the three algorithms on testbed. 8
9
x 10
10 TMLS TMCG SRMF Truth
2
Estimated Flow Size
Estimated Flow Size
2.5
1.5 1 0.5 0 0
50
100
x 10
6 4 2 0 0
150
TMLS TMCG SRMF Truth
8
50
100
150
Time Slices
Time Slices
(a) Estimation for inter traffic matrix.
(b) Estimation for intra traffic matrix.
Figure 6: Ground truth is in green, estimations are in red, black and blue.
are also applicable to other data center architectures such as Fat-Tree [2], VL2 [3] and so on. The topology is a medium scale data center with 32 ToR switches, 16 aggregation switches and 8 core switches. For a rack, there are 20 servers connecting to each ToR switch, where the link capacities are set to be 1Gbps. At the meantime, the capacities of the links between switches are also 1Gbps. We generate the traffic flows based on the study of the traffic characteristics of DCNs [8, 9, 10]. Specifically, we randomly select 1 ∼ 10 server(s) under each ToR switch, and let them generate flows to all of other servers; the numbers of packets within the flows that go out of the cluster follow the distribution Log-N(4, 1), while the numbers of packets for the flows exchanged within a cluster follow Log-N(10, 1); the size of each packet is around 1400 bytes. We use TCP flows to simulate the real data center traffic since most of the data center traffic is TCP traffic [24]. For routing strategies, we use ECMP [25], which is widely used in DCNs. Therefore, we set the weights of paths between two ends to be equal. We record the total number of packets that enter and go out of each switch in the network every 5 minutes. We also record the total packets of flows on each path
in the corresponding time periods as the ground truth. 7.3.2. Simulation Results Fig. 7 and Fig. 8 compare the relative errors of the three algorithms inferring the TMs with different numbers of time slices. From the figures we can see that both our two algorithms outperform SRMF on all kinds of networks. The promising results are partially due to the fact that our algorithms make use of the aggregate flow information obtained by Lemma 4.1. More specifically, TMCG leverages the aggregate data to obtain the more accurate hypothesis flow values on every time slice, and TMLS utilizes the aggregate data in its update step when a new observation arrives. From the figures, we can also find that both our two algorithms perform better in intra TM estimation than in inter TM estimation; this is because the difference between the number of unknown variables and available measurements is smaller in the intra TM estimation problem. For the intra TM estimation, we can see from Fig. 7(a) and Fig. 8(a), when the number of time slices increases, the gap between SRMF and our two algorithms becomes even larger. That shows that the performance 10
1
0.8
0.8
0.6
0.6
CDF
CDF
1
0.4 TMLS TMCG SRMF
0.2 0 0
0.5
1
1.5
0.4 TMLS TMCG SRMF
0.2 0 0
2
0.5
Relative Error
1
1.5
2
Relative Error
(a) Estimation for intra traffic matrix
(b) Estimation for inter traffic matrix
1
1
0.8
0.8
0.6
0.6
CDF
CDF
Figure 7: The relative error of the three algorithms for estimating traffic matrix with 3 time periods.
0.4 TMLS TMCG SRMF
0.2 0 0
0.5
1
1.5
0.4 TMLS TMCG SRMF
0.2 0 0
2
Relative Error
0.5
1
1.5
2
Relative Error
(a) Estimation for intra traffic matrix
(b) Estimation for inter traffic matrix
Figure 8: The relative error of the three algorithms for estimating traffic matrix with 25 time periods.
of SRMF degrades as TM elements expands, and it cannot handle the large quantity of missing data well. TMLS performs even better when TM gets larger, for the reason that it adaptively updates the old TM elements when new observation arrives, and it keeps refining the flow states and their uncertainty in order to make a reasonable tradeoff between the estimations and the observations. Thus as the time goes on, it could capture the spatial and temporal structure of traffic flows more accurately. And for the inter TM estimation, it seems that the our algorithms only perform slightly better than SRMF in the inter TM estimation in Fig. 8(b). However, the computation time spent by our two algorithms is far less than SRMF, which is key factor for online inference and we will show it later.
converge as the number of time slices increases. TMCG has the best performance on MRE, as it always recomputes the hypothesis flow volumes using the new observations and the unbiased aggregate traffic information. Therefore, the results with large deviation could be adjusted timely when the new observations arrive. In Fig. 9(a), SRMF performs better at the beginning of the the time period. However, its MRE tends to be larger as the time passes. For the reason that in DCN, the larger TM with more time slices may not be low rank as the corresponding smaller one. Therefore, the deviation between the TM with the lowest rank and the ground truth TM becomes larger when time goes on. Moreover, the computing time of SRMF is also unacceptable in large TM estimation, that is why we could not present the curve of SRMF in the long term period in Fig. 9(b).
We then compare the MRE of the three algorithms in Fig. 9. From the two figures we can see that although TMLS algorithm can accurately estimate most of the TM elements in some cases, its average accuracy is not always the highest of the three algorithms. That is to say a small part of TMLS’s results have a relative large deviation. However, the MRE of TMLS is going to
Table 1 lists the computing times of the three algorithms. We can see from Table 1, TMCG finishes the inference much faster than the other two algorithms, and its computing time seems not be affected much by the TM scale. SRMF runs relatively faster when the scale of TM is small. However, its computing time increases 11
20
2.5 2
15
1.5
MRE
MRE
TMLS TMCG
TMLS TMCG SRMF
1
10 5
0.5 0 0
10
20
30
40
0 0
50
50
100
150
200
250
Number of Discrete Times
Number of Discrete Times (a) Short term for the three algorithms
(b) Long term for the two algorithms
Figure 9: The mean relative error for the three (two) algorithms over different terms of time periods.
Table 1: The computing time of the three algorithms (Seconds).
Number of time slices TMCG TMLS SRMF
5 0.01 12.59 45.79
10 0.01 22.88 176.84
inter TM 24 42 0.03 0.05 50.81 89.46 1528.71 6341.20
100 0.18 200.90 -
5 0.10 5.58 2.02
10 0.34 11.85 26.45
intra TM 24 42 0.40 0.56 26.73 53.46 147.06 470.12
100 0.81 102.54 -
TM over all clusters are much more than the elements in the inter TM. This also implies that decomposing the inference problem into several smaller one greatly helps the structure based methods to handle the problem.
drastically when TM becomes larger. When the number of time periods goes up to 100, SRMF cannot finish the inference within a day. Although TMLS runs relatively slower at the beginning, its computing time grows linearly with the TM scale, which is one of the most valuable advantages of TMLS. In other words, TMLS can be applied to on-line TM estimation problem, where it incorporates the new SNMP information and adjusts the direct precursor at each round. We could estimate from Table 1 that each round of updating (adjusting the last column and adding a new column) needs about 2 seconds and 1.3 seconds for inter TM estimation and intra TM estimation, respectively. Therefore, although TMLS requires 200.90 seconds to infer the inter TM over 100 time periods, actually it only takes 2 seconds for each period to update and smooth the TM to get the inference result in the next period. On the contrary, SRMF algorithm can only be applied to the off-line inference problem as it needs to start over on each discrete time period.
8. Discussion The calibration and innovation process of TMLS need the availability of flow monitors such as OpenFlow [21], which only lead to the increase of about 1020% of measurement overhead but may gain about 50% of accuracy [13]. For the networks that no flow monitors are available, we can also use TMLS to get reasonable inference results by the following ways. First, we can use some empirical matrix F and noise variables Q, V to conduct the experiments, which is applicable to the cases that we are familiar with the characteristics of the traffic. Second, we can try to use the gravity model to get the coarse flow data first and then use the data to train the Kalman filter. Even though flow data infered by gravity model is not absolutely accurate, but generally the trending of traffic flows is accurate [13] and transient changes can be also captured by gravity model. So it is still helpful for training the Kalman model and achieving a promising result. We can choose the TMLS or TMCG based on the traffic characteristics or the type of applications in DCNs. When comes to the traffic characteristics, TMLS
It is notable that TMLS and SRMF compute much faster in intra TM estimation problem than in the inter counterpart, for the number of possible paths between all cluster pairs is much larger than their intra paths. Therefore, their speeds are determined with the TM scale. However TMCG performs exactly the opposite way, due to its speed only correlates with the total number of TM elements. And the total elements in intra 12
is more adaptable for traffic with explicit structures. And the traffic characteristics in inter TM and intra TM do have some different characteristics [9], so maybe we can combine TMLS and TMCG to infer the intra TM and inter TM, respectively. In terms of applications, TMCG is able to react to transient changes quickly and accurately, so it is better suited to applications like anomaly detection. While for the applications such as traffic engineering and capacity planning, the accuracy of the mean of the flows is more important than trending of the flows. So for these applications, TMLS may offer a better performance [13].
[5] M. Al-Fares, S. Radhakrishnan, B. Raghavan, N. Huang, A. Vahdat, Hedera: Dynamic Flow Scheduling for Data Center Networks, in: Proc. of USENIX NSDI, 2010. [6] J. W. Jiang, T. Lan, S. Ha, M. Chen, M. Chiang, Joint VM Placement and Routing for Data Center Traffic Engineering, in: Proc. of IEEE INFOCOM, 2012, pp. 2876–2880. [7] P. Gill, N. Jain, N. Nagappan, Understanding Network Failures in Data Centers: Measurement, Analysis, and Implications, in: Proc. of ACM SIGCOMM, 2011, pp. 350–361. [8] T. Benson, A. Anand, A. Akella, M. Zhang, Understanding Data Center Traffic Characteristics, ACM SIGCOMM CCR 40 (2010) 92–99. [9] T. Benson, A. Akella, D. A. Maltz, Network Traffic Characteristics of Data Centers in the Wild, in: Proc. of ACM IMC, 2010, pp. 267–280. [10] S. Kandula, S. Sengupta, A. Greenberg, P. Patel, R. Chaiken, The Nature of Data Center Traffic: Measurements & Analysis, in: Proc. of ACM IMC, 2009, pp. 202–208. [11] Y. Zhang, M. Roughan, N. Duffield, A. Greenberg, Fast Accurate Computation of Large-scale IP Traffic Matrices from Link Loads, in: Proc. of ACM SIGMETRICS, 2003, pp. 206–217. [12] Y. Zhang, M. Roughan, W. Willinger, L. Qiu, Spatio-temporal Compressive Sensing and Internet Traffic Matrices, in: Proc. of ACM SIGCOMM, 2009, pp. 267–278. [13] A. Soule, A. Lakhina, N. Taft, K. Papagiannaki, K. Salamatian, A. Nucci, M. Crovella, C. Diot, Traffic Matrices: Balancing Measurements, Inference and Modeling, in: Proc. of ACM SIGMETRICS, 2005, pp. 362–373. [14] C. D. C. Infrastructure, 2.5 Design Guide, 2007. URL: http://goo.gl/kBpzgh. [15] J. Dean, S. Ghemawat, MapReduce: Simplified Data Processing on Large Clusters, Proc. of USENIX OSDI (2004). [16] J. P. Kowalski, B. Warfield, Modelling Traffic Demand between Nodes in a Telecommunications Network, in: Proc. of ATNAC95, Citeseer, 1995. [17] M. Roughan, A. Greenberg, C. Kalmanek, M. Rumsewicz, J. Yates, Y. Zhang, Experience in measuring backbone traffic variability: Models, metrics, measurements and meaning, in: Proc. of ACM IMW, ACM, 2002, pp. 91–92. [18] D. Jiang, C. Jun, H. Linbo, An Accurate Approach of Largescale IP Traffic Matrix Estimation, IEICE transactions on communications 90 (2007) 3673–3676. [19] D. Jiang, X. Wang, L. Guo, Mahalanobis Distance-based Traffic Matrix Estimation, European Transactions on Telecommunications 21 (2010) 195–201. [20] A. Soule, K. Salamatian, A. Nucci, N. Taft, Traffic Matrix Tracking using Kalman Filters, ACM SIGMETRICS Performance Evaluation Review 33 (2005) 24–31. [21] N. McKeown, T. Anderson, H. Balakrishnan, G. Parulkar, L. Peterson, J. Rexford, S. Shenker, J. Turner, OpenFlow: Enabling Innovation in Campus Networks, ACM SIGCOMM CCR 38 (2008) 69–74. [22] R. Shumway, D. Stoffer, Dynamic Linear Models with Switching, Journal of the American Statistical Association 86 (1991) 763–769. [23] A. Gunnar, M. Johansson, T. Telkamp, Traffic Matrix Estimation on A Large IP Backbone: A Comparison on Real Data, in: Proc. of ACM IMC, 2004, pp. 149–160. [24] M. Alizadeh, A. Greenberg, D. A. Maltz, J. Padhye, P. Patel, B. Prabhakar, S. Sengupta, M. Sridharan, Data Center Tcp (DCTCP), in: Proc. of ACM SIGCOMM, 2010, pp. 63–74. [25] C. Hopps, Analysis of an Equal-Cost Multi-Path Algorithm, 2000.
9. Conclusion In this paper, we have enabled the tomography based methods to handle the TM estimation problem for DCNs from ubiquitous SNMP data. We have argued that the prevailing DCN topologies can be decomposed into several clusters. Hence the complexity of inference problem can be dramatically reduced. We have also stated a basic theory to demonstrate the aggregate traffic characteristic of each cluster can be calculated unbiasedly using the SNMP data. Two efficient algorithms are proposed to infer the structured and un-structured TMs, respectively. Through comparing our two algorithms with a recent representative TM estimation method, the experimental results show that our two algorithms outperform the former one in both accuracy and efficiency. Moreover, our methods can make the online inference through updating the TM elements on the last time period within a few seconds, while the former method requires hours to start over a new inference. Acknowledgment This work is supported in part by AcRF Tier 1 Grant RG 32/09 and AcRF Tier 2 Grant ARC15/11. References [1] Y. Qiao, Z. Hu, J. Luo, Efficient Traffic Matrix Estimation for Data Center Networks, in: Proc. of IFIP Networing, 2013. [2] M. Al-Fares, A. Loukissas, A. Vahdat, A Scalable, Commodity Data Center Network Architecture, in: Proc. of ACM SIGCOMM, 2008, pp. 63–74. [3] A. Greenberg, J. R. Hamilton, N. Jain, S. Kandula, C. Kim, P. Lahiri, D. A. Maltz, P. Patel, S. Sengupta, VL2: A Scalable and Flexible Data Center Network, in: Proc. of ACM SIGCOMM, 2009, pp. 51–62. [4] C. Guo, G. Lu, D. Li, H. Wu, X. Zhang, Y. Shi, C. Tian, Y. Zhang, S. Lu, BCube: A High Performance, Server-centric Network Architecture for Modular Data Centers, in: Proc. of ACM SIGCOMM, 2009, pp. 63–74.
13