pose a novel, two-tiered coarse-to-fine (CTF) classification cascade framework to ... 1. INTRODUCTION. Colon cancer and lung cancer are the top two leading.
Coarse-to-Fine Classification via Parametric and Nonparametric Models for Computer-Aided Diagnosis Meizhu Liu Le Lu Xiaojing Ye Shipeng Yu Heng Huang Siemens Medical Solutions Inc, Malvern, PA 19355, USA University of Florida, Gainesville, FL 32611, USA University of Texas, Arlington, TX 76013, USA ABSTRACT
1.
Classification is one of the core problems in Computer-Aided Diagnosis (CAD), targeting for early cancer detection using 3D medical imaging interpretation. High detection sensitivity with desirably low false positive (FP) rate is critical for a CAD system to be accepted as a valuable or even indispensable tool in radiologists’ workflow. Given various spurious imagery noises which cause observation uncertainties, this remains a very challenging task. In this paper, we propose a novel, two-tiered coarse-to-fine (CTF) classification cascade framework to tackle this problem. We first obtain classification-critical data samples (e.g., samples on the decision boundary) extracted from the holistic data distributions using a robust parametric model (e.g., [13]); then we build a graph-embedding based nonparametric classifier on sampled data, which can more accurately preserve or formulate the complex classification boundary. These two steps can also be considered as effective “sample pruning” and “feature pursuing + kNN/template matching”, respectively. Our approach is validated comprehensively in colorectal polyp detection and lung nodule detection CAD systems, as the top two deadly cancers, using hospital scale, multi-site clinical datasets. The results show that our method achieves overall better classification/detection performance than existing state-of-the-art algorithms using single-layer classifiers, such as the support vector machine variants [17], boosting [15], logistic regression [11], relevance vector machine [13], k-nearest neighbor [9] or spectral projections on graph [2].
Colon cancer and lung cancer are the top two leading causes of cancer deaths in western population. Meanwhile, these two cancers are also highly preventable or “curable” if detected early. Image interpretation based cancer detection via 3D computer tomography has emerged as a common clinical practice, and many computer-aided detection tools for enhancing radiologists’ diagnostic performance and effectiveness are developed in the last decade [4, 9, 11, 15, 17]. The key for radiologists to accept the clinical usage of a computer-aided diagnosis (CAD) system is the high detection sensitivity with reasonably low false positive (FP) rate per case. This paper mainly focuses on the classification aspect of CAD. We explain that Why CAD is an important yet domain-specific classification problem as follows. 1), In CAD scenario, positive examples (i.e., true cancers) in large population screen are very rare and precious, thus high sensitivity (recall) is a must-to-have feature to make CAD meaningful. 2), On the other hand, CAD is legally used as a second-assisted tool for radiologists, which hopes to improve radiologists’ overall performance but mostly relies on them to disambiguate false positives from CAD1 . CAD findings (with only < 1% true positives) can be very expense burden for radiologists, lowering their confidence, and without effectively guiding them to real detections. Therefore it is equivalently important to archive sensibly low false positive rate per case (e.g., 2 ∼ 5). 3), To better address doctor’s final decision support on CAD and even his/her own findings, an ideal setup is to make the system capable of retrieving similar or counterpart lesions when available. For such consideration, we argue that nearest neighbor (NN) or template matching (TM) type nonparametric classification methodology will be a more sensible choice by precisely modeling all distributional information of rare positives for classification. This is a more complete representation, versus discriminative models (e.g., SVM [17] and RVM [13]) with linear or nonlinear parametric decision boundaries, which is prone to overtraining given small number of positives. However, there are two fundamental problems needed to be solved to make nonparametric classification method robust. 1), There are dominating numbers of false positives initially (from a highly sensitive candidate-generation process), which not only can effect the performance negatively also makes the computation slow. 2), It is well known that NN and TM
Categories and Subject Descriptors Industrial and Application Paper [Knowledge Management (KM)]:
Keywords computer-aided diagnosis, coarse-to-fine classification, class regularized graph embedding, total Bregman divergence (tBD) clustering , t-centers
Permission to make digital or hard copies of all or part of this work for personal or classroom use is granted without fee provided that copies are not made or distributed for profit or commercial advantage and that copies bear this notice and the full citation on the first page. To copy otherwise, to republish, to post on servers or to redistribute to lists, requires prior specific permission and/or a fee. CIKM’11, October 24–28, 2011, Glasgow, Scotland, UK. Copyright 2011 ACM 978-1-4503-0717-8/11/10 ...$10.00.
INTRODUCTION
1 A clinical report stating the reason to dismiss or accept each CAD findings is required in the workflow.
are very sensitive to the feature space or subspace where matching distance or (dis-)similarity metrics are computed. We propose and comprehensively evaluate a novel coarseto-fine classification framework. The method consists of the following two steps, in both training and testing. (1) Sample Pruning: Parametric classification models (e.g., logistic regression [11], boosting [15], support/relevance vector machines [13]) are trained on the complexly distributed datasets as coarse, distribution-level classification. The goal is not to assign class labels, but to prune data samples to select more “classification-critical” candidates, which are expected to preserve the decision boundary in the high dimensional feature space (thus vast numbers of samples lying far from classification boundary are discarded 2 ). (2) Feature Pursuing + kNN/Template Matching: We first apply feature selection and graph embedding methods jointly to find intrinsic lower dimensional feature subspace that preserves group-wise data topology, and then employ nonparametric classifiers for final classification, using kNN or template matching. We argue that more precisely modeling the intrinsic geometric of decision boundary, by graph embedding and nonparametric classifiers in a finer level, can potentially improve the final classification performance. The overall process is illustrated as follows Samples → Sample pruning → Feature selection → Class regularized graph embedding → kNN/Template matching We applied our proposed framework on colon polyp and lung nodule detection, using two large scale clinical datasets collected from multiple clinical sites across continents.
2.
SAMPLE PRUNING USING PARAMETRIC RVMMIL
We start by developing a “coarse” classifier for sample pruning using a parametric model. Considering the specific characteristics of CAD classification problems, in this paper we use the RVMMIL approach [13] which is a powerful extension to integrate feature selection and handle multiple instance learning (MIL). In RVMMIL, the probability for an instance xi to be positive is p(y = 1|xi ) = σ(a0 xi ), where σ is the logistic function defined as σ(t) = 1/(1 + e−t ) and a0 xi is the linear dot-product between data feature vector xi and model coefficient vector a. For the contents of sparse feature selection and multiple instance learning in RVM, we refer the readers to [13]. From our coarse-to-fine classification model, RVMMIL is adopted as the coarse-level cascade classifier for sample pruning, i.e., we will remove samples xi satisfying 2 This is related with using nearest neighbor analysis to find data samples either near the decision boundary or in local neighborhoods [18], then training SVM classifiers on reduced or clustered datasets. However we perform sample pruning by selecting data upon their classification scores/confidences of a learned parametric model that is well studied, more robust and stable, compared with nearest neighbor (NN) clustering method, especially in high dimensional space. For example, the neighborhood size selection and defining sensible distance measure problems in NN are non-trivial.
p(y = 1|xi ) < ρˆ. This step can eliminate massive amount of negatives without effecting much on sensitivity, by choosing a balanced ρˆ. The remained data samples p(y = 1|xi ) ≥ ρˆ are either true positives (at high recall) or “hard” false positives, lying close to the classification boundary, which will largely impact the final classification accuracy. Note that other classifiers with confidence estimates, as boosting [15] and regularized SVM [17], are also applicable.
3.
FEATURE SPACE PURSUIT
Our goal of feature pursuit is to estimate intrinsic, lower dimensional feature subspace of data for later sensible nonparametric classification, while preserves generative datagraph topology. This is the key to achieve superior classification performance with simple nonparametric classifiers. In the proposed framework it consists of two steps: feature selection and class regularized graph embedding. Feature Selection: By applying feature selection, only a compact subset of highly statistical relevant features is retained, to simplify the later graph embedding or feature projection process. There are many feature selection techniques, we use Maximum Relevance Minimum Redundancy (MRMR) feature selection algorithm [10] due to its empirical good performance and computational efficiency. Given a set of features F = {fi }, its MRMR feature subset H maximizes the following objective κ: κ(H, y) = γ(H, y) − γ(H),
(1)
where γ(H) = γ(H, y) =
1 m2
X
γ(fi , fj ),
(2)
fi ,fj ∈H
1 X γ(fi , y), m
(3)
fi ∈H
and m is the total number of elements in H. Due to space limit, refer the algorithm details to [10]. Class Regularized Graph Embedding: We propose and exploit a new Class Regularized Graph Embedding (CRGE) scheme to project data (after feature selection) into an even lower dimensional subspace, where data samples from the same class getting closer and samples from different classes moving apart, to make NN or TM more robust and semantically interpretable, as shown later. In Graph embedding, feature projections can be learned in many different ways. We follow the principle that keeps the locality of nearby data and maps apart data further in the graph-induced subspace, which is similar to Laplacian Eigenmap [1, 3] and Locality Preserving Projection [6]. Given a set of N points X = {x1 , x2 , · · · , xN } ⊂ Rn , and a symmetric N × N matrix W which measures the similarity between all pairs of points in X . The set X and matrix W compose a graph G, with X as vertices and W as weights of the edges. The conventional graph embedding method will map X to a much lower dimensional space Y = {y1 , y2 , · · · , yN } ⊂ Rn˜ , n ˜ ¿ n. The optimal Y should minimize the loss function L(Y) which is defined as X L(Y) = kyi − yj k2 Wij , (4) i,j
under some appropriate constraints. Though performed well in many applications [3, 6], the limitation of Eq. (4) is that
it does not penalize the similarity between points belonging to different classes. For this means, we propose class regularized graph embedding (CRGE) to find a mapping φ : X 7→ Y, such that φ minimizes the function E(Y) defined as X X E(Y) = kyi − yj k2 Wij − kyi − yj k2 Wij , i,j∈S i,j∈D (5) subject to: kYkF = 1. where i, j ∈ S means xi and xj belong to the same class, and i, j ∈ D means xi and xj are in different classes. k· kF is the Frobenius norm. To avoid notation clutter, we rewrite (5) and get X min kyi − yj k2 Wij Hij , (6)
index [12], given by index = intra =
i,j
where Ci is the ith cluster with center zi . Each cluster is represented as the tBD center, termed t-center [7], which is the `1 norm median of all samples in the corresponding cluster. For example, if {yi }N i=1 is the set of samples, then its t-center z is z = arg min
δf (y1 , y2 ) =
(7)
Plugging (7) into (6), we get X min kM 0 xi − M 0 xj k2 Wij Hij , (8)
subject to: kM kF = 1 , where the constraint kM kF = 1 eliminates the scaling effect. Eq. (8) can be solved very quickly using gradient descent technique along with iterative projections [14]. The computation of W is chosen in the following manner, to fit our problem specific need. W (i, j) = x0i xj /kxi kkxj k .
(9)
Finally, we argue that our stratified approach which prunes non-informative or redundant features, using feature selection from an information-theoretic aspect, before feature graph embedding or projection, can simplify the optimization process of graph embedding on a reduced feature set. This strategy may achieve better overall results, compared from the joint sparsity-constrained graph embedding (as SPG) [2].
4.
(10)
N X
δf (˜ z , yi ),
(11)
i=1
where δf is the total Bregamn divergence generated by some convex and differentiable generator function f :
The mapping function φ(x) can be linear or nonlinear, and We use linear mapping because of its simplicity and generality, such as
i,j
ky − zi k2 ,
i=1 y∈Ci
z ˜
where Hij is the Heaviside function and ½ 1, if i, j ∈ S Hij = . −1, if i, j ∈ D
M
N
inter = min kzi − zj k2 ,
i,j
y = φ(x) = M 0 x, M ∈ Rnטn , n ˜ ¿ n.
intra , inter c 1 X X
(12)
Here, we use f (y) = kyk2 , and hence δf becomes the total square loss [7] and the t-center in Eq. (11) becomes p N X 1/ 1 + 4kyi k2 p z= ai yi , where ai = P . (13) ( j 1/ 1 + 4kyj k2 ) i=1 Template Matching via kNN Voting: Given a test sample yi , we need to find its k nearest neighbors from the t-centers. Suppose the neighbors are {z1 , z2 , · · · , zk } and the corresponding distance from yi to the neighbors are {d1 , d2 , · · · , dk }. We define the empirical probability of yi being positive as p, and P (zj is positive) 1/dj P p= P . (14) (zj is positive) 1/dj (zl is negative) 1/dl + Based on the p value, we can draw the FROC curve of sensitivity and FP rate per case for training and testing datasets. Eq. (14) is a soft kNN voting scheme using the reciprocal of distance 1/di . We found that t-centers are more robust as they lead to preserve better sparsity and diversity of CAD lesion data distribution than proximity data samples (as in kNN). The number of nearest neighbors k is chosen during the training/validation stage, by maximizing the partial Area Under FROC Curve (AUC): k = arg max AUC(FPrate ∈ [2, 4]).
NONPARAMETRIC CLASSIFICATION
The naive KNN classification on data instances, in feature space Y = φ(x), performs poorly due to unbalanced number of rare positives and dominating negatives. Thus we propose to do KNN voting using learned templates from clustering. Clustering & Templates: Our previous total Bregman divergence (tBD) clustering algorithm [7] is utilized here. tBD is based on the orthogonal distance between the convex generating function of the divergence and its tangent approximation at the second argument of the divergence, which is naturally robust and leads to efficient algorithms for soft and hard clustering. Denote that c1 clusters, with 1 the cluster centers {zi− }ci=1 , are obtained for negatives; and 2 c2 clusters with centers {zj+ }cj=1 for positives. The numbers of clusters c1 ,c2 is chosen to minimize the intra-inter-validity
f (y1 ) − f (y2 ) − hy1 − y2 , ∇f (y2 )i p . 1 + k∇f (y2 )k2
˜ k
5.
(15)
EXPERIMENTAL RESULTS
Our CTF classification frame is evaluated on representative large scale colon polyp and lung nodule datasets, collected from dozens of hospitals across US, Europe and Asia. Colon Polyp Detection & Retrieval: The colon polyp dataset contains 134,116 polyp candidates obtained from an annotated CT colonography (CTC) database of 429 patients. Each sample is represented by a 96-dimensional computer extracted imagery feature vector, describing its shape, intensity pattern, segmented class-conditional likelihood statistics and other higher level features [11, 8, 15, 17]. There are 1,116 positives out of the 134,116 samples. The CAD sensitivity is calculated at per-polyp level for all actionable
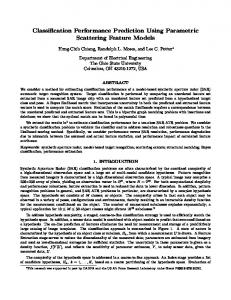
polyps ≥ 6mm (i.e., polyp is classified correctly at least from one view), and the FP rate counts the sum of two (pronesupine) scans per patient. The colon polyp dataset is split into training and testing datasets with no overlapping. Upon obtaining the parametric RVMMIL model [13], we get the probability (or classification score) of each instance being positive. Then we perform thresholding and only consider candidates with p(y = 1|xi ) ≥ ρˆ = 0.0157 as a classification cascade with high-recall. A total of 3,466 data samples are retained, pruned from 134,116 polyp candidates on the training dataset. All the 554 true positive lesion instances are contained, along with other “harder” negatives, having higher classification scores. For fine-level classification, we learn the mapping function φ : X 7→ Y after feature selection using the pruned dataset, and the t-centers are fitted in the reduced Y feature space for the soft kNN classifier. We plot the FROC curves comparing using RVMMIL as a single classifier, using SPG as a integrated sparsity and dimension reduction approach, and our two-tiered coarseto-fine classifier, on training and testing datasets, as shown in Fig. 1 Left. For validation, the testing results demonstrate that our CTF method can increase the sensitivity of RVMMIL by 2.58% (from 0.8903 to 0.9161) at the FP rate = 4, or reduce the FP rate by 1.754 (from 5.338 to 3.584) when sensitivity is 0.9097, which are statistically significant improvements for colorectal cancer detection. It also clearly outperforms other state-of-the-arts, e.g. SPG [2] as shown in Fig. 1, as well as [11, 13, 15, 17]. To fully leverage the feature space topology-preserving property of the lower-dimensional embedding Y, we also test it for polyp retrieval, which is defined as giving a query polyp in one prone/supine scan, to retrieve its counterparts in the other view. To achieve this, we find the k nearest neighbors (kNN) of a query yi ∈ Y using the classified polyps, and check whether the true match is inside the neighborhood of kNN. If the true matched polyp is in the kNN, a ‘hit’ will occur. We record the retrieval rate, as the ratio of the number of ‘hit’ polyp divided by the query polyp number, at different k levels. Especially, high retrieval rate with small k can greatly alleviate radiologists’ manual efforts on finding the counterpart same polyp, with better accuracy. To demonstrate its advantage, we employ a conventional geometric distance feature based polyp retrieval scheme, namely geodesic distance that measures the geodesic length of a polyp to a fixed anatomical point (e.g., rectum), along the colon centerline. The retrieval rate comparison is illustrated in Fig. 1 Middle, for both training and testing datasets. The results indicate that the retrieval accuracy can achieve 80% when only 2 to 4 neighbors are necessary. This shows that nonparametric kNN in Y subspace based retrieval significantly improves the conventional polyp matching scheme, contingent on geometric computation of geodesic distance and the SPG based retrieval. Lung Nodule Classification: The lung nodule dataset is collected from 1, 000+ patients from multiple hospitals in different countries, using multi-vendor scanners. Before sample pruning, there are 28, 804 samples of which 27, 334 are negatives and 1, 470 are true nodule instances from 588 patients in training dataset. The testing dataset contains 20, 288 candidates, with 19, 227 are negatives and 1, 061 are positives of 412 patients. Several instances may correspond to the same lung nodule in one volume. All types of solid, partial-solid and Ground Glass Nodules with a diam-
eter range of 4-30mm are considered. Each sample has 112 informative imagery features, including texture appearance features (e.g. as the moments of responses to a multiscale filter bank [5]), shape (e.g. width, height, volume, number of voxels), location context (e.g. distance to the wall, at the right or left of the wall), gray value, and morphological features. First, FROC analysis by using our proposed coarse-to-fine classification framework, compared to singlelayer RVMMIL classifier, for the lung nodule classification in training and testing is shown in Fig. 1 Right. We can see that the testing FROC of CTF dominates the RVMMIL FROC, when the FP rate ∈ [3, 4], with 1.0 ∼ 1.5% consistent sensitivity improvements. We also compared with the SPG framework, and the FROC analysis is shown in Fig. 2 Left. The comparison also shows the higher classification accuracy of our proposed method. Furthermore, our CTF classification performance compares favorably with other recent developments in lung CAD [4]. Next, we compare our method to a related locality-classification framework, SVMkNN [18] which shows highly competitive results on image based multiclass object recognition problems. SVM-kNN uses kNN to find data clusters as nearest neighbors and train a support vector machine (SVM) on each locality group for “divide-and-conquer” classification [18]. The comparison results are illustrated in 2 Middle, which shows that our method outperforms the SVM-kNN method on both lung training and testing datasets. Finally, we evaluate the effects of using t-center (default), mean or median as estimated templates in CTF. The comparison in testing using the lung dataset is shown in Fig. 2 Right. The comparison validates that t-center outperforms the templates formed by typical mean or median method.
6. CONCLUSIONS & FUTURE WORK Our main contributions are summarized in three folds. First, we introduce a new coarse-to-fine classification framework for computer-aided (cancer) detection problems by robustly pruning data samples and mining their heterogeneous imaging features. Second, we propose a new objective function to integrate the between-class dissimilarity information into embedding method. Third, two challenging large scale clinical datasets on colon polyp and lung nodule classification are employed for performance evaluation, which show that we outperform, in both tasks, the state-of-the-art CAD systems [4, 9, 11, 15, 17] where a variety of single parametric classifiers were used. For future work, we plan to investigate optimizing the fine-level classification in an associate Markov network [16] setting, which integrates structured prediction among data samples (i.e., graph parameters are jointly learned with classification).
7.
REFERENCES
[1] M. Belkin and P. Niyogi. Laplacian Eigenmaps for Dimensionality Reduction and Data Representation. Neural Computation, pages 1373–1396, 2003. [2] D. Cai, X. He, and J. Han. Sparse Projections over Graph. Proceedings AAAI Conference on Artificial Intelligence, pages 610–615, 2008. [3] D. Cai, X. He, Y. Hu, J. Han, and T. Huang. Learning a Spatially Smooth Subspace for Face Recognition. IEEE Computer Vision and Pattern Recognition, pages 1–7, 2007. [4] B. V. Ginneken and et al. Comparing and Combining Algorithms for Computer-aided Detection of Pulmonary
FROC on Colon Polyp Classification
Retrieval Rate on Colon Polyp Matching
0.93
FROC on Lung Nodule Classification 0.92
RVMMIL Training
0.92
0.9
SPG Training
SPG Testing CTF Testing
Sensitivity
0.89
0.88
0.87
0.86
0.8
CTF Training
0.7
Sensitivity
Retrieval Rate
RVMMIL Testing
0.9
RVMMIL Training
0.915
CTF Training 0.91
CRGE−KNN Training CRGE−KNN Testing
0.6
GeodesicDist Traing DeodesicDist Testing SPG Training
0.5
SPG Testing 0.4
CTF Testing 0.905
0.9
0.895
0.89
0.885
0.3
0.88
0.2
0.85
RVMMIL Testing
0.91
0.875
0.84
0.1
2
2.5
3
3.5
4
4.5
5
1
2
3
4
5
6
7
8
9
10
2.6
2.8
3
3.2
Number of Neighbors
FP rate
3.4
3.6
3.8
4
4.2
4.4
FP Rate
Figure 1: Left: FROC comparison of using our proposed CTF method, single-layer RVMMIL [13] classifier and spectral projection on graph (SPG) [2] on classifying the training and testing datasets of colon polyps, with FP rate ∈ [2, 5]. Middle: Nearest neighbor based retrieval comparison of using our proposed CTF method, Geodesic distance, and spectral projection on graph (SPG) [2] on colon polyp retrieval, in training and testing. Right: Partial FROC analysis using our proposed CTF method and RVMMIL classifier, in training and testing of the lung nodule dataset, with FP rate ∈ [2.6, 4.5] FROC on Lung Nodule Classification
FROC Comparison on Lung Nodule Classification
FROC on Lung Nodule Classification (Testing) 0.925
RVMMIL t−center (CTF) Mean (CTF) Median (CTF)
0.92 0.92
RVMMIL Training
SVM−kNN Training
0.915
CTF Training
RVMMIL Testing SPG Testing
Sensitivity
Sensitivity
CTF Training 0.91
0.92
RVMMIL Training
SPG Training
CTF Testing 0.905
0.9
0.895
0.89
0.91
RVMMIL Testing
Sensitivity
0.915
SVM−kNN Testing CTF Testing
0.91
0.905
0.9
0.89
0.9
0.895
0.885
0.89 0.88
0.88
0.885 0.875 2.6
2.8
3
3.2
3.4
3.6
FP Rate
3.8
4
4.2
4.4
0.87 2.5
3
3.5
FP Rate
4
0.88
2.8
3
3.2
3.4
3.6
3.8
4
4.2
4.4
4.6
FP Rate
Figure 2: Left: FROC analysis using our proposed CTF method, RVMMIL classifier and SPG in training and testing of the lung nodule dataset. Middle: FROC analysis using our proposed CTF method, RVMMIL classifier and SVM-kNN classification scheme, in training and testing [18]. Right: FROC analysis using t-center, mean or median as estimated templates in CTF, compared with RVMMIL classifier in testing.
[5]
[6] [7]
[8]
[9]
[10]
[11]
Nodules in Computed Tomography Scans: The ANODE09 Study. Medical Image Analysis, pages 707–22, 2010. B. V. Ginneken, B. M. T. H. Romeny, M. A. Viergever, and M. Ieee. Computer-aided diagnosis in chest radiography: A survey. IEEE Transactions on Medical Imaging, 20(12):1228–1241, 2001. X. He and P. Niyogi. Locality Preserving Projections. In Advances in Neural Information Processing Systems, 2003. M. Liu, B. vemuri, S. Amari, and F. Nielsen. Total Bregman Divergence and its Applications to Shape Retrieval. IEEE Computer Vision and Pattern Recognition, 2010. L. Lu, J. Bi, M. Wolf, and M. Salganicoff. Effective 3D Object Detection and Regression Using Probabilistic Segmentation Features in CT Images. IEEE Computer Vision and Pattern Recognition, 2011. K. Murphy and et al. A large-scale evaluation of automatic pulmonary nodule detection in chest CT using local image features and k-nearest-neighbour classification. Medical Image Analysis, pages 670–70, 2009. H. Peng, F. Long, and C. Ding. Feature Selection Based on Mutual Information: Criteria of Max-dependency, Max-relevance, and Min-redundancy. IEEE Transactions on Pattern Analysis and Machine Intelligence, pages 1226–1238, 2005. V. F. V. Ravesteijn, C. V. Wijk, F. M. Vos, R. Truyen, J. F. Peters, J. Stoker, and L. J. V. Vliet. Computer Aided
[12]
[13]
[14] [15] [16] [17]
[18]
Detection of Polyps in CT Colonography Using Logistic Regression. IEEE Transactions on Medical Imaging, 2010. S. Ray and R. H. Turi. Determination of Number of Clusters in K-means Clustering and Application in Colour Image Segmentation. Proceedings of the 4th International Conference on Advances in Pattern Recognition and Digital Techniques, pages 137–143, 1999. V. Raykar and et al. Bayesian Multiple Instance Learning: Automatic Feature Selection and Inductive Transfer. Proceedings of International Conference on Machine Learning, pages 808–815, 2008. R. Rockafellar. Convex Analysis. Princeton University Press, 1970. G. Slabaugh and et al. A Robust and Fast System for CTC Computer-Aided Detection of Colorectal Lesions. Algorithms, 3(1):21–43, 2010. B. Taskar, V. Chatalbashev, and D. Koller. Learning Associative Markov Networks. Proceedings of International Conference on Machine Learning, 2004. S. Wang, J. Yao, and R. Summers. Improved Classifier for Computer-aided Polyp Detection in CT Colonography by Nonlinear Dimensionality Reduction. Medical Physics, pages 35:1377–1386, 2008. H. Zhang, A. Berg, M. Maire, and J. Malik. SVM-KNN: Discriminative Nearest Neighbor Classification for Visual Category Recognition. IEEE Computer Vision and Pattern Recognition, 2:2126–2136, 2006.