To the best of our knowledge, COBRA is the first implementation of a HPM-based .... Performance Monitoring (HPM) to guide binary optimiza- tion at runtime. ..... for windows. the 3rd Workshop of Feedback-Directed and. Dynamic Optimization ...
COBRA: An Adaptive Runtime Binary Optimization Framework for Multithreaded Applications Jinpyo Kim, Wei-Chung Hsu, Pen-Chung Yew Department of Computer Science and Engineering University of Minnesota, Twin-Cities Minneapolis, MN, 55455 {jinpyo,hsu,yew}@cs.umn.edu
Abstract This paper presents COBRA (Continuous Binary ReAdaptation), a runtime binary optimization framework, for multithreaded applications. It is currently implemented on Itanium 2 based SMP and cc-NUMA systems. Using OpenMP NAS parallel benchmark, we show how COBRA can adaptively choose appropriate optimizations according to observed changing runtime program behavior. Coherent cache misses caused by true/false data sharing often limit the scalability of multithreaded applications. This paper shows that COBRA can significantly improve the performance of some applications parallelized with OpenMP, by reducing the aggressiveness of data prefetching and by using exclusive hints for prefetch instructions. For example, we show that COBRA can improve the performance of OpenMP NAS parallel benchmarks up to 68%, with an average of 17.5% on the SGI Altix cc-NUMA system.
1 Introduction As we enter the era of multi-core and many-core systems that could provide two to hundreds of processing units for multithreaded programs to exploit, compiler optimizations have to improve not only the performance of each thread but also the overall performance of multithreaded applications. Due to the changes in the number of threads and data working set size during parallel execution, dynamic parallel program behavior makes it difficult for a static compiler to generate a high-performance binary for multiprocessor systems. To cope with this problem, adaptive dynamic optimizations could be used during various stages of program development and deployment such as system libraries, algorithms, and compilation. Recently, with the advent of profile-guided optimizations using Hardware Performance Monitors (HPM), re-optimizing the binary at runtime has been proved to be a promising approach. It could adapt a binary according to its changing program behavior in data
working set sizes and system configurations. In prior works [5, 17, 9, 12, 24], most of dynamic optimization systems, such as Dynamo [5] and ADORE [17], are developed to improve the performance of singlethreaded applications. In order to explore the potential benefit of dynamic optimizations on multithreaded applications, we proposed a runtime binary optimization framework, called COBRA (Continuous Binary Re-Adaptation). It is currently implemented on Itanium 2 based 4-way SMP server and SGI Altix cc-NUMA systems. COBRA is a trace-based user-mode dynamic binary optimization system similar to the ADORE [17]. COBRA collects dynamic profiles from each thread using HPM and analyzes them to find system-wide performance bottlenecks. Currently, the performance events monitored include coherent memory accesses and system bus contention. The aggregated dynamic profiles are fed into a runtime optimizer to generate optimized binary traces. These optimized binary traces are stored in a trace cache in the same address space as the binary program being optimized. The binary program is then patched and redirected to the optimized traces during the execution. We implemented two different dynamic binary optimizations in COBRA. The first optimization uses dynamic profile information to select appropriate prefetch hints related to coherent memory accesses. As more processing cores and larger cache memories are being integrated on chip, coherent memory accesses could limit the scalability of parallel programs. If a program experiences frequent coherent misses due to truly-shared and false-shared data, even larger caches cannot help to reduce such bus accesses. Cache coherent L2 write misses could lead to L3 misses especially in invalidation-based cache coherence protocols. Itanium 2 supports .excl hint for lfetch instruction to prefetch a cache line in exclusive state instead of the usual shared state for the later write operations. However, their effectiveness largely depends on program runtime behavior. The second optimization reduces the aggressiveness of prefetching. Modern compilers have been very aggressive in generating data prefetch instructions to hide potential
large memory latency from cache misses for each thread. However, such aggressive prefetching in a thread could exert tremendous stress on system bus if most of its prefetches turn out to be useless or unnecessary. This might have no effect on a single core system, but could have devastating effect on a multi-core system. Using dynamic profiling at runtime, we could identify and eliminate those unnecessary prefetches from a processor and free up bus and memory bandwidth for other processors. To demonstrate the feasibility and potential benefits of the COBRA framework, we use OpenMP NAS parallel benchmarks on a 4-way SMP server and a SGI Altix ccNUMA system. The contributions of this paper are as follows: • Using OpenMP version of the DAXPY kernel, we show that static compiler generated binaries cannot provide consistent performance in the presence of changing runtime environment. The runtime binary optimizer could adapt the binary better to the changing runtime behavior. • To the best of our knowledge, COBRA is the first implementation of a HPM-based runtime binary optimization framework for multithreaded applications. We discuss the trade-offs in the design of a robust and scalable runtime binary optimizer that includes: thread monitoring, dynamic profiling, trace management, system-wide dynamic compiler optimizations, and code deployment. • We implemented two dynamic compiler optimizations to reduce the impact of coherent memory accesses in OpenMP NAS parallel benchmarks. The optimizations improve the performance of OpenMP NAS parallel benchmarks (BT, SP, LU, FT, MG, CG) up to 15% with an average of 4.7% on 4-way Itanium 2 SMP server, and up to 68% with an average of 17.5% on SGI Altix cc-NUMA system. The rest of this paper is organized as follows: Section 2 presents the motivation for runtime binary optimization targeting multithreaded applications. Section 3 presents details of the COBRA framework. Section 4 discusses how to detect and optimize for coherent misses using the COBRA runtime binary optimizer. Section 5 presents the experimental setup and discusses the results. Section 6 summarizes related works. Section 7 concludes the paper.
2 Motivation Aggressive data cache prefetching could be very effective for applications such as dense matrix-oriented numerical applications since their memory access patterns are highly predictable on single-processor systems. However, in a multiprocessor environment with multi-level caches,
it becomes less predictable because the dynamic behavior heavily depends on the system bus traffic and the coherent misses generated from both true-sharing and false-sharing data accesses. for (j=0; j < 1000000; j++) #pragma omp parallel for for (i=0; i < ARRAY_SZ; i++) { y[i] = y[i] + a * x[i]; }
Figure 1. OpenMP DAXPY C source code First, let us use an OpenMP version of the DAXPY kernel, shown in Figure 1, as an example to illustrate the changing memory access behavior when it runs with different input data sets and different number of threads. The source code is compiled with the Intel icc compiler ver. 9.1 with -O2 -openmp options. ARRAY SZ is varied to create different data working set sizes from 128K to 2M bytes. The number of working threads is varied from 1 to 4. Each thread is bound to a different processor. ... lfetch.nt1 [r10] lfetch.nt1 [r11] lfetch.nt1 [r14] lfetch.nt1 [r15] lfetch.nt1 [r16] lfetch.nt1 [r17] ... .b1_22: { .mii (p16)ldfd f32=[r2],8 nop.i 0 nop.i 0 } { .mmb (p16)ldfd f38=[r33] (p16)lfetch.nt1 [r43] nop.b 0 ;; } { .mfi (p23)stfd [r40]=f46 (p21)fma.d f44=f6,f37,f43 (p16)add r41=16,r43 } { .mib (p16)add r32=8,r33 nop.i 0 br.ctop.sptk .b1_22 ;; }
// prefetch y[0]+648 // prefetch y[0]+520 // prefetch y[0]+392 // prefetch y[0]+264 // prefetch y[0]+136 // prefetch y[0]+8
// load x[i], i++
// load y[i] // prefetch x[i]+1200, y[i]+1200
// store y[i] // y[i] + a*x[i] // increment lfetch address // increment y[i] address // inner for loop (SWP)
Figure 2. icc compiler generated Itanium assembly code for DAXPY kernel Figure 2 shows its Itanium assembly code generated by the Intel icc compiler. Before entering the software pipelined loop (.b1 22), the generated code has 6 prefetches for the initial cache line of y[0] and the subsequent five cache lines. Then, in the loop, the code issues one prefetch instruction per iteration for both arrays x[] and y[], using the rotating registers to alternately change the prefetch target addresses. This prefetch is very aggressive. It targets 9 cache lines ahead of the current array references. Toward the end of loop execution, this prefetch instruction starts to fetch unnecessary cache lines that would be modified by its neighboring processors. Therefore, this prefetch would trigger unnecessary coherent misses. For example, with 128KB data working set with two arrays x[] and y[], each array has
Normalized execution time to baseline
2.00 1.80 1.60 (1, prefetch) (1, noprefetch) (2, prefetch) (2, noprefetch) (4, prefetch) (4, noprefetch)
1.40 1.20 1.00 0.80 0.60 0.40 0.20 0.00 128K
512K
2M
data working set size
(a) prefetch vs. noprefetch
Scalability of DAXPY Kernel on 4-way Itanium 2 Machine (#of threads, prefetch without/with .excl hints) Normalized execution time to baseline
Scalability of DAXPY Kernel on 4-way Itanium 2 Machine (# of threads, with/without prefetch) 1.20 1.00
(1, prefetch) (1, prefetch.excl) (2, prefetch) (2, prefetch.excl) (4, prefetch) (4, prefetch.excl)
0.80 0.60 0.40 0.20 0.00 128K
512K
2M
data working set size
(b) prefetch vs. prefetch.excl
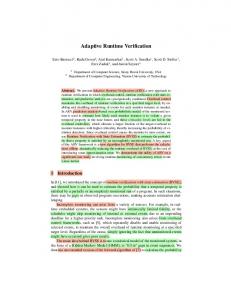
Figure 3. Normalized execution time of OpenMP DAXPY kernel on 4-way Itanium 2 SMP server 64KB data. When running with 4 threads, each array has 16KB data. Since the L2 cache line size on Itanium 2 is 128 bytes, 9 unnecessary cache lines amount for 1KB. Therefore, significant portion of data is unnecessarily shared between processors due to aggressive prefetching. In Figure 3(a), we compare two versions of the binaries. The baseline binary code generated by the Intel icc compiler has lfetch instructions. In the noprefetch version, the lfetch instructions are changed to NOP instructions. Figure 3(a) shows the normalized execution time of the two versions. The x axis shows different working set sizes including both arrays x[] and y[]. In the three different working set sizes, ranging from 128KB, 512KB and 2MB, two versions exhibit very different behaviors. With the smallest 128KB working set, the data would fit within the 256KB L2 cache memory. When only one thread is present, the two versions do not have much performance difference since no cache misses would occur after initialization. Since the noprefetch version does not cause unnecessary data sharing between processors caused by aggressive data prefetching shown in Figure 2, it runs 35% faster than the baseline prefetch version when running with 2 threads, and 52% faster with 4 threads. Such unnecessary coherent misses could be avoided by more careful optimizations. For example, the compiler could use conditional prefetches to nullify the prefetches if the addresses are outside the intended range. However, conditional prefetch generation is more expensive, since it requires one more register, one more compare instruction, two more add operations and at least one additional bundle. Unless the static compiler has a very accurate profile indicating precisely which prefetches are likely to cause this problem, the compiler will not generate such conditional prefetches. The compiler can also generate multi-version code to select the noprefetch version when the iteration count is small. This is to avoid the performance degradation from unnecessary coherence misses caused by aggressive prefetching. When the iteration count is large, the benefit of data prefetching could outweigh the downside of prefetching-
induced coherence misses. Figure 3(b) shows the impact of using lfetch.excl instruction on OpenMP DAXPY kernel shown in Figure 1. The lfetch.excl instruction prefetches a cache line in the Exclusive state instead of the Shared state. When a prefetch operation with .excl hint misses the cache, it requests the cache line in the Exclusive state. If a store operation soon follows the load operation, it will not trigger an invalidation. For each working set size from 128KB to 2MB, the performance is normalized to 1-thread prefetch version. With a 128KB working set, data accesses hit in the L2 cache. The lfetch.excl optimization made no performance difference. But the lfetch.excl version runs 18% faster than the baseline prefetch version when running with 2 threads, and 14% faster with 4 threads. With a 512KB working set, data no longer fit in one single L2 cache. But they fit in four L2 cache memories with 128KB each when the program is running with 4 threads. When we increase the number of threads from 2 to 4, the overhead of coherent misses starts to outweigh the benefit of prefetching. Therefore, the lfetch.excl version runs 7% faster than the baseline prefetch version when running with 4 threads. Since the use of lfetch.excl could increase the number of writebacks in L2, it could result in longer latency for the store instructions. That is why the version with lfetch.excl is slower than the baseline prefetch version. With a 2MB working set, data sharing effect is relatively small because aggressive prefetching would result in a sharing of only the last 10 cache lines. In this case, due to the increased L2 cache writebacks, using lfetch.excl causes a slowdown of the program. As shown in this example, a correct application of lfetch.excl instructions could be very challenging to a static compiler. This is why .excl prefetch hints are usually used only in numeric libraries written by expert programmers. However, the dynamic optimizer has more accurate information to guide the use of such prefetch hints. This example clearly shows that a single binary generated by one of the most advanced optimizing compilers cannot always provide good performance under different execution conditions. The performance opportunities left to be
Figure 4. COBRA framework exploited could be very significant. This is rather different from the single processor scenario where aggressive data prefetching is usually considered useful without too much downside. This is why most compilers will perform aggressive data prefetching by default. As our example shows, unwanted prefetches could cause coherent misses, and thus substantially slow down the execution. It is difficult for programmers to analyze and evaluate the impact of performance caused by the change in data working sets and number of threads/processors. A runtime binary optimizer such as COBRA could identify performance bottlenecks and hot spots through continuous performance monitoring, and effectively tune the performance via runtime code optimization.
3 The COBRA Framework COBRA (COntinuous Binary Re-Adaptation) is a tracebased user-mode dynamic optimization system similar to ADORE [17]. It also uses profiles generated by Hardware Performance Monitoring (HPM) to guide binary optimization at runtime. It is implemented as a shared library on Linux and could be automatically preloaded before other shared libraries are loaded at the program startup time. Since COBRA is designed to concurrently monitor multiple threads on multiprocessors, its design of thread monitoring, profile processing and trace management are significantly different from other binary optimizers for singlethreaded applications such as ADORE. Furthermore, optimization decisions are based on profiles collected from multiple threads to determine if a system-wide optimization is warranted. Figure 4 illustrates the major functional blocks of the
COBRA framework. It includes components for monitoring, profiling, trace management, code optimization and code deployment. The monitoring component collects performance information with the support of OS and the hardware performance monitors. It sends data to the profiler. The profiler gathers data cache and instruction cache miss information, branch histories, and hardware performance counters. The trace management component maintains prospective binary traces that can be optimized. Optimizer generates new optimized binary traces and stored them in the code cache. Profiler and optimizer closely interact with each other in order to optimize for more effective code layout and less data cache miss stalls. As shown in Figure 4, two types of supporting threads are invoked for a multi-threaded program. One is an optimization thread that orchestrates profile collection and runtime optimizations. This thread is created during program startup time. The other is a group of monitoring threads that monitors working threads. A monitoring thread is created when a working thread is forked. If an application program executes with four threads, one optimization thread and four monitoring threads will be created by COBRA. The functions of two types of threads are explained in the following subsections.
3.1
Monitoring Threads
The code optimizer in the COBRA framework mainly relies on accurate dynamic profile collected from the monitoring threads. The monitoring threads continuously sample the performance counters and record data cache miss events to guide binary optimizations. On an Itanium 2 processor, four performance counters can be used to monitor hundreds of processor performance events including CPU cycles, the number of retired instructions, stall cycles for each backend instruction pipeline stage. To build hot traces for binary trace optimizations, monitoring threads also sample Branch Trace Buffer(BTB) that keeps track of four address pairs from the last four taken branches and branch targets. Each monitoring thread tracks signals from the perfmon [2] sampling kernel drivers. Once it catches a signal, it stores the content of performance counters from the kernel memory area to a user memory area, called User Sampling Buffer (USB). Each sample consists of a sample index, Program Counter (PC) address, process ID, thread ID, processor ID, four performance counters, eight BTB entries, data cache miss instruction address, miss latency, and miss data cache line address. The process ID, thread ID and processor ID are used to tag each sample for a better and more precise understanding of each thread in the multithreaded application. The four performance counters could be used to track performance bottlenecks. For example, using the number of L2 and L3 misses per 1000 instructions could track the changes in cache miss patterns for detecting changes in data working sets and their access behavior. The eight BTB entries are used for building hot execution traces
for later optimizations. Data cache miss instruction, data address, as well as miss latency are accumulated to pinpoint which exact instructions cause the most of cache misses. ADORE [17, 11] used this information to find the delinquent loads that generate the most of data cache misses.
3.2
Optimization Thread
The optimization thread orchestrates the overall initialization, trace selection, optimization, and trace cache management. Notably, there is only one optimization thread in our initial implementation. This design choice simplify its implementation, and enables centralized control over multiple monitoring threads. At start up, all hardware performance counters are initialized by perfmon sampling kernel device driver. The list of available processors is registered in a shared memory area. The Kernel Sampling Buffer is also allocated in the shared memory area. The memory pages allocated to the Kernel Sampling Buffer may reside in different processing nodes. We rely on the OS to migrate memory pages into relevant processor nodes. For example, SGI Altix cc-NUMA system uses a first-touch policy to pin a memory page to the first processor that accesses the memory page. This scheme works well if each thread initializes its portion of Kernel Sampling Buffer during initialization phase. Trace selection highly depends on the type of optimization applied to the collected traces. Since our current optimizations mainly focus on adapting data prefetching on hot loops that consume most of execution time, trace formation and selection algorithms are tuned to discover hot loops and leading execution paths to the loops. The BTB profiles from Itanium 2’s HPM are particularly useful to build loop traces with relatively less frequent sampling that keeps the overall overhead low.
4 Optimization of Coherent Memory Accesses Some recent processors provide special instructions to optimize cache coherent memory accesses. However, due to the lack of runtime profiling support to pinpoint the instructions that cause such unnecessary memory coherent traffic, these instructions are rarely used in static compiler optimizations. Itanium 2 supports .bias hint for integer load instructions. When a load operation with .bias hint misses the cache, it requests the cache line in the exclusive state, i.e. it will invalidate all of the existing copies of the cache line, instead of the regular shared state. If a store operation soon follows the load operation, and it writes to the same cache line, it will not trigger a coherent bus transaction to invalidate the cache lines in other processors. The .bias hint is not supported for control- and data-speculative loads (ld.s and ld.a), the load check (ld.c), the load with acquire semantics (ld.acq), and floating point loads. Therefore, the use of
.bias hint is very limited. Itanium 2 processor also provides .excl hint for lfetch prefetch instruction. The lfetch.excl instruction prefetches a cache line in the Exclusive state in stead of the Shared state. Depending on the sequence of load and store operations, the use of .excl hint might lead to more system bus transactions because shared cache lines are invalidated. Therefore, this type of optimizations relies heavily on accurate run-time profile. On Itanium 2, there are several hardware performance counters related to coherent bus events. For example, BUS RD HIT, BUS RD HITM, and BUS RD INVAL ALL HITM, record the snooping responses from other processors to the bus transaction initiated by the monitoring processor [1]. The hardware performance counter corresponding to the BUS MEMORY event, monitors the number of bus transactions. If we divide the sum of coherent bus events by the total number of bus transactions, we could estimate the ratio of coherent memory accesses to all bus transactions. We could use this ratio to decide whether to perform the optimization to coherent cache misses. Other processors, such as IBM Power3, also support the monitoring of cache coherent events. The PM SNOOP L2 E OR S TO I and PM SNOOP M TO I events could be used to measure the total number of L2 cache invalidations. On Itanium 2 systems, once we detect intensive coherent misses, we could use Data Event Address Registers (DEARs) to pinpoint which instructions caused most of coherent cache misses. The DEAR can be used to monitor any of L1 data cache load misses, FP load misses, L1 data TLB misses, or ALAT (Advanced Load Address Table) misses. Each DEAR sample contains an instruction address that caused the cache miss, its data address and associated latency. The DEAR can be programmed to filter out unwanted events. For example, L3 cache hit latency on Itanium 2 is 12 cycles, we could filter out on-chip L2 cache misses that hit in L3 cache by programming the DEAR to track events with latency greater than 12 cycles. This filtering scheme could avoid selecting those memory loads that cause L2 cache misses but are satisfied by L3 cache hits. Still, we need another filter to separate loads with long latency caused by coherent memory accesses from those that are served by the memory. We found that on the Itanium 2 server, the latency of a coherent miss is usually much greater than the latency of a memory load, e.g. memory access latencies are usually between 120-150 cycles, but coherent miss latencies could exceed 180-200 cycles. We may hide the long memory latency by either inserting data prefetches, or by scheduling the cache missing load far away from the actual use. Prefetch insertion is easier to apply since the prefetch instruction is non-binding, so it can be scheduled freely. Furthermore, prefetch instructions are merely hints, they do not affect the correctness of the code. However, we need to find the prefetch instructions that are associated with the load instructions. Our heuristic is based on the fact that prefetch instructions are usually generated
inside a loop or the entry point of a loop. Therefore, we try to discover the loops that have the loads found through the above mentioned two-level filtering scheme. On Itanium 2, using BTB to capture the last 4 taken branches and their target addresses, we could easily discover the loop boundaries to determine the PC addresses having lfetch instruction within the identified boundaries. Finally, we can apply optimizations on the identified prefetch instructions.
Table 1. The number of loops and prefetches in compiler generated OpenMP NPB binaries benchmarks BT SP LU FT MG CG EP IS
5 Experiments 5.1
Experimental Setup
Our experimental data are collected on a 4-processor Itanium 2 server and a SGI Altix system. We used 8 processors in the SGI Altix system for our experiments. On the 4-processor Itanium 2 SMP server, four processors are connected via a front-side bus (6.4GB/sec) that supports a MESI (also called Illinois protocol) cache coherence protocol. On the SGI Altix, two processors are connected via a front-side bus to form a computing node. All of the 2processor nodes are connected by a fat-tree interconnection network. Intel icc/ifort compiler ver. 9.1 is used to compile NAS parallel benchmark with -O3, and -openmp options. The NAS Parallel Benchmark (NPB) [15] consists of five kernels and three simulated CFD applications (BT, SP, LU) derived from several important aerophysics applications. The five kernels (FT, MG, CG, EP, IS) mimic the computational core of five numeric methods used in CFD applications. The simulated CFD applications reproduce much of data movement and computation found in full CFD codes. The NPB benchmarks are implemented with High Performance Fortran (HPF), OpenMP, and Message Passing Interface (MPI) to accommodate various parallel machines. The OpenMP version of NPB benchmark is used in our experiments. OpenMP uses a set of compiler directives that guide the compiler to exploit loop-level parallelism. The cache coherent memory accesses could limit the scalability of OpenMP programs since computations inside a loop are distributed based on the loop index range regardless of data locations. The NPB benchmarks provides five data sets (S, W, A, B, C) from the smallest (S) to the largest (C) data sets. Since 60-70% of memory accesses in the smallest data set (S) are related to coherent memory accesses, we use the smallest data set (S) in our experiments for evaluating the effectiveness of optimizations on coherent memory accesses. As the data set size in NAS parallel benchmarks increases, the proportion of coherence memory accesses is decreased. Table 1 shows the number of loops and prefetches generated by the icc compiler in the OpenMP NPB binaries. On Itanium, br.ctop and br.wtop are branches used in software pipelined (SWP) loops. The br.cloop is used in the counted loops. The compiler generates several hundreds prefetches
lfetch 140 276 184 258 419 433 17 76
br.ctop 34 67 61 45 66 69 1 19
br.cloop 32 22 19 9 34 29 4 13
br.wtop 0 0 0 8 4 2 1 2
in most of the benchmarks except EP and IS. It is infeasible to tune every prefetch instruction manually due to the large number of candidate prefetches.
5.2
Experimental Results
To understand the impact of two optimizations (noprefetch, prefetch.excl) on different system architectures, we examined the execution time, L3 misses, and the number of system memory bus transactions. The overall execution time on parallel programs is based on wall clock time. The L3 misses and the number of memory bus transactions are highly correlated because L3 misses need to be serviced by bus transactions. Since IS and EP benchmarks don’t show any long latency coherent misses on both machines, we exclude IS and EP benchmarks from our final results. Three different prefetch strategies are studied in our experiments. • prefetch: This is our baseline for evaluating the effect of our prefetch optimizations for coherent cache misses. The prefetch version is chosen as the baseline because recent optimizing compilers aggressively generate prefetches even at the commonly used -O2 optimization level. Our baseline binaries are compiled with the highest compiler optimization level. • noprefetch: This optimization selectively reduces the aggressiveness of prefetching to remove unnecessary coherent cache misses. Our runtime profiler guides the optimizer to select prefetches in a few loops and turn them into NOP instructions. • prefetch.excl: This optimization also selectively chooses prefetch instructions that cause long latency coherent misses and applies .excl hint on the selected prefetches. Noprefetch strategy is very effective when the data working set fits in the processor caches and many coherent misses are caused by aggressive prefetching. However, it needs precise runtime profiles to avoid removing effective prefetches that could result in performance loss.
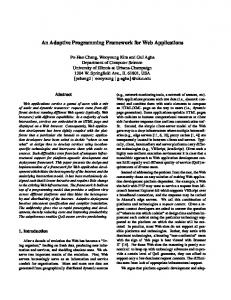
5.2.1 Impact on Execution Time Figure 5 shows the performance improvement from two optimizations (noprefetch, prefetch.excl) on OpenMP NPB benchmarks. The speedup achieved with noprefetch optimization on 4-way SMP server was up to 15% with an average of 4.7%, and with lfetch.excl optimization, it was up to 8% with an average of 2.7%, as shown in Figure 5(a). Since the penalty of coherent misses is much higher on ccNUMA machines than that on SMP machines, we obtained a higher performance improvement from the two optimizations on SGI Altix. The speedup achieved with noprefetch optimization on SGI Altix cc-NUMA system was up to 68% with an average of 17.5%, and with lfetch.excl optimization, it was up to 18% with an average of 8.5%, as shown in Figure 5(b). (4, prefetch)
(4, noprefetch)
(4, prefetch.excl)
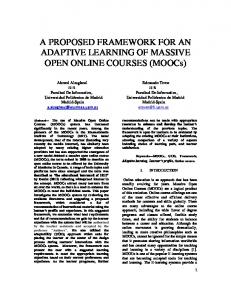
Figure 6 shows the impact on L3 misses from the two optimizations (noprefetch, prefetch.excl). On Itanium, coherent cache misses could lead to L3 misses. When coherent memory accesses are a significant portion of L3 cache misses, reducing L3 misses substantially indicates that we have reduced unnecessary coherent misses.
15%
1.150
(4, prefetch)
1.100
1.000 0.950
lu.S
ft.S
mg.S
cg.S
avg
NPB OMP v3.0 benchmarks
(a) 4 threads running on 4-way SMP node (8, prefetch)
(8, noprefetch)
Normalized # of L3 misses to baseline
2.7%
sp.S
(4, prefetch.excl)
3.5%
4.7%
1.050
bt.S
(4, noprefetch)
1.200
8%
0.900
(8, prefetch.excl)
1.000 -16.3% 0.800
0.600
0.400
0.200
0.000
bt.S
1.800 Speedup relative to baseline (prefetch)
5.2.2 Impact on L3 Cache Misses
sp.S
68%
lu.S
ft.S
mg.S
cg.S
avg.
OpenMP NPB Benchmark
1.600
(a) 4 threads running on 4-way SMP node
1.400 18%
1.200
17.5%
(8, prefetch)
(8, noprefetch)
(8, prefetch.excl)
8.5%
1.200
1.000 0.800 0.600 0.400 0.200 0.000 bt.S
sp.S
lu.S
ft.S
mg.S
cg.S
avg
NPB OMP v3.0 benchmarks
(b) 8 threads running on SGI Altix cc-NUMA machine
Figure 5. Speedup of coherent memory access optimization on OpenMP NPB benchmarks. The performance of prefetch version (optimized
Normalized # of L3 misses to baseline
Speedup relative to baseline (prefetch)
1.200
coherent memory accesses. This filtering heuristics allow us to minimize the negative impact of optimizations on the performance. The lfetch.excl optimization is less effective than noprefetch optimization. Even though this optimization improves the performance of the instruction sequences that contain load operations followed by store operations to the same cache line, it could still fetch unnecessary cache lines from other processors.
-0.3% 1.000 -13% 0.800
0.600
0.400
0.200
0.000
bt.S
sp.S
lu.S
ft.S
mg.S
cg.S
avg.
OpenMP NPB Benchmarks
(b) 8 threads running on SGI Altix cc-NUMA machine
by Intel compiler) is normalized to 1 as the baseline.
Figure 6. Number of L3 misses on OpenMP NPB benchmarks Intuitively, replacing prefetch instructions with NOP instructions could slowdown program execution because the load latency increases. However, it should be noted that our noprefetch optimization does not blindly replace prefetch instructions with NOP instructions. It uses the filtering mechanism detailed in section 4 to filter out instructions that causes frequent L3 misses when L2 miss ratio is low. Thus a large portion of memory transactions that are optimized by noprefetch are those transactions that are related with
On the SP and the CG benchmarks, L3 misses have been substantially reduced by the noprefetch version. The reduction is as high as 29.9% for SP and 39.5% for CG, on the 4-way SMP server, as shown in Figure 6(a). On the SGI Altix system, we have also observed near 20% reduction of L3 misses from the noprefetch version for BT, SP and CG, as shown in Figure 6(b).
5.2.3 Impact on Memory Bus Transactions Figure 7 shows the impact on the number of memory transactions on the system bus from the two optimizations (noprefetch, prefetch.excl). Since L3 misses are directly translated into memory transactions on the system bus, the number of memory transactions is highly correlated with L3 misses. Hence, Figure 7 is closely correlated to Figure 6. (4, prefetch)
(4, noprefetch)
(4, prefetch.excl)
Normalized # of system bus memory transactions to baseline
1.200 4.9% -15.1%
1.000
0.800
0.600
0.400
0.200
0.000
bt.S
sp.S
lu.S
ft.S
mg.S
cg.S
avg.
OpenMP NPB benchmarks
(a) 4 threads running on 4-way SMP node (8, prefetch)
(8, noprefetch)
(8, prefetch.excl)
Normalized # of system bus memory transactions to baseline
1.200
-1.9%
1.000
-13.9% 0.800
0.600
0.400
Collard et al [10] proposed using system-wide hardware performance monitors, called SWIFT, to detect pairs of instructions that access different data but compete for the same cache line. With SWIFT monitor profiles, identifying the instruction addresses that cause such false sharing can be straightforward. These profiles can be fed back into compiler to enable LDBIAS and FPBIAS optimization. In order to carefully separate the benefits of prefetching, the use of lfetch.excl instruction is excluded. In contrast, we focus on the selective use of lfetch.excl instruction to optimize coherent memory accesses. Tullsen and Eggers [22] pointed out that prefetching can negatively affect bus utilization, overall cache miss rates, memory latencies and data sharing. They examined the sources of cache misses, in light of several different prefetching strategies, pinpointed the cause of the performance changes. They simulated the effects of a particular compiler-directed prefetching algorithm, running on a busbased multiprocessor. The ADAPT [23] is a generic compiler-supported framework for high-level adaptive program optimizations. The ADAPT compiler accepts user-supplied heuristics and generates a complete runtime system to apply these heuristics dynamically. ADAPT is applicable to both serial and parallel programs. However, given the variety of options and the importance of high performance for parallel programs, ADAPT is particularly well suited to these types of applications.
0.200
0.000
bt.S
sp.S
lu.S
ft.S
mg.S
cg.S
avg.
OpenMP NPB benchmarks
(b) 8 threads running on SGI Altix cc-NUMA machine
Figure 7. Number of memory transactions on the system bus on OpenMP NPB benchmarks
6 Related Work Dynamic optimization has been used in the context of dynamic compilation and optimization systems such as Java Virtual Machine [4, 8], runtime binary translation [14, 19, 20, 16] and optimization [5, 17, 7, 9, 6, 12, 24]. Prior runtime binary optimization systems [5, 17, 7, 9, 6, 12, 24] are developed to improve the performance of single-threaded applications. In contrast, COBRA is designed to concurrently monitor multiple threads and to optimize the binary on multiprocessors, its design of thread monitoring, profile processing and trace management are significantly different from other binary optimizers for single-threaded applications. Furthermore, optimization decisions are based on profiles collected from multiple threads to determine if a system-wide optimization is needed.
Thomas et al. [21] proposed a general framework for adaptive algorithm selection and used it on the Standard Template Adaptive Parallel Library (STAPL) [3]. When STAPL is first installed on the system, statically available information about the architecture and the environment are collected. Performance characteristics for the algorithmic options available in the library are then computed. This data is stored in a repository, and machine learning techniques are used to determine the tests that will be used at run-time for selecting an algorithmic option. At run-time, necessary performance characteristics are collected and then a decision about which algorithmic option to use is made. The ATLAS [25, 13] is a linear algebra library generator that makes use of domain-specific, algorithmic information. It generates platform-optimized Basic Linear Algebra Subroutine (BLAS) by searching different blocking strategies, operation schedules, and degree of unrolling. SPIRAL [18] automatically generates high-performance code that is tuned to the given platform. SPIRAL formulates the tuning as an optimization problem and exploits the domainspecific mathematical structure of the transformation algorithms to implement a feedback-driven optimizer. SPIRAL generates high-performance code for a broad set of DSP transformations, including the discrete Fourier transformations, other trigonometric transformations, filter transformations, and discrete wavelet transformations.
7 Conclusion Runtime dynamic optimizers have shown to improve performance and power efficiency of single-threaded applications. Multithreaded applications running on SMP, CMP and cc-NUMA systems pose new challenges and opportunities to runtime dynamic binary optimizers. This paper introduces COBRA (Continuous Binary Re-Adaptation), a runtime binary optimization framework, for multithreaded applications. A prototype has been implemented on Itanium 2 based SMP and cc-NUMA systems. We have shown that, with OpenMP NAS parallel benchmarks, COBRA can adaptively select appropriate optimization techniques based to changing runtime program behaviors to achieve significant speedup. Coherent memory accesses caused by data sharing often limit the scalability of multithreaded applications. Using COBRA, the performance of some OpenMP parallel programs can be improved by dynamically reducing the aggressiveness of data prefetching and using exclusive hints for prefetch instructions.
8 Acknowledgement The authors would like to thank the anonymous reviewers for their comments and suggestions. This research was supported in part by NSF grant no. EIA-0220021, Intel, HP, Sun and the Minnesota Supercomputing Institute.
References [1] Intel itanium processor reference manual for software development. http://www.intel.com/design/itanium/manuals.htm. [2] perfmon. http://www.hpl.hp.com/research/linux/perfmon/. [3] P. An, A. Jula, S. Rus, S. Saunders, T. Smith, G. Tanase, N. Amato, and L. Rauchwerger. Stapl: An adaptive, generic parallel programming library for c++. Workshop on Languages and Compilers for Parallel Computing (LCPC), August 2001. [4] M. Arnold, S. Fink, D. Grove, M. Hind, and P. F. Sweeney. Adaptive optimization in the jalapeno jvm. 15th Conference on Object-Oriented Programming, Systems, Languages, and Applications, pages 47–65, 2000. [5] V. Bala, E. Duesterwald, and S. Banerjia. Dynamo: A transparent dynamic optimization system. Proceedings of the ACM SIGPLAN ’2000 conference on Programming language design and implementation, June 2000. [6] D. Bruening, E. Duesterwald, and S. Amarasinghe. Design and implementation of a dynamic optimization framework for windows. the 3rd Workshop of Feedback-Directed and Dynamic Optimization, 2001. [7] D. Bruening, T. Garnett, and S. Amarasinghe. An infrastructure for adaptive dynamic optimization. Proceedings of 1st International Symposium on Code Generation and Optimization (CGO), pages 265–275, 2003. [8] M. Burke, J.-D. Choi, S. Fink, D. Grove, M. Hind, V. Sarkar, M. Serrano, V. Sreedhar, H. Srinivasan, and J. Whaley. The jalapeno dynamic optimizing compiler for java. Proc. ACM 1999 Java Grande Conference, pages 129–141, 1999.
[9] W. Chen, S. Lerner, R. Chaiken, and D. Gillies. Mojo: A dynamic optimization system. the 3rd Workshop of FeedbackDirected and Dynamic Optimization, pages 81–90, 2000. [10] J.-F. Collard, N. Jouppi, and S. Yehia. System-wide performance monitors and their application to the optimization of coherent memory accesses. Proc. Intl. Symp. on Prin. and Practice of Parallel Prog. (PPoPP), June 2005. [11] A. Das, J. Lu, H. Chen, J. Kim, P.-C. Yew, W.-C. Hsu, and D.-Y. Chen. Performance of runtime optimization on blast. Proceedings of the Third Annual IEEE/ACM Internation Symposium on Code Generation and Optimization, March 2005. [12] D. Deaver, R. Gorton, and N. Rubin. Wiggins/redstone: An on-line program specializer. Hot Chips 11 Conf., 1999. [13] J. Demmel, J. Dongarra, V. Eijkhout, E. Fuentes, A. Petitet, R. Vuduc, C. Whaley, and K. Yelick. Self-adapting linear algebra algorithms and software. Proceedings of the IEEE, 93(2):293–312, February 2005. [14] K. Ebcioglu and E. Altman. Daisy: Dynamic compilation for 100% architectural compatibility. Proc. 24th Annu. Int. Symp. Computer Architecture, pages 26–37, 1997. [15] H. Jin, M. Frumkin, and J. Yan. The openmp implementation of nas parallel benchmarks and its performance. NAS Technical Report NAS-99-011, October 1999. [16] H. Kim and J. Smith. Dynamic binary translation for accumulator-oriented architectures. Proc. 2003 Int. Symp. Code Generation and Optimization, pages 25–35, 2003. [17] J. Lu, H. Chen, R. Fu, W.-C. Hsu, B. Othmer, and P.-C. Yew. The performance of runtime data cache prefetching in a dynamic optimization system. Proceedings of the 36th Annual International Symposium on Microarchitecture, December 2003. [18] M. Puschel, J. M. F. Moura, J. R. Johnson, D. Padua, M. M. Veloso, B. W. Singer, J. Xiong, F. Franchetti, A. Gacic, Y. Voronenko, K. Chen, R. W. Johnson, and N. Rizzolo. Spiral: Code generation for dsp transforms. Proceedings of the IEEE, 93(2), February 2005. [19] K. Scott, N. Kumar, S. Velusamy, B. Childers, and M. Soffa. Retargetable and reconfigurable software dynamic translation. Proc. 2003 Int. Symp. Code Generation and Optimization, pages 36–47, 2003. [20] A. Srivastava, A. Edwards, and H. Vo. Vulcan: Binary translation in a distributed environment. Microsoft Research Technical Report, MSR-TR-2001-50, 2001. [21] N. Thomas, G. Tanase, O. Tkachyshyn, J. Perdue, N. M. Amato, and L. Rauchwerger. A framework for adaptive algorithm selection in stapl. PPoPP’05, June 2005. [22] D. M. Tullsen and S. J. Eggers. Limitations of cache prefetching on a bus-based multiprocessor. Proc. of 20th International Symposium on Computer Architecture(ISCA), pages 278–288, May 1993. [23] M. J. Voss and R. Eigenmann. High-level adaptive program optimization with adapt. ACM SIGPLAN Notices, 32(7):93– 102, July 2001. [24] B. C. W. Zhang and D. M. Tullsen. An event-driven multithreaded dynamic optimization framework. Proceedings of the 14th International Conference on Parallel Architec- tures and Compilation Techniques, pages 87–98, 2005. [25] R. Whaley, A. Petitet, and J. Dongarra. Automated empirical optimization of software and the atlas project. Parallel Comput., 27(1-2):3–35, 2001.