minimal overhead while providing good potential for optimization speedups. Other ... Our hardware information is collected using perflib, a library from the Perfmon tool- ..... âPerfmon Project Websiteâ, webpage, http://www.hpl.hp.com/research.
Continuous Adaptive Object-Code Re-optimization Framework Howard Chen, Jiwei Lu, Wei-Chung Hsu, and Pen-Chung Yew University of Minnesota, Department of Computer Science Minneapolis, MN 55414, USA {chenh, jiwei, hsu, yew}@cs.umn.edu http://www.cs.umn.edu/~hsu/dynopt
Abstract. Dynamic optimization presents opportunities for finding run-time bottlenecks and deploying optimizations in statically compiled programs. In this paper, we discuss our current implementation of our hardware sampling based dynamic optimization framework and applying our dynamic optimization system to various SPEC2000 benchmarks compiled with the ORC compiler at optimization level O2 and executed on an Itanium-2 machine. We use our optimization system to apply memory prefetching optimizations, improving the performance of multiple benchmark programs.
1 Introduction Dynamic optimization presents an opportunity to perform many optimizations that are difficult to apply at compile time due to information that is unavailable during static compilation. For instance, dynamic link libraries limit the scope of procedure inlining and inter-procedural optimizations, two optimizations that are known to be very effective [2]. In addition, a typical shared library calling sequence includes expensive indirect loads and indirect branches. Such instruction sequences are good targets for dynamic optimizations once the shared libraries are loaded. Dynamic optimization also provides an opportunity to perform micro-architectural optimizations. Recompiling a program to a new micro-architecture has been shown to greatly improve performance [9]. Dynamic optimization provides a way to reoptimize a program to new micro-architectures without requiring recompilation of the original source code. Finally, dynamic optimization can specialize a program to a specific input set or user which has been applied successfully by Profile Based Optimization (PBO) [2],[5] in the past, but are difficult to apply for due to concerns over excessive compile time, instrumentation-based profiling overhead, complex build processes, and inadequate training input data set [14]. Dynamic optimization can be used to deploy more aggressive optimizations, such as predication [13], speculation [10], and even register allocation and instruction scheduling according to current program behavior and with less risk of degrading performance. P.-C. Yew and J. Xue (Eds.): ACSAC 2004, LNCS 3189, pp. 241–255, 2004. © Springer-Verlag Berlin Heidelberg 2004
242
H. Chen et al.
In short, dynamic object code re-optimization allows code to be generated specifically for a specific execution environment. It adapts optimizations to the actual execution profiles, micro-architectural behavior, and exploits the opportunity to optimize across shared libraries. However, a dynamic optimization system must detect and apply optimizations efficiently to be profitable. If the overhead of the system is greater than the time saved by optimizations, the runtime of the optimized program will increase. We present our design and implementation of our adaptive object-code reoptimization framework to detect and deploy dynamic optimizations with a minimal amount of overhead on modern hardware. Our prototype system detects timeconsuming execution paths and performance bottlenecks in several unmodified SPEC2000 benchmarks by continuously sampling Itanium performance monitoring registers throughout the program’s execution [6]. We use the collected information to create executable traces at runtime, and deploy these optimizations by modifying branch instructions in existing code to execute our instructions in place of hot paths in the original code. We examine the overhead of our detection system, and show that this technique can be applied with less than 2% of overhead while speeding up various SPEC2000 benchmarks.
2 Background Dynamic optimization has been presented in the past in frameworks such as Dynamo [3] and Continuous Profiling and Optimization (CPO)[12]. Dynamo uses a method similar to dynamic compilation used in virtual machines. Native binaries are interpreted to collect an execution profile and fragments of frequently executed code are emitted and executed in place of interpretation. Dynamo requires no additional information beyond the executable binary to operate, and this allows it to be applied on arbitrary binaries without needing access to the original code or IR. CPO presents a model closer to traditional PBO where the original code is instrumented, and the profile information is used to compile optimized versions of code. In CPO, profiled information is used to drive PBO while the program is running and the compiled result is hot-swapped into the program. The advantage of this scheme is that the IR information makes application of many optimizations easier. However, since the applied optimizations compete with the dynamic optimization system’s overhead, interpretation and instrumentation-based profiling dynamic optimizers often try to limit the time spent collecting profiled information, sometimes at the expense of optimizations. For example, Dynamo only interprets unique execution paths a small number of times before selecting traces to optimize to avoid interpretation overhead. Instrumentation incurs less overhead than interpretation, but even efficient implementations of instrumentation [4] generate measurable overheads. This may lead to profiling of initialization behaviors that do not represent dominant execution behavior. Even after attempting to reduce optimization system costs, the dynamic optimization systems still produce a relatively high amount of overhead, which works
Continuous Adaptive Object-Code Re-optimization Framework
243
against the profitability of optimizations. In our system, we seek to limit the overhead of the techniques used to profile and deploy dynamic optimizations. Existing dynamic optimization systems can generally be broken down into three stages: profiling/detection, optimization, and deployment. The detection stage deals with the collection of information necessary to select and guide optimizations. The optimization stage uses the collected information to select a set of optimizations to deploy in a target program. The deployment stage handles the application of the selected optimizations to a running program. Each of these stages requires runtime processing which leads to a slowdown of the original program. We try to reduce target profiling and deployment costs to improve the performance of the entire dynamic optimization system. Our overall goal is to move towards a dynamic optimization framework that incurs minimal overhead while providing good potential for optimization speedups. Other techniques seek to perform similar goals [15], [16] using hardware. Like these schemes, our work uses specialized hardware to collect information useful for our planned optimizations. However, these schemes propose the implementation of new hardware to process data. In contrast, our work gathers data from existing performance monitoring hardware and analyzes it using a user program. Previous work in periodic sampling of hardware structures is presented in [1], [7], [8]. These schemes concentrate on applying this information to guide static PBO rather than dynamic optimizations.
3 Architecture 3.1 Overview Our architecture performs three main tasks: detection, optimization, and deployment. Detection deals with the collection of raw performance event information that is useful for identifying and applying optimizations like D-cache misses, IPC, and branch paths commonly leading up to performance events. Optimization deals with generating optimized code to replace existing executable code. Deployment deals with the issues presented by redirecting execution from the original program to optimized code. The code for our dynamic optimizer is first executed when a program executes the C run-time startup routines. We compile our own custom version of C run-time library to start a thread dedicated to dynamic optimization and initialize a shared memory area to place optimized code. The dynamic optimization thread begins monitoring the behavior of the original primary thread, and generates and deploys optimized code later in execution. After initialization of the dynamic optimization thread is complete, the C run-time library startup routines continue and begin executing the original program while the optimization thread begins detecting optimization opportunities.
244
H. Chen et al.
3.2 Performance Event Detection 3.2.1 Performance Monitoring Hardware We use the Performance Monitoring Unit (PMU) on Itanium processors to collect information and signal the operating system to collect and store profiled information. The primary PMU features we use for the detection work are the performance-event counters and the Branch Trace Buffer (BTB)[11]. The performance-event counters are a set of registers that track the number of times performance events like cache misses and branch mispredictions occur. These counters are used to throw interrupts periodically after a number of events occur. For instance, we can choose to throw a system interrupt once every million clock cycles, once every ten thousand D-cache misses, or once every one-hundred branch mispredictions. During each interrupt, we can save information about the type of interrupt and BTB information in memory for later processing. The BTB, not to be confused with a branch target buffer used in branch prediction, is a set of eight registers that store the last four branches and branch targets. When the performance monitor throws an interrupt, we use the BTB to find the last four taken branch instructions and branch targets that lead up to the performance event interrupt. By monitoring only taken branches, we can form longer traces than if we had monitored all branches since not-taken branch information can easily be reconstructed by scanning the instructions between the last branch target and the next taken branch instruction. The BTB also allows us to generate an edge profile without scanning and decoding the original source code. A detailed discussion of PMU hardware on Itanium processors can be found in [11]. 3.2.2 Perfmon Our hardware information is collected using perflib, a library from the Perfmon toolset. The Perfmon toolset configures and collects raw performance information from Itanium programs running on 64-bit Linux. Perfmon sends system calls to a Linux kernel driver to configure the PMU and automatically collects samples of the PMU registers for later processing. Once the PMU stores raw register information to memory, it can be consumed independently from the monitored program. All information collected by Perfmon is done without modifying the original program binary. Perfmon is described in greater detail in [20]. 3.2.3 Hot Trace Selection The goal of our hot trace detector is to find a small number of traces that lead up to performance critical blocks. To collect these hot traces, we sample sets of four taken branches and branch targets from the BTB at regular intervals and sort the results into a hash table, while keeping track of the frequency of the different sample paths. The most frequently sampled paths are marked for optimization in the table under the assumption that they dominate execution time, and traces are selected to include these hot spots.
Continuous Adaptive Object-Code Re-optimization Framework
245
Since the optimization and deployment of traces requires processing time, we limit the traces we select to those we believe we can optimize profitably. The best traces to optimize are the traces that contribute the most execution time for the remainder of the program, and contain a performance event that we can optimize. The performance monitoring hardware provides the information we need to see if a performance event commonly occurs on any path we select. However, to predict which traces will continue to dominate execution time in the future and prevent optimizing traces with performance events that only occur for very short periods of time, we perform additional work to estimate when program behavior is most stable. 3.2.4 Phase Change Detection We assume that programs generally enter different “phases” of execution, periods of time when characteristics like IPC, D-cache hit rate, and the current working set of hot code follow similar patterns throughout a phase [17],[18]. Since our current optimizations focus on optimizing D-cache misses and improving IPC, we use the number of D-cache misses per cycle and IPC over time as metrics to guess when the behaviors we wish to optimize are most stable. Our goal is to select hot traces to optimize the first time we encounter a new phase and to keep it in our working set for the remainder of program execution. As long as the execution of the program remains in a stable phase, no further changes are made to the optimized traces. Changes in execution phases will be detected, and such changes will trigger further optimizations. Every second of execution time, we measure the number of D-cache misses and IPC over the past second and compare it to previously measured values. If the Dcache and IPC values are stable for several seconds (deviating less than a set percentage), we assume that the D-cache and general program behavior is stable enough to select a set of hot traces that may execute for some time into the future, and select a set of traces from the samples in the current stable phase. Conversely, when D-cache and IPC values fluctuate, it indicates that program behavior has changed and that new hot traces may need to be selected or existing selected traces may no longer be hot. When D-cache miss rate and IPC values deviate from the previous few seconds, we recheck our collected sampled data to look for new hot traces to add to our working set. The weakness of this metric is that D-cache miss and IPC values are composite values for all the code that is executing in a program over an interval. This can lead to a false measurement of a stable phase since it is possible that program behavior has completely changed but averages out to similar values. In practice, we found that a stable D-cache miss rate and IPC values indicated a stable phase. We did not observe this behavior in any of our measurements of SPEC benchmarks, but it remains a possibility for other programs. A more likely problem with this metric is that program behavior patterns commonly have sub-patterns. For instance, an outer loop may contain two inner loops: one with stable exploitable behavior, and one with unstable behavior. The stable subphase, or repeated stable behavior contained within the larger phase, can be optimized
246
H. Chen et al.
despite instability in the D-cache and IPC metrics. However, this behavior was also uncommon in the SPEC benchmarks we measured. However, these problems indicate the potential need for deeper phase change detection to fully exploit all the stable behavior in a program that may be further supported in future work studying phase detection of programs outside of the SPEC benchmark suite. 3.3 Optimization 3.3.1 Trace Generation Every time a set of traces is selected, executable code corresponding to each trace is assigned a type name according to its behavior. For instance, a loop is a type assigned to any trace that is completely enclosed in a trace. A subroutine is a type assigned to traces that are targeted by “br.call” instructions and end with a “br.ret” instruction, both indicators of a subroutine. Traces of different types are optimized in different ways. Data prefetching loop optimizations are particularly applied only to loop-typed traces, while inter-trace optimizations are more likely to be applied in subroutines. Code is then generated in our trace buffer for our selected traces, a shared memory area that contains our optimized executable code. The selected traces are then “crosspatched” or set to return to original code if execution leaves the path of the trace. 3.3.2 Trace Cross-Patching Cross-patching refers to patching optimized traces to branch to other optimized traces. Ideally, once a good set of optimized traces is selected, control should rarely return to the original program. To perform cross-patching, a graph is generated with one node for each selected trace and edges to connected traces. When the code for the trace is generated, the branch instructions in optimized traces are then modified to branch to other optimized traces instead of returning to the original code. 3.3.3 Architecture Safe Optimization Code scheduling/motion and other aggressive transformations may cause problems for preserving the original order of architecture state changes. This may create problems if a user trap handler expects to have the precise architecture state at the exception. To avoid these problems, we first attempt optimizations that do not change architecture states such as trace layout and data cache prefetching. Although data cache prefetch transformations require some temporary registers to hold prefetch addresses, we have the compiler (ORC compiler) reserve four general purpose and two predicate registers for such a purpose. Due to the large register file in the Itanium architecture, reserving a small number of registers has essentially no performance impact on the compiled code. We have verified this by comparing the performance of compiled code at various optimization levels with/without the reserved registers.
Continuous Adaptive Object-Code Re-optimization Framework
247
3.3.4 Data Prefetching In our dynamic optimization system, we target D-cache misses for optimization because they are well known to be a common dominant performance problem in programs, but are difficult to detect statically [19]. Using our ability to detect instructions that cause D-cache misses, our dynamic optimization system can take advantage of information that is only available at run-time. To detect which memory operation generates data cache misses during runtime, Dcache miss events are sampled by the performance monitoring unit and associated with the corresponding load/store instructions in the selected traces. Once a memory operation is found with a miss latency that contributes greater than 5% of execution time based on performance monitoring counters, the trace where this instruction resides will be scheduled for optimization. The optimizer then determines if any of the implemented prefetch optimizations are appropriate. We implement three types of data prefetching for loops: array reference, indirect array reference, and pointer chasing. Here is an example of the code generated in an indirect array reference before prefetching: loop: ld4 r17=[r43] // cache miss from loading the address stored in the array sxt4 r17=r17 add r43=4,r43
// the array pointer is incremented
add r17=r39,r17 add r17=-1,r17 ld1 [r17]
// cache miss from loading the data value from the address
... br loop
A frequent D-cache missed indirect array reference will trigger two-level data cache prefetching. The first level is a direct array reference prefetch to prefetch for the array containing the addresses of the data. The second level prefetches the value at the address from the array. Note that the first level runs a few iterations ahead of the second level of prefetching. Here is an example of the prefetch code generated to optimize the previous indirect array-reference code: add
r30=128,r43 // this initializes the direct reference prefetch
add
r28=64,r43 // this initializes the indirect prefetch
loop: lfetch [r30],4 ...
// this prefetches the address from the array
248
H. Chen et al.
ld4.sa r29=[r28],4 // this loads the prefetched address // (prefetched in a previous iteration) sxt4
r29=r29
add
r29=r39,r29
add
r29=-1,r29
lfetch [r29]
// this prefetches the indirect value from the array address
... br loop
This is an example of pointer chasing code before optimization: loop: add r22=24,r11 // calculate offset of pointer to next list element ld8 r11=[r22] // cache miss from loading address of next list element br loop
For pointer-chasing prefetching, the key memory address which controls the memory references (i.e.the possible "->next" pointer for linked lists) is found and prefetched by assuming a constant stride: loop: (assume r28 is reserved unused by static compiler) add
r28=0,r11
add
r22=24,r11
ld8
r11=[r22]
sub
r28=r11,r28
// remember the old value of r11
// calculate the difference of old and new value
shladd r28=r28,2,r11 // use the difference as stride to prefetch lfetch [r28]
// prefetch ahead in the linked lists.
3.4 Deploying Optimizations 3.4.1 Patching Branch Targets We redirect execution from the original code to traces in our trace buffer by modifying frequently executed branch instructions to branch to the corresponding optimized code in the trace buffer. However, modifying executable instructions in a running program creates a number of issues ranging from memory protection to updating the I-cache line with the modified instruction.
Continuous Adaptive Object-Code Re-optimization Framework
249
3.4.2 Memory Protection The memory protection on the original code pages is read-only by default. When we wish to modify branch instructions in the address space of existing code, we make a system call to allow writing to memory pages of the original code. We then replace all branches at once, then restore write-protection to the original code to protect the original code from accidental changes. 3.4.3 Branch Patching Distance Most programs compiled for the Itanium architecture use a short branch, which allows a relative branch distance of 20-bits or about a million bundles (i.e. 16 megabytes). There are cases when the original code size is larger than 16 megabytes and a branch cannot be easily patched by simply changing the address field of a branch instruction. In some cases, the entire bundle containing the branch instruction must be replaced with a long branch instruction to reach the memory space of the trace buffer. The long branch instruction in the Itanium architecture allows the branch to reach anywhere in the 64-bit virtual address space. One alternative to using a long branch is to use an indirect branch instruction sequence, but this is more expensive, more likely to be mispredicted, and is more difficult to patch atomically. Since the Itanium uses an explicitly parallel instruction computing (EPIC) architecture, instructions are combined into 128-bit “bundles” which usually contain three instructions. Bundles with long-branch instructions can only contain two instructions. If the second instruction in a bundle that was replaced contains a “nop” in the middle slot, a common case, the entire bundle can be replaced at once. However, if the bundle you wish to replace with a long branch uses all three slots, the trace patcher cannot replace the instruction with a single instruction and we patch the target of the short branch instruction with an unconditional long branch to our optimized traces. 3.4.4 Atomic Write Issues Another issue with replacing instruction bundles is that bundles are 128 bits long while the processor only supports 64-bit atomic write instructions. That means that we need to take steps to prevent partially modified bundles from being executed. To deal with this case, we first patch the first half of the bundle with an illegal bundle type and handle the exception if the bundle is executed before we finish patching it. We then modify the second half of the bundle with the replacement bundle, and complete the process by modifying the first half of the long-branch instruction bundle. It is also possible that a context switch occurs while a bundle is only partially executed. This can happen if a cache miss occurs in a bundle. As long as the memory operation occurs in the first slot, this bundle can still be replaced with a long branch instruction. If the partially executed bundle is replaced with a bundle with a long branch, the bundle resumes execution at the second slot in the bundle, the long branch instruction. 3.4.5 Repatching Issues When a phase changes, some previously optimized traces may not be “hot”. In general we do not undo or remove existing patched traces for two reasons. First, when we
250
H. Chen et al.
optimize a trace, it often requires less execution time and therefore appears less “hot”. However, removing the optimization would lead to the code taking more execution time, so we are better off keeping the trace patched into the program. There are cases when we attempt to optimize a trace, and it requires more execution time than before due to additional cache misses. In the future, we plan to further explore the benefits of tracking the performance of our optimization at run-time and removing optimizations that appear to degrade performance. Second, we found that phase behavior tends to repeat over time and previously generated traces are often used again in the future. If existing traces are no longer hot, the patched traces generally have very little performance impact. This can save some processing work to regenerate the trace if the behavior becomes hot again. For long running programs that exercise many different execution paths, this may lead to fragmentation of generated traces that may affect I-cache performance. We plan to explore the benefits of optimized trace layout management in memory in the future.
4
Experiments and Discussion
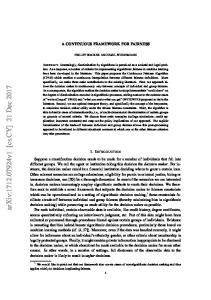
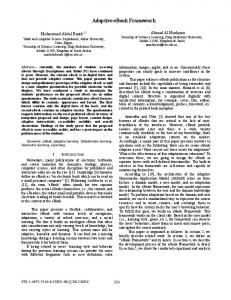
Our results are collected using ORC version 2.0 compiled SPEC2000 benchmarks with -O2 and software pipelined loops disabled on a dual processor Itanium-2 machine. We compile using O2 because that is the typical optimization level used by software vendors. Our current optimizer does not support register renaming in software-pipelined loops, so we disable software pipelining at compile time. For SPECint benchmarks, we found that disabling pipelining results in a slightly higher runtime performance when measuring results using ORC. 4.1 Speedup and Coverage Execution time is collected using the unix “time” command and averaged over several runs. The reported execution time includes all detection, profiling, optimization and deployment overhead. Relative speedup is calculated as ((baseline time)/(optimized time) - 1) * 100%. Figures 1 and 2 show the speedup of applying our system to various spec programs. We apply different sampling rates to collect data and select new traces every second of execution time. Data that is “continuous” selects new phases upon a suspected phase change while “single” data selects the first stable phase identified in a program. As Figure 3 shows, art, bzip, equake, fma, galgel, lucas, mcf, and swim benefit from regular and indirect array reference prefetching. Mcf benefits primarily from pointer reference prefetching. In Figure 2, at one hundred thousand cycles per sample facerec speeds up by 10%. Although the D-cache miss rate of facerec appears to increase in Figure 5, the actual execution time of the program decreases. The D-cache miss rate increases but these misses overlap with each other more effectively than in the original program leading to improved program performance. In contrast, equake’s D-cache performance is noticeably improved in Figure 4. Lower sampling rates for
Continuous Adaptive Object-Code Re-optimization Framework
251
1200
Execution Time (s)
1000 800 600 400 200
vpr
crafty
vpr
crafty
swim
vortex
mgrid
parser
mesa
mcf
lucas
gcc
gzip
gap
galgel
fma3d
equake
facerec
art
bzip2
applu
ammp
0
1 0 0 k c y c le s p e r s a m p le s in g le
1 M c y c le s p e r s a m p le c o n t in u o u s
1 M c y c le s p e r s a m p le s in g le
1 0 M c y c le s p e r s a m p le c o n t in u o u s
1 0 M c y c le s p e r s a m p le s in g le
vortex
swim
parser
mgrid
mesa
mcf
gzip
lucas
gcc
gap
galgel
fma3d
facerec
bzip2
equake
art
applu
50% 40% 30% 20% 10% 0% -1 0 % -2 0 % -3 0 % ammp
Execution Time
Relative Speedup in
B e n c h m a rk 1 0 0 k c y c le s p e r s a m p le c o n t in u o u s
B en c h m ark 1 0 0 k c y c le s p e r s a m p le c o n t in u o u s
1 0 0 k c y c le s p e r s a m p le s in g le
1 M c y c le s p e r s a m p le c o n t in u o u s
1 M c y c le s p e r s a m p le s in g le
1 0 M c y c le s p e r s a m p le c o n t in u o u s
1 0 M c y c le s p e r s a m p le s in g le
50% 40% 30% 20% 10% 0% crafty
vpr
vortex
swim
parser
mgrid
mesa
mcf
gzip
lucas
gcc
gap
galgel
fma3d
facerec
equake
bzip2
art
applu
-1 0 % ammp
Time
Relative Speedup in Execution
Figs. 1 (top) and 2 (bottom). Figure 1 shows the execution time of dynamically optimized programs with data collected at different sampling rates. Figure 2 shows the relative speedup at different sampling rates
B e n c h m a rk
Fig. 3. Relative speedup at one million cycles per sample
facerec do not improve performance because at slower sampling rates the primary execution path is not optimized properly on the first pass and since we do not currently monitor the performance of generated traces, the problem is not corrected in future intervals. Although this problem is most dramatic in facerec, this trend can be seen in all the programs at a slower sampling rate. It may be valuable to study tracking and removal of sub-optimal traces in the future to deal with this problem.
252
H. Chen et al.
D-cache misses per cycle
D -c a c h e M is s e s p e r C y c le in E q u a k e 0 .0 0 3 5 0 .0 0 3 0 .0 0 2 5 0 .0 0 2
o rig in a l
0 .0 0 1 5
o p t im iz e d
0 .0 0 1 0 .0 0 0 5 0 T im e
0 .0 0 3 0 .0 0 2 5 cycle
D-cache misses per
D -c a c h e M is s e s p e r C yc le in F a c e re c O v e r T im e
0 .0 0 2 o rig in a l
0 .0 0 1 5
o p tim iz e d
0 .0 0 1 0 .0 0 0 5 0 T im e
Figs. 4 and 5. Figure 4 shows the D-cache misses per cycle in Equake before and after optimization at one sample every 100k cycles. Figure 5 shows the D-cache misses per cycle in Facerec before and after optimization at one sample every 100k cycles.
Other benchmarks do not benefit from the implemented prefetching optimizations and are primarily slowed down by the overhead of sampling, additional I-cache misses from branching to our generated traces, and increased D-cache misses due to ineffectual prefetches. The overhead of our optimization and patching is generally very small, less than 1% of the original program’s execution time, so the majority of the slowdown in programs can be attributed to these factors. The largest reported slowdown is from gzip due to failed prefetching increasing D-cache misses. This demonstrates the need for additional work in tracking the effectiveness of optimizations and removing optimizations that fail to improve performance. In general, increasing the sampling rate results in higher overhead due to the time required to store sampled PMU information. However, it also detects a set of hotspots faster than slower sampling rates, which means hot traces may be applied earlier to a program than at slower sampling rates. Mcf and art both have small loops that noticeably speed up after being optimized and therefore benefit from higher sampling rates. In contrast, equake and swim perform better at one sample taken every one million cycles. At one sample every one million and hundred thousand cycles, these two programs generally found similar hotspots, but at one-hundred thousand cycles per sample, the overhead of sampling is about 5% higher than at one sample every 1 million cycles. Using a rate of ten million cycles per sample, continuously selecting traces yields worse performance than selecting a single set of traces once. At a rate of ten million cycles per sample, the system starts with correctly selected paths and later selects suboptimal paths that degrade performance. Because traces occur after a fixed interval, one second, the sampling error from the small pool of samples falsely detects traces
Continuous Adaptive Object-Code Re-optimization Framework
253
as hot. Since the sampling error of a program is related to the size of the footprint we need to detect, this indicates that it might be worthwhile to estimate the size of the working set and adjust the number of samples required to select hot-spots accordingly. However, performance is improved for continuously selected traces due to the ability to select new hot traces that do not occur earlier in execution. The largest slowdown in figure 3 is parser at 5%. This is mainly due to generated trace overhead from the selection of a large number of traces, and the lack of any effective D-cache prefetching. However, other programs like gap, gcc, and gzip generate less than 2% overhead. Finally, in some cases selecting a set of traces after the first detected hot phase performed better than continuous selection. Continuous selection is sensitive to short term behavior changes leading the optimizer to generate more traces and more overhead than making a single selection. 4.2 Run-Time Overhead The overhead for our run-time system is fairly stable, with the profiling thread generating a consistent 0.3%-0.6% overhead over no profiling. Optimization overhead is proportional to the number of traces selected to optimize and consistently less than 1%. Turning off patching has a negligible effect on overhead indicating that the cost of patching traces is much smaller than the cost of profiling and optimization. Sampling overhead averaged approximately 4% at one sample every hundred thousand cycles, about 1% at one sample every million cycles, and much less than 1% at lower sampling rates. The overhead is not directly proportional to the sampling rate because this includes the overhead of inserting branch information into the trace selection table. Slowdowns of greater than 1% are primarily due to optimizations resulting in larger loops.
5 Summary and Future Work Dynamic optimization promises to provide a useful mechanism for deploying aggressive optimizations targeting run-time behavior. We present our system as a prototype for finding and deploying optimizations, and support this claim by using our prototype to speedup various SPEC2000 benchmarks compiled by the ORC 2.0 compiler at O2. We are able to speed up several benchmarks dominated by D-cache misses, while maintaining a maximum slowdown of 5% in parser and crafty. Future directions for this work include enhancements to our current system, monitoring current optimizations and tracking the performance of generated traces, improving phase detection, evaluating other optimization techniques, and exploring dynamic optimization opportunities in different environments.
254
H. Chen et al.
References 1.
2.
3.
4. 5. 6.
7. 8.
9.
10. 11. 12. 13.
14. 15.
16. 17.
18.
J.M. Anderson, L.M. Berc, J. Dean, S. Ghemawat, M.R. Henzinger, S.A. Leung, R.L. Sites, M.T. Vandevoorde, C.A. Waldspurger and W.E. Weihl. “Continuous profiling: where have all the cycles gone?” ACM Transaction on Computer Systems, vol. 15, no. 4, Nov. 1997 A. Andrew, S. De Jong, J. Peyton, and R. Schooler "Scalable Cross-Module Optimization", In Proceedings of the ACM SIGPLAN '98 conference on Programming language design and implementation, PLDI'98, June 1998. V. Bala, E. Duesterwald, S. Banerjia. “Dynamo: A Transparent Dynamic Optimization System”, In Proceedings of the ACM SIGPLAN '2000 conference on Programming language design and implementation, PLDI'2000, June 2000. Ball, T., and Larus, J. R. “Efficient Path Profiling,” In Proceedings of the 29th Annual International Symposium on Microarchitecture (Micro-29), Paris, 1996. P. Chang, S. Mahlke and W. Hwu, "Using Profile Information to Assist Classic Compiler Code Optimizations," Software Practice and Experience, Dec. 1991. H. Chen, W. Hsu, J. Lu, P. -C. Yew and D. -Y. Chen, “Dynamic Trace Selection Using Performance Monitoring Hardware Sampling”, International Symposium on Code Generation and Optimization, CGO 2003, March, 2003. R.S. Cohn, D.W. Goodwin, P.G. Lowney, “Optimizing Alpha Executables on Windows NT with Spike”, Digital Technical Journal, Vol 9 No 4, June 1998. T. Conte, B. Patel, J Cox. “Using Branch Handling Hardware to Support Profile-Driven Optimization”, In Proceedings of the 27th Annual International Symposium on Microarchitecture (Micro-27), 1994 A. M. Holler, “Optimization for a Superscalar Out-of-Order Machine,” In Proceedings of the 29th Annual International Symposium on Microarchitecture (Micro-29), December 1996. Intel, Intel IA-64 Architecture Software Developer’s Manual, Vol. 1: IA-64 Application Architecture. Intel, Intel IA-64 Architecture Software Developer’s Manual, Vol. 2: IA-64 System Architecture. T. Kistler, M. Franz. “Continuous Program Optimization: Design and Evaluation”, IEEE Transaction on Computers, vol. 50, no. 6, June 2001. S. A. Mahlke, D. C. Lin, W. Y. Chen, R. E. Hank, and R. A. Bringmann, “Effective Compiler Support for Predicated Execution Using the Hyperblock”, In Proceedings of the 25th Annual International Symposium on Microarchitectures. (Micro-25), 1992 . S. McFarling, “Reality-Based Optimizations”, International Symposium on Code Generation and Optimization, CGO 2003, March, 2003. M. Merten, A. Trick, E. M. Nystrom, R. D. Barnes, W. Hwu, “A Hardware Mechanism for Dynamic Extraction and Relayout of Program Hot Spots”, In Proceedings, International Symposium on Computer Architecture, ISCA-27, 2000 S. Patel, S. S. Lumetta, “Replay: A Hardware Framework for Dynamic Optimization”, IEEE Transaction on Computers, vol. 50, no. 6, June 2001. T. Sherwood, E. Perelman, G. Hamerly, B. Calder. “Automatically Characterizing Large th Scale Program Behavior. 10 International Conference on Architectural Support for Programming Languages and Operating Systems, October 2002. T. Sherwood, E. Perelman, and B. Calder. Basic block distribution analysis to find periodic behavior and simulation points in applications. In International Conference on Parallel Architectures and Compilation Techniques, September 2001.
Continuous Adaptive Object-Code Re-optimization Framework 19. 20.
255
Y. Wu. “Efficient Discovery of Regular Stride Patterns in Irregular Programs”, PLDI 2002:210-221. Hewlett Packard, “Perfmon Project Website”, webpage, http://www.hpl.hp.com/research /linux/perfmon/index.php4.