We also present calvin, the rst prototype implemented to validate the approach. Experiments show that Code Cloning Tracing could be applied on all.
I
IN ST IT UT
DE
E U Q TI A M R
ET
ES M È ST Y S
E N
RE CH ER C H E
R
IN F O
I
S
S IRE O T ÉA AL
A
PUBLICATION INTERNE No 1176
CODE CLONING TRACING: A NEW APPROACH TO TRACE COLLECTION
ISSN 1166-8687
´ SEZNEC, ERVEN ROHOU, FRANCOIS THIERRY LAFAGE, ANDRE ¸ BODIN
IRISA CAMPUS UNIVERSITAIRE DE BEAULIEU - 35042 RENNES CEDEX - FRANCE
´ : (33) 02 99 84 71 00 – Fax : (33) 02 99 84 71 71 Tel. http://www.irisa.fr
Code Cloning Tracing: A New Approach to Trace Collection Thierry Lafage, Andr�e Seznec, Erven Rohou, Fran�cois Bodin Th�eme 1 | R�eseaux et syst�emes Projet CAPS Publication interne n�1176 | Mars 1998 | 13 pages
Abstract: Trace-driven simulation is a widely used technique to evaluate microprocessor architecture and/or
memory hierarchy performance. However, software trace collection induces signi cant execution slowdown. As on-line simulation induces an even more disastrous slowdown, simulating applications incurring trillions of instructions can not be considered without trace sampling. Therefore continuous software trace collection of the complete workload of a desktop computer cannot be envisaged. The Code Cloning Tracing method is aimed at allowing trace collection on time consuming applications. Sampling the execution is performed through a static duplication and instrumentation of the source code. A rst copy of the code is nearly identical to the original code and will execute most of the time. The second code copy is further instrumented by the trace user and will be parsimoniously executed in order to collect traces without slowing down too much the overall application. At execution time, some events make the execution switch to the instrumented code copy. Other events make the execution return to the original-like code copy. The choice of these events determines the execution overhead, therefore making the approach very exible. This paper presents in details the Code Cloning Tracing method. We also present calvin, the rst prototype implemented to validate the approach. Experiments show that Code Cloning Tracing could be applied on all applications running on desktop computer without signi cantly a�ecting user response time when traces are not collected. This opens the way to punctual (let us say one second of CPU) collection of the whole activity of a desktop computer. Key-words: software tracing, static code annotation method, micro-architecture simulation, trace-collection platform.
(R�esum�e : tsvp)
Centre National de la Recherche Scientifique (UPRESSA 6074) Universit´e de Rennes 1 – Insa de Rennes
Institut National de Recherche en Informatique et en Automatique – unit´e de recherche de Rennes
Code Cloning Tracing: une nouvelle approche pour la collecte de traces de programmes
R�esum�e : La m�ethode Code Cloning Tracing expos�ee dans cet article permet la collecte de traces sur de
grosses applications (co^uteuses en temps). Un �echantillonnage est r�ealis�e par l'ex�ecution alternative de deux copies du code. Une des copies est presque identique au code original et s'ex�ecute la plupart du temps (�a une vitesse proche de celle de l'application originale). La seconde copie du code est instrument�ee plus lourdement pour permettre la collecte e�ective de la trace. Celle-ci est ex�ecut�ee avec parcimonie pour ne pas trop ralentir l'application test�ee. A� l'ex�ecution, certains �ev�enements permettent le saut d'une copie �a l'autre. L'article pr�esente aussi un premier prototype, appel�e calvin, pour impl�ementer la m�ethode Code Cloning Tracing. Pour le moment, calvin est utilis�e avec des applications mono-t^aches sur architecture SPARC. Les r�esultats obtenus avec des applications instrument�ees par calvin, s'ex�ecutant sans g�en�erer de trace, ont fait appara^�tre de faibles ralentissements de l'ex�ecution (20 �a 30 %). Ceci ouvre la voie de la collecte de trace de l'activit�e compl�ete d'une station de travail. Pour cela, calvin sera bient^ot �etendu pour permettre de tracer des applications multi-t^aches ainsi que le syst�eme d'exploitation (Linux). Mots cl�es : collecte de traces de programme, m�ethode d'annotation statique de code, simulation de microarchitecture, plate-forme de collecte de traces.
Code Cloning Tracing: A New Approach to Trace Collection
3
1 Introduction and Motivations Trace-driven simulation \involves driving a simulation model of a system with a trace of external stimuli" [12]. It has been used by researchers for decades to evaluate microprocessor architectures and/or memory system performances. Such simulations might be as accurate as possible and require collecting realistic program traces. These traces may consist of the addresses of instructions executed and/or data referenced by a program (for cache simulations), but may also be registers or memory values (to simulate value prediction for instance). Such traces are needed for architecture simulations and validations in a processor design, or for new micro-architecture ideas validations. Ideally, one would need access to traces representing the whole punctual activity of a workstation or a desktop computer for a signi cant time interval (maybe a few seconds). This includes activity of all alive processes and the kernel. Moreover, one would like these traces to be representative of the real workload on the station, i.e. not immediately after booting the operating system, but for instance an hour or a week later. Nowadays, no platform allows such an ideal trace collection. Most current trace-collection platforms are limited to collect traces from a single application, generally only user instructions in this application [15], while it was shown that the usage of such uncompleted traces leads to signi cant misleading conclusions [1, 16, 17]. Another concern for micro-architecture studies is the performance of trace collection. Among the numerous trace collection platforms available [15], none of them allows a slowdown lower than 10 for simply collecting addresses for memory hierarchy simulations. For studies like value prediction [7], more information must be collected, thus leading to very high slowdowns (over 100). While trace collection is quite time consuming, micro-architecture (or memory system) simulation is often orders of magnitude more complex and may induce slowdowns in the 1,000{10,000 range. Such a simulation rate does not allow to consider realistic simulation of the entire workload of a desktop computer or even a large application executing trillions of instructions. Simulating such applications requires sampling [6]. Therefore, apart very speci c studies like cache behavior analysis of the whole SPEC92 benchmark suite [3] which used months of CPU time, most studies on cache or micro-architecture are performed using the rst 100,000,000 or billion instructions of an application (maybe the rst 50,000,000 are skipped to avoid the initialization phase) or are performed using a small or restricted data set. The purpose of this paper is to introduce Code Cloning Tracing, a new software annotation method for collecting traces. Sampling the execution is performed through a static duplication and instrumentation of the code. A rst copy of the code is nearly identical to the original code and will execute most of the time. The second code copy is further instrumented by the trace user 1 and parsimoniously executed in order to get trace without slowing down too much the overall application. At execution time, some events make the execution be switched to the instrumented copy of the code. Other events make the execution return to the original-like code copy. The choice of the events determines the execution overhead therefore making the approach very exible. The rst advantage of Code Cloning Tracing is to allow trace collection in realistic time on large applications as presented in this paper. Applying Code Cloning Tracing to an application allows to collect trace samples without impairing signi cantly the overall execution time. Our ultimate goal is to build a \close-to-ideal" tracecollection platform. We plan to apply Code Cloning Tracing to a complete operating system (Linux) and all applications running on a desktop computer. Then, we should be able to collect trace samples of the complete workload: for instance, every hour a few seconds activity can be traced. However, this trace-collection platform is beyond the scope of this paper. The remainder of this paper is organized as follows: in the next section, we rst present some related works, then we detail the principles of the sampling method. Section 3 presents two implementations of the tool which collect traces for single user applications. Results on the SPEC95 integer benchmark suite are presented in Section 4. Section 5 summarizes this study and presents our future development directions.
2 Sampling to Collect Traces In this section, we rst overview some related works about trace collection tools including both static code annotators and instruction-set emulators. Then, we present the Code Cloning Tracing approach. 1 For convenience, throughout this paper (unless explicitly written), a trace user will be someone who collects program traces. He/she will use the framework we provide, but will also need to instrument the tested applications to get the traces he/she wants.
PI n�1176
4
Thierry Lafage, Andr�e Seznec, Erven Rohou, Fran�cois Bodin
2.1 Related Works
Pixie [13], ATOM [14], and EEL [5] are among the most popular static code annotation methods. Pixie operates on MIPS executables and adds code to count the execution of each basic block. ATOM is more exible and enables a user to specify how to annotate each individual instruction, basic block or procedure of an executable le for DEC Alpha architecture. There are annotation points where the user can specify the machine state to extract. EEL (Executable Editing Library) is a library, exible as well, that allows the user to operate on executable les. The abstraction provided by EEL avoids to deal with machine-dependent features and support SPARC architecture at the moment. All these static code annotation methods are to be used in a unique way: the resulting executable is only made of instrumented code and will be executed entirely. Thus, today's static code annotated programs execute slowly when they are used to feed complex cache or micro-architecture simulators. Such slowness is due to: 1. the overhead induced by the execution of numerous added instrumentation instructions; 2. the large size of the instrumented code which a�ects signi cantly the behavior of the memory hierarchy (particularly instruction cache and TLB). An alternative to static code annotation is instruction emulation. Some tools directly emulate each instruction of a given workload in order to simulate architectural components, and may be surprisingly e�cient. Shade [2] is an instruction-set simulator based on dynamic translation of simulated instructions. On the rst occurrence of a basic block in an application, Shade translates it in a sequence of native instructions in which instrumentation code for trace recording is embedded. On further occurrences of the same basic block, the emulation sequence is directly invoked by the simulator. Slowdowns from 9 to 14 were reported using Shade for address traces instrumentation. Note that this approach allows to trace the activity in dynamically linked codes. SimOS is a complete simulation environment capable of modeling an entire computer system, including full operating system and all application programs that run on top of it [11]. SimOS relies on the same principle of dynamic translation as Shade. However, SimOS allows a less detailed-execution mode called direct-execution mode which can provide more e�ective performance. This mode is used on sections the user is not interested in tracing (e.g. the operating system boot or the beginning of a user application). Switching from directexecution mode to other (time consuming) emulation modes (to collect traces) on event occurring is allowed by the simulator [10].
2.2 Principles of Code Cloning Tracing
For large applications consuming several CPU hours, the trace cannot be realistically stored or consumed at execution time (trillions of trace elements!). Techniques to reduce this large data set include trace sampling as suggested by [4, 6, 8]. However, such techniques also slow the overall trace collection process. Instead of sampling the resulting trace after (or during) execution to reduce the trace volume 2 , we propose to sample the execution of the program by implementing two execution modes: a \no-trace collection" mode and a \trace collection" mode. This might allow a low execution slowdown on the application part where the trace will not be collected (for instance, on a large application, more than 99 % of the original executed instructions may not be traced).
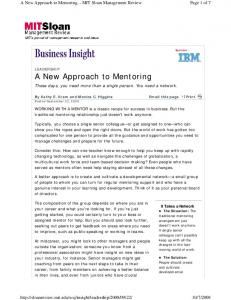
The principle of Code Cloning Tracing is reported in Figure 1. The original code is duplicated. The rst code copy, called P exec , is instrumented in a \light" way, in order to get an execution time close to the original one. The second code copy, called P inst , is annotated by the trace user to gather information for simulations or statistics on the execution. At execution time, P exec is executed most of the time, but some events make the execution be switched to the trace collection mode: P inst is executed and a trace sample (could be several thousands or millions of references) is collected. Other events related to P inst allow the execution to resume in \no-trace collection" mode: P exec is executed. The choice of these events is further discussed in Section 3.2.1. Typically, P exec executes most of the time. This code copy is lightly instrumented and induces only a small execution overhead (compared to the execution of the original program). The size of P exec code is also close 2 Trace volume is used here for convenience; by trace volume, we mean the volume of information that is passed to an on-line simulator or stored in a trace le.
Irisa
5
Code Cloning Tracing: A New Approach to Trace Collection P_inst
P_exec Event_bis
Event
Event
Event_bis
Event
original code instrumentation code to jump between P_exec and P_inst instrumentation code to collect trace
Event_bis
execution
jumps between both versions of the program
Figure 1: Execution of cloned code to collect trace. to the size of the original code. As a result, the behavior of the memory hierarchy (including TLBs) only su�ers from a tiny change provided that P exec and P inst are allocated in di�erent memory pages. As SimOS, Code Cloning Tracing will provide a fast execution mode for sections that are not to be simulated, and a time consuming trace collection mode. A contrario from SimOS, Code Cloning Tracing relies on a static code annotation. Very high performance is obtained on \no-trace collection" mode as reported in Section 4.
2.3 Finely Tuning the Framework
The basic technique presented above is quite general. At implementation level, some tradeo�s about the overall trace collection process must be considered. First, a tradeo� between the trace volume and the execution time: the larger the trace collected, the higher the execution slowdown. The trace collection will be tuned depending on the maximum allowed execution slowdown and on the trace usage. Second, the events determining switching between both copies of code must be determined at implementation level and judiciously chosen in an empirical way. Events may be internally generated by the application or external. When the events are internal, they have to be distributed as evenly as possible all along the execution code. In this case, one can count them at run time. The mode switching may be performed when the counter reaches a threshold value. This value can easily be further tuned as a parameter of the execution setup. Third, the trace user can choose the type of information to collect. The calvin prototype presented in the next section is only a framework allowing an easy and exible further code instrumentation. Notice that, a contrario of other static code annotation methods, there is no special requirement to optimize the instrumented code. If P exec is executed on 99.9 % of the instructions (with a slowdown of 1.2 for instance), and if the P inst slowdown is 1,000 (some quite complex on-line simulation for instance), the overall execution slowdown will be: 0:999 � 1:2 + 0:001 � 1; 000 ' 2:2.
PI n�1176
6
Thierry Lafage, Andr�e Seznec, Erven Rohou, Fran�cois Bodin
3 Implementations for Mono-process Applications
Code Cloning Tracing is a general technique. Our prototype, called calvin 3 works only on stand-alone applications. However, most of the technical issues associated with switching from \no-trace collection" mode to \trace collection" mode and vice-versa will be the same for instrumenting multi-process workloads and even a complete operating system. calvin also allows to validate the approach from the performance point of view: on \no-trace collection" mode, the slowdown induced by our approach is around 20{30% and therefore can be supported by most real users. In order to favor exibility, portability, ease of use, and ease of implementation, calvin was made on top of the Salto system [9]. calvin allows to build two types of application clones according to its execution mode: the rst type of clones performs switches upon internal events (inner mode), while the second type deals with an added external event materialized by a shared variable (shm mode). We rst brie y overview the Salto system [9] which was used by calvin to actually clone the code at assembly language level. Then we present calvin itself.
3.1 Concept and Features of
Salto
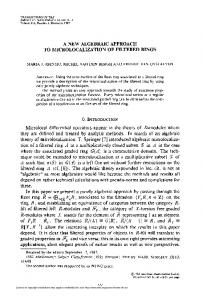
Salto is a retargetable framework for developing the whole spectrum of tools that manipulate programs expressed in assembly language. This meta-tool is composed of three parts: a kernel, a target description le and the tool provided by the user. Figure 2 shows how these three components interact. Salto system
User tool
test program
machine description ex.s
C++
tool.so
tool.cc
SALTO
ex.salto.s
Figure 2: Salto system overview. The kernel performs common house-keeping tasks the developer does not want to worry about, like parsing the assembly code and the target description le. The kernel provides also an internal representation of the tested program which is available via the user interface. The target description le contains the hardware con guration and the complete description of the instruction-set architecture, including per-instruction resource reservation table. Changing target architecture is just providing a new description le. The tool implemented by the user uses the internal representation made by the kernel in a exible way, thanks to the object-oriented user interface (C++ classes and methods). Salto hides most of the boring implementation details, and thus allowed us to focus on calvin.
3.2 calvin
Duplicating the code and making sure it executes and switches correctly between both copies leads to several di�culties. First, the events which will determine the switches between both execution modes have to be judiciously chosen. At second, a correspondence between both code copies must be maintained, and unwanted mode switching should be avoided by dealing with control-transfer instructions (CTIs). Finally, a further instrumentation of the P inst copy must be possible. Each of these points is addressed below. 3c
loning assembler and looking into veritable instrumentation needs. Irisa
Code Cloning Tracing: A New Approach to Trace Collection
7
3.2.1 Choosing the Events
We chose to switch the execution mode (in a symmetrical way) upon procedure calls. The PC (Program Counter) switches from one copy to the other when a certain number of these events are executed. For instance, to switch execution from P exec to P inst 10,000 procedure calls must have been executed; to switch execution from P inst to P exec 10 procedure calls must have been executed. So, if procedure calls are ideally (i.e. evenly) distributed among the instructions, 0:1 % of the initial instructions will be executed in the trace-collection mode. We chose such events to facilitate the design of a rst implementation, for three main reasons: 1. Globally, procedure calls are relatively rare in C-programs, but are not so uncommon (for instance, in the programs from the SPEC95 integer benchmark suite, their frequency varies between 0.08 % and 1.6 %). Thus, the code added for mode switching is not executed frequently and the induced overhead is not very high. On the other hand, as procedure calls are not so uncommon, they allow a reasonable control on switches between the two execution modes. 2. In a program, a procedure call represents an important change in the execution control ow, often followed by changes in the environment. The PC gets a new value and its old value is saved, and some of the general registers are also often saved, in order to get new ones for the callee procedure. Thus, performing a jump to the other copy of the program near a procedure call will be easier (the inserted code can be shorter). 3. For stand-alone application tracing, it allows reproducible tracing/on-line simulation chains often needed to compare several micro-architecture ideas.
3.2.2 Correspondence between P exec and P inst
Maintaining a strict correspondence between every instruction in P exec and P inst would require a very large table. Such a full correspondence is not needed in practice. On the appearance of a switch event, the switch must occur to the right place. However, we will see in the next section that inopportune come-backs (i.e. unwanted switches from P inst to P exec or vice-versa) have to be avoided. In the P exec copy, every switch point must have its associated entry point in P inst . calvin inserts assembly-language labels at entry points. The switch itself consists of a jump to this label. Any inserted code must not alter the normal execution of the program and, in particular, must ensure that the registers keep the same values, from the original code point of view. So the registers used by the inserted code must rst be saved and then restored. In order to reduce the added overhead, the inserted code uses dead registers 4 whenever possible.
3.2.3 Dealing with Control-transfer Instructions
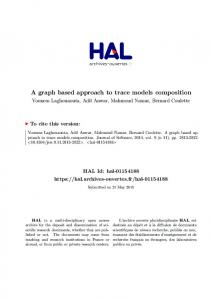
A switch from or to trace-collection mode on the tested program is a control ow change. The original program itself also performs control ow changes with control-transfer instructions (CTIs) such as jump, conditional branch, procedure call, . . . At this level, we must ensure that during the execution, the PC will not jump from P exec to P inst (or vice-versa) except when the correct event is encountered. While working at assembly language level, this is relatively straightforward when the CTI branches to a named label. However, indirect jumps are also allowed: the target address is stored in a register, and is a computed value. With such indirect jumps, the target address is only known at execution time and unwanted mode switches may arise. Moreover, when a switch from P inst to P exec (or vice-versa) occurs during the computation of an indirect jump target address, the result may be undetermined. For instance, as shown in Figure 3, the target address may depend on a P exec or P inst basic block address. Common use of indirect jumps includes: � C-switch statements (the branch to the right \case" is sometimes performed using an indirect jump); � returns from procedure; � some procedure calls like function-pointer calls. 4 At a given place in the code, dead registers are ones which will be written before they are read. So, at this place, they can be used by the inserted code.
PI n�1176
8
Thierry Lafage, Andr�e Seznec, Erven Rohou, Fran�cois Bodin P_exec
P_inst
set foo, R1 switch_to_P_inst compute R1 jump R1
set foo_bis, R1 label_added:
foo:
compute_bis R1 jump R1
to ?? because the computed value depends on "foo" (in P_exec) and might depend on P_inst’s labels ("compute_bis" may be dif-ferent from "compute").
foo_bis:
Added code.
Figure 3: Problem with indirect jumps. More generally, from our experiments on compiler-generated codes, indirect jumps appear either inside a procedure like C-switch statements (the target address points out to an instruction into the procedure and is locally processed), or as a procedure call or return. Another type of indirect jump exists: setjmp/longjump C-statements. We ignored, here, these functions because they typically execute when abnormal execution happens. But, as shown in Figure 4, some code can be added just after \setjmp" statement (\call setjmp" in assembler) to make a switch to the other code copy if required. Consequently, calvin implements the mode switch round a procedure call (just before or just after). This guarantees that indirect jumps inside a procedure (assembly code of C-switch statements) will execute correctly. Returns from procedures are managed by inserting code at the return point to ensure the PC is right. This code makes sure the execution resumes at the right place, otherwise makes a jump to the homologous code. Figure 4 illustrates how calvin handles this di�culty 5 . P_exec
return from "foo" here
P_inst
call foo Should we be in P_exec ? yes rest of the program
call foo_bis
no
no
return from "foo_bis" here
Should we be in P_inst ? yes
label
label_bis
rest of the program
Inserted code
Figure 4: The management of the returns from procedure.
3.2.4 calvin's modes
There are numerous solutions to execute the switch between both copies of code, upon a \call" event. Figure 5 describes the code section we inserted to perform the switches upon procedure calls on an internal event (inner mode of calvin). This code section will perform the switch from \no-trace collection" mode to \trace collection" mode after P exec threshold procedure calls (and vice-versa). First, at the beginning of the procedure, a mode 5 The answer to \Should we be here?" is stored in a boolean variable updated each time the execution switches to another copy of the code.
Irisa
9
Code Cloning Tracing: A New Approach to Trace Collection
check is done because the procedure might have been called with an indirect call. Then a counter is incremented and tested. If required, the switch is performed. This mode allows reproducible tracing/on-line simulation chains. P_exec
P_inst
no
no
foo: Should we be in P_exec?
foo_bis: Should we be in P_inst?
yes
yes
++p_exec_counter == p_exec_threshold ?
yes
yes
p_inst_counter := 0
p_exec_counter := 0
++p_inst_counter == p_inst_threshold ?
no
no
foo code
foo_bis code
Inserted code
Figure 5: Switching from one copy of code to the other. For collecting information, we may also rely on external events. Such a mode switch is implemented as follows (shm mode of calvin): a shared variable, called Is exec , is periodically read by the two clones of the tested application. According to its value, a given copy of the code is executed (i.e. the switch is performed or not). An external process controls the execution mode by writing Is exec . In this case, Is exec is read in the traced process when each internal event appears (procedure call). The inserted code in the cloned application is slightly shorter than for the inner mode of calvin, because there is no need for internal counters. *.s
calvin.so
SALTO *.exec.s
*.inst.s
SALTO
Instrumentation_tool.so
*.inst.i.s
Concat
*.cloned-instr.s
Assemble instrumentation-code.o setup_code_cloning.o
Link
Application.cloned.intrumented
Figure 6: Generating a cloned-instrumented application.
PI n�1176
10
Thierry Lafage, Andr�e Seznec, Erven Rohou, Fran�cois Bodin
3.2.5 Making the Trace User's Instrumentation Possible calvin serves as a framework for a trace user who needs to collect a trace. He/she will only have to instrument P inst . Figure 6 illustrates the approach. calvin builds two code copies, then the trace user provides its own
instrumentation which is applied to P inst . Finally both copies of the application are assembled, and then linked with speci c instrumentation code.
4 Experimental Results We provide here some experimental results on the distribution of the events in the tested applications, and on execution times using cloned applications with each of calvin's execution mode (inner and shm ) and their induced overhead. calvin has been implemented on a SPARC architecture, and the experimental results were collected from a Sun Ultra 30 Model 295 with a 295 MHz UltraSPARC-II processor and 128 MB of memory, running Solaris 2.5.1. In order to validate our approach, we instrumented the popular SPEC95 integer benchmark suite (CINT95). These programs were compiled with GCC (version 2.7.2.1) without any optimization option. The option '-Wa,xarch=v8plus' allowed the SPARC-V8plus instructions to save/restore the integer condition codes. Each run on this benchmark suite was tested on the ref input data set.
4.1 Distribution of the Events in the Tested Code
Table 1 rst presents some statistics about the events we chose and their distribution among the executed instructions. These results were collected using an instrumentation on the full code. We de ne a distance between two internal events (here procedure calls) as: the number of executed instructions between the events.
Millions instr. executed 099.go 124.m88ksim 126.gcc � 129.compress 130.li 132.ijpeg 134.perl 147.vortex
69,562 159,286 2,103 89,592 106,685 57,932 29,564 124,057
Millions events executed (ratio y)
353 (0.51 %) 1,059 (0.67 %) 18 (0.89 %) 1,148 (1.28 %) 1,710 (1.60 %) 46 (0.08 %) 404 (1.37 %) 1,407 (1.13 %)
Distances between events demin. mean max. std. viation 3 3 3 13 3 3 4 7
197 150 113 78 62 1,248 73 88
349,200 456,799 1,747,793 1,622,898 646,719 3,309,149 3,766,198 431,542
393 788 776 168 18,487 8,665 226 1,648
. 100 � (number of events=number of instructions). . The information supplied here concerns only one of the 56 executions performed by the benchmark with the ref input data set. Other executions provide quite similar results.
y
�
Table 1: Statistics about application procedure calls within executed instructions in SPEC95 integer benchmarks. We can notice that the results of Table 1 depend a lot on the tested program. For instance, even if 132.ijpeg and 130.li event ratio are very close (the di�erence is a small absolute value), the average distance between two events in these two programs are very di�erent (1,248 vs. 62). This means that the control on the switches between P exec and P inst will be much ner in 130.li than in 132.ijpeg. On the other hand, the standard deviation of the distances between the events give an idea of the regularity of the distribution of the events among the code. 130.li has got the worse standard deviation, so the control of the switches between the two Irisa
Code Cloning Tracing: A New Approach to Trace Collection
11
cloned copies might be very good (events close to each other) in a given portion of code, and very bad in other portions of code (events far from each other). Globally, the disparity of the results presented in Table 1 points out the necessity to have a per-application type of events in order to obtain: 1. a better balance of the events/instructions ratio executed between the tested applications; 2. a better regularity in the distribution of the events between instructions. This will be one of our future works. This is particularly important if we also want to be able to provide meaningful sample traces on scienti c programs where millions or even billions of instructions may be executed on a single procedure call. However, as we expected, the events do not have a too high frequency in the executed code, but they are su�ciently present, in the range of about 1 % 6 . So we may expect that the slowdown induced by calvin's inserted code will not be prohibitive.
4.2 Execution Times on the SPEC95 Integer Benchmarks
In order to quantify the overhead induced by calvin, we present execution times on the SPEC95 integer benchmark suite with the ref input data set. Here, we also acted as trace users and we instrumented in a quite straightforward way the P inst copy of the cloned applications to get data references (code was inserted near each load or store instruction). These (quite expensive) sections of code save registers and condition codes, and call a routine which processes the references. For the cloned-instrumented applications presented here, this routine simulates some data cache con gurations which are set up before execution. This routine is very expensive and may induce a slowdown in the range of 100 if executed within the whole application. The di�erent program versions we ran were: � the stand-alone program which gives the base execution time; � two cloned-instrumented versions simulating six di�erent 32 KB data cache con gurations (from direct mapped to 4-way set-associative with various placement and replacement algorithms). In these two versions, the user-instrumentation provided is the same, while the cloning mode is di�erent: the rst (inner mode) makes switches upon internally counted events (procedure calls), and the second (shm mode) makes switches according to a shared variable's value. Table 2 presents the execution times of each SPEC95 integer benchmark for di�erent executions of the programs cited above. Each execution time presented is the longest one of two executions (except for the base time which is the shortest of two executions), and the sum of user and system execution time in seconds. The number in parenthesis represents the slowdown of the concerned workload which is computed as follows: user time + tested system time slowdown = tested base user time + base system time The execution times are displayed for several executions of the same workload, with di�erent switch patterns. \P exec & P inst " switch pattern corresponds to a normal execution of the instrumented programs. The switches from P exec to P inst are performed every 1000 events, and the switches from P inst to P exec are done every 10 events. Therefore, the number of the data references simulated is order of magnitude of 1 % of the total data references. The results given here are only to show an upper bound of the cost of a sampling simulation: the switches are voluntary very frequent and may induce frequent instruction and data caches ushes, therefore increasing the slowdown. Moreover, the trace samples simulated here (a few hundreds or thousands references for each sample) are not large enough to give a realistic simulation result (this was not our goal). We do not display the corresponding result coming from calvin's shm execution mode. It is not possible to simulate exactly the same reference sequence since the process which manages the external variable (Is exec ) is synchronized with the system clock. \P exec only" estimates Code Cloning Tracing's overhead in no-trace collection mode (no mode switch is executed). For internal event switches (calvin's inner mode), the threshold allowing a switch from P exec to The exact mean is 0.94 %. PI n�1176 6
12
Thierry Lafage, Andr�e Seznec, Erven Rohou, Fran�cois Bodin
Base 099.go 124.m88ksim 126.gcc 129.compress 130.li 132.ijpeg 134.perl 147.vortex �
321 (1.00) 604 (1.00) 318 (1.00) 321 (1.00) 544 (1.00) 230 (1.00) 183 (1.00) 617 (1.00)
Shm mode P exec only 347 (1.08) 682 (1.13) 366 (1.15) 388 (1.21) 619 (1.14) 233 (1.01) 240 (1.31) 681 (1.10)
P exec only 396 (1.23) 691 (1.14) 378 (1.19) 382 (1.19) 630 (1.16) 246 (1.07) 227 (1.24) 722 (1.17)
Inner mode
P exec & P inst 805 (2.51) [190 M] � 1,411 (2.33) [453 M] � 722 (2.27) [155 M] � 773 (2.41) [188 M] � 1,348 (2.48) [369 M] � 580 (2.52) [193 M] � 401 (2.19) [77 M] � 1,765 (2.86) [498 M] �
. Millions references simulated.
Table 2: Execution times of the cloned-instrumented SPEC95 integer benchmarks. P inst is set to a value higher than the number of executed events with the ref input data set. For the external event switching version (calvin's shm mode), the shared variable keeps the adequate value during the whole execution of the concerned workloads. As expected, the execution overheads for the two versions of the cloned applications are globally in the same range: generally around 10 to 20 %. Then this makes possible to consider memory hierarchy or micro-architecture studies on large application incurring hours of CPU.
5 Summary and Future Work Most of the popular trace collection software methods only allow to collect user instructions on single processes. They also induce a slowdown incompatible with tracing large applications incurring billions or trillions of instructions. On the other hand, to avoid misleading conclusions, micro-architecture and memory systems studies require more and more accurate traces including kernel activities and multiprocess workloads. Ideally, one would like to collect traces representing the whole punctual activity of a workstation for a few second. Such a collection cannot be realistically considered if trace collection induces a slowdown of 10 or higher on the whole activity of the computer, particularly before the trace collection: no real user may tolerate such a slowdown. The Code Cloning Tracing method we have presented in the paper is a rst step towards the resolution of this di�culty. Code Cloning Tracing is based on sampling the execution and on a static code duplication and instrumentation of the original code. A no-trace collection code copy is nearly identical to the original code, except that events allow mode switching. This copy will be executed most of the time. The second copy is instrumented by the trace user and will produce traces to feed simulators. This copy may have a very signi cant slowdown (let us say 100), but as it is parsimoniously executed, it allows to collect trace samples on very long applications. Code Cloning Tracing can be implemented working either on assembly codes or executables. We preferred the rst method as this favors portability on di�erent platforms (software and hardware). In this paper, we have presented in details the basic principles of Code Cloning Tracing and some technical issues related to its implementation. The calvin prototype we built has been currently tested on single process applications. It has shown to incur a very acceptable slowdown in no-trace collection mode (around 1.2). Such a low slowdown seems to be acceptable for most users. Future developments will rst include collecting traces on a multiprocess workload (using a shared variable like calvin's shm mode). Finally, we plan to use Code Cloning Tracing to completely instrument a desktop computer including all user applications, operating system and libraries. The Linux operating system running on a SPARC machine will be our main target.
References [1] A. Agarwal, M. Horowitz, and J. Hennessy. Cache performance of operating systems and multiprogramming workloads. ACM Transactions on Computer Systems, 6(4):393{431, November 1988. Irisa
Code Cloning Tracing: A New Approach to Trace Collection
13
[2] B. Cmelik and D. Keppel. Shade: A fast instruction-set simulator for execution pro ling. In Proceedings of the 1994 ACM SIGMETRICS Conference on the Measurement and Modeling of Computer Systems, pages 128{137, May 1994. [3] J. D. Gee, M. D. Hill, D. N. Pnevmatikatos, and A. J. Smith. Cache performance of the SPEC92 benchmark suite. IEEE Micro, 13(4):17{27, August 1993. [4] S. Laha, J. Patel, and R. Iyer. Accurate low-cost methods for performance evaluation of cache memory systems. IEEE Transactions on Computers, 37(11):1325{1336, 1988. [5] J. R. Larus and E. Schnarr. EEL: machine-independent executable editing. In David W. Wall, editor, ACM SIGPLAN '95 Conference on Programming Language Design and Implementation (PLDI), volume 30 of ACM SIGPLAN Notices, pages 291{300, New York, NY, USA, June 1995. ACM Press. [6] G. Lauterbach. Accelerating architectural simulation by parallel execution of trace samples. In Trevor N. Mudge and Bruce D. Shriver, editors, Proceedings of the 27th Hawaii International Conference on System Sciences. Volume 1 : Architecture, pages 205{210, Los Alamitos, CA, USA, January 1994. IEEE Computer Society Press. [7] M.H. Lipasti and J.P. Shen. Exceeding the data ow limit with value prediction. In Proceedings of the 29th International Symposium on Microarchitecture, 1996. [8] T. Puzak. Analysis of cache replacement algorithms. PhD thesis, University of Massachusetts, 1985. [9] E. Rohou, F. Bodin, and A. Seznec. Salto: System for assembly-language transformation and optimization. In Proceedings of the Sixth Workshop Compilers for Parallel Computers, December 1996. [10] M. Rosenblum, E. Bugnion, S. Devine, and S. A. Herrod. Using the SimOS machine simulator to study complex computer systems. ACM Transactions on Modeling and Computer Simulation, 7(1):78{103, January 1997. [11] M. Rosenblum, S. A. Herrod, E. Witchel, and A. Gupta. Complete computer system simulation: The SimOS approach. IEEE parallel and distributed technology: systems and applications, 3(4):34{43, Winter 1995. [12] A. J. Smith. Cache evaluation and the impact of workload choice. Proceedings of the 12th Annual Symposium on Computer Architecture, pages 64{73, June 1985. [13] M. D. Smith. Tracing with Pixie. Technical report, Center for Integrated Systems, Stanford University, sep 1990. [14] A. Srivastava and A. Eustace. ATOM: A system for building customized program analysis tools. In Proceedings of the SIGPLAN '94 Conference on Programming Language and Implementation, pages 196{ 205, June 1994. [15] R. Uhlig and T. Mudge. Trace-driven memory simulation: a survey. ACM Computing Surveys, 1997. [16] R. Uhlig, D. Nagle, T. Mudge, and S. Sechrest. Trap-driven simulation with Tapeworm II. In Proceedings of the Sixth International Conference on Architectural Support for Programming Languages and Operating Systems (ASPLOS-VI), pages 132{144, San Jose, California, October 1994. [17] R. Uhlig, D. Nagle, T. Mudge, S. Sechrest, and J. Emer. Coping with code bloat. In Proceedings of the 22nd Annual International Symposium on Computer Architecture, June 1995.
PI n�1176