Cloning Tracing method and presents calvin, our first implementation. On the SPEC95 suite, calvin exhibits low execution slowdown factors in âno-trace ...
Code Cloning Tracing: A “Pay per Trace” Approach Thierry Lafage, Andr´e Seznec, Erven Rohou, and Fran¸cois Bodin IRISA, campus de Beaulieu, 35042 Rennes cedex, France {Thierry.Lafage, Andre.Seznec, Erven.Rohou, Francois.Bodin}@irisa.fr
Abstract. Code Cloning Tracing is a new software annotation method that makes it possible to collect traces from time consuming applications. To this end, Code Cloning Tracing provides instrumented programs with two execution modes: a low overhead “no-trace collection” mode which serves to position the application in an interesting state with regard to tracing, and a “trace collection” mode. This paper details the Code Cloning Tracing method and presents calvin, our first implementation. On the SPEC95 suite, calvin exhibits low execution slowdown factors in “no-trace collection” mode varying from 1.02 to 2.09.
1
Introduction and Motivations
Execution traces are needed for architecture simulations and validations in processor design, or for validations of new microarchitecture ideas. The process of collecting traces is time consuming (execution slowdowns in the 10-100 range [6]), and even more time consuming is microarchitecture simulation (slowdowns in the 1,000–10,000 range [1]). As a result, in practice, most microarchitecture studies are performed using the first instructions (maybe a few billion) of an application and skipping the first billion(s) to avoid the initialization phase (see [2]). This solution may still be very time consuming since the tested application is instrumented/simulated entirely: skipping the first instructions still induces a nonnegligible execution overhead. Consequently, large workloads (running hours of CPU) are never used in microarchitecture studies. In this paper, we introduce Code Cloning Tracing, a new software annotation method for collecting traces. Code Cloning Tracing is aimed at collecting large trace samples on large applications for microarchitecture studies and focuses on the execution slowdown of the traced applications when the trace is not used (collected). The Code Cloning Tracing’s key feature is to provide intrumented programs with two execution modes: a low overhead “no-trace collection” mode and a “trace collection” mode through a static code duplication (cloning). The code duplication produces two clones which are part of the same executable program. During the execution, some events activate dynamic execution switches between both clones, enabling or disabling the trace collection. In this paper, we only focus on the “no-trace collection” mode performance, knowing that current techniques (e.g. see [3]) may be applied to the “trace collection” mode. P. Amestoy et al. (Eds.): Euro-Par’99, LNCS 1685, pp. 1265–1268, 1999. c Springer-Verlag Berlin Heidelberg 1999
1266
Thierry Lafage et al.
In the next section, we detail the Code Cloning Tracing method. Section 3 presents the first implementation called calvin. An evaluation of the execution overhead in “no-trace collection” mode is presented in Section 4. Section 5 summarizes this study and presents our directions for future development.
2
Principle of Code Cloning Tracing
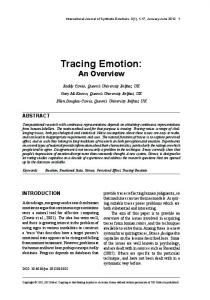
The principle of Code Cloning Tracing is illustrated in Figure 1. The original code is duplicated. Both code copies (clones) are annotated in order to enable the execution to dynamically switch between each other. One of the clones, called P inst , is heavily instrumented by the trace user 1 and allows the trace to be generated. The second clone, called P exec, is kept nearly identical to the original code. P exec provides the “no-trace collection” mode. This clone is expected to induce a very low execution overhead.
P_exec Event
P_inst
Event_bis Event
original code instrumentation code to jump between P_exec and P_inst instrumentation code to collect trace execution
Event Event_bis
jumps between both versions of the program
Fig. 1. Execution of cloned code to collect trace.
On a large application, P exec will execute most of the original instructions (“no-trace collection” mode) to position the application in a state in which trace collection and simulation are interesting, at a very low execution overhead (compared to P inst ). This technique can be related to SimOS [5] with even less execution overhead when trace is not generated.
3
Code Cloning Tracing with Calvin
Code Cloning Tracing is a general technique and may be implemented at various levels: executable or assembly code. Our first prototype, calvin 2 uses Salto, a 1
2
For convenience, we call a trace user someone who collects program traces. He/she uses the framework we provide, but also needs to instrument the tested applications to get the traces he/she wants. cloning assembler and looking into veritable instrumentation needs.
Code Cloning Tracing: A “Pay per Trace” Approach
1267
retargetable framework for developing tools that manipulate programs expressed in assembly language [4]. 3.1
Checkpoint Code
The annotation code added by calvin is composed of several checkpoints. Checkpoints are a few instructions (about 10) which check that the current clone running is the right one. When this is not the case (an activating event has occured), control is given to the other clone. We inserted checkpoints at each procedure call and inside each loop. With a complete ad-hoc instrumentation of each SPEC95 benchmark program, we computed the number of executed checkpoints among the executed instructions. This computation shown a reasonable number of checkpoints among executed instructions (5.02 % on average for CINT95 programs, and 2.53 % on average for CFP95’s) which allowed us to expect low execution slowdowns in “no-trace collection” mode, as seen in Section 4. 3.2
Activating Mode Switching
An event determines when to switch to the other clone of the tested application as shown in Figure 1. In the first implementation of calvin, the event used is a given number of executed checkpoints in each clone.
4
No-Trace Collection Mode Slowdown
In order to validate our approach, we cloned and instrumented the popular SPEC95 benchmark suite. These programs were compiled with gcc or g77 with ‘-O3’ optimization option 3 . Each run on this benchmark suite was tested with the ref input data set. calvin can annotate SPARC assembly code, and all the results were collected from a Sun Ultra 1 workstation with a 143 MHz processor and 256 MB of memory, running Linux. Here, we also acted as trace users to obtain completely instrumented applications, like computer architects would do. We heavily instrumented the P inst clone to produce instruction and data addresses. Since this study is not directed at the performance of the “trace collection” mode, we did not collect any traces, rather the programs entirely ran in “no-trace collection” mode. Table 1 presents the execution times (user + system, in seconds) of each SPEC95 benchmark. The base time is the execution time of the original (i.e. non instrumented) program. The number in parentheses represents the slowdown of time the concerned workload which is computed as follows: slowdown = tested base time . As expected, the execution overheads are quite low: from 1.02 to 2.09. Note that they are directly related to the number of checkpoints executed. 3
145.fpppp only compiled with ‘-O1’.
1268
Thierry Lafage et al.
CINT95 Base P exec only 099.go 276 438 (1.58) 124.m88ksim 554 1151 (2.09) 126.gcc 10 16 (1.57) 129.compress 413 784 (1.90) 130.li 575 1130 (1.96) 132.ijpeg 378 445 (1.18) 134.perl 267 351 (1.32) 147.vortex 728 998 (1.37)
CFP95 101.tomcatv 102.swim 103.su2cor 104.hydro2d 107.mgrid 110.applu 125.turb3d 141.apsi 145.fpppp 146.wave5
Base P exec only 625 696 (1.11) 548 628 (1.15) 619 709 (1.15) 772 1024 (1.33) 1533 1630 (1.06) 2592 3059 (1.18) 3460 3899 (1.13) 1057 1213 (1.15) 2048 2071 (1.02) 864 1164 (1.35)
Table 1. “No-trace collection” mode execution time (sec.) on the SPEC95 benchmarks.
5
Summary and Future Work
In this paper, we have presented the basic principles of Code Cloning Tracing. calvin, the prototype we built, has been currently tested on single process applications. It has shown to induce a very acceptable execution slowdown in “no-trace collection” mode (from 1.02 to 2.09). Such a low slowdown would be acceptable for computer architects to position large workloads (with their large data sets) in interesting tracing states. Future developments will first include trace collection on multiprocess workloads using external events to switch between both execution modes, and dynamically linked libraries (libc, libg2c, . . . ). Finally, we plan to use Code Cloning Tracing to instrument all user applications and the operating system on a desktop computer.
References [1] D. C. Burger and T. M. Austin. The SimpleScalar tool set, version 2.0. Technical Report CS-TR-97-1342, University of Wisconsin, Madison, June 1997. [2] M. J. Charney and T. R. Puzak. Prefetching and memory system behavior of the SPEC95 benchmark suite. IBM Journal of Research and Development, 41(3), 1997. [3] Alvin R. Lebeck and David A. Wood. Active memory: A new abstraction for memory system simulation. ACM Transactions on Modeling and Computer Simulation, 7(1):42–77, January 1997. [4] E. Rohou, F. Bodin, and A. Seznec. Salto: System for assembly-language transformation and optimization. In Proceedings of the Sixth Workshop Compilers for Parallel Computers, December 1996. [5] M. Rosenblum, E. Bugnion, S. Devine, and S. A. Herrod. Using the SimOS machine simulator to study complex computer systems. ACM Transactions on Modeling and Computer Simulation, 7(1):78–103, January 1997. [6] R. Uhlig and T. Mudge. Trace-driven memory simulation: a survey. ACM Computing Surveys, 1997.


![Pay-Per-Install - Symantec [PDF]](https://m.moam.info/img/260x300/pay-per-install-symantec-pdf_648c6fd1098a9e974a8b4620.jpg)


