Auditory Cortical Images of Cochlear-Implant Stimuli: Coding of Stimulus Channel and Current Level John C. Middlebrooks and Julie Arenberg Bierer J Neurophysiol 87:493-507, 2002. You might find this additional info useful... This article cites 31 articles, 6 of which can be accessed free at: http://jn.physiology.org/content/87/1/493.full.html#ref-list-1 This article has been cited by 7 other HighWire hosted articles, the first 5 are: Cochlear-Implant High Pulse Rate and Narrow Electrode Configuration Impair Transmission of Temporal Information to the Auditory Cortex John C. Middlebrooks J Neurophysiol, July, 1 2008; 100 (1): 92-107. [Abstract] [Full Text] [PDF]
Direct and Indirect Activation of Cortical Neurons by Electrical Microstimulation E. J. Tehovnik, A. S. Tolias, F. Sultan, W. M. Slocum and N. K. Logothetis J Neurophysiol, August, 1 2006; 96 (2): 512-521. [Abstract] [Full Text] [PDF] Redundancy and Synergy of Neuronal Ensembles in Motor Cortex Nandakumar S. Narayanan, Eyal Y. Kimchi and Mark Laubach J. Neurosci., April, 27 2005; 25 (17): 4207-4216. [Abstract] [Full Text] [PDF] Neuronal Responses in Cat Primary Auditory Cortex to Electrical Cochlear Stimulation: IV. Activation Pattern for Sinusoidal Stimulation Marcia W. Raggio and Christoph E. Schreiner J Neurophysiol, June, 1 2003; 89 (6): 3190-3204. [Abstract] [Full Text] [PDF] Updated information and services including high resolution figures, can be found at: http://jn.physiology.org/content/87/1/493.full.html Additional material and information about Journal of Neurophysiology can be found at: http://www.the-aps.org/publications/jn
This infomation is current as of March 8, 2011.
Journal of Neurophysiology publishes original articles on the function of the nervous system. It is published 12 times a year (monthly) by the American Physiological Society, 9650 Rockville Pike, Bethesda MD 20814-3991. Copyright © 2002 by the American Physiological Society. ISSN: 0022-3077, ESSN: 1522-1598. Visit our website at http://www.the-aps.org/.
Downloaded from jn.physiology.org on March 8, 2011
Evidence of a Tonotopic Organization of the Auditory Cortex in Cochlear Implant Users Jeanne Guiraud, Julien Besle, Laure Arnold, Patrick Boyle, Marie-Hélène Giard, Olivier Bertrand, Arnaud Norena, Eric Truy and Lionel Collet J. Neurosci., July, 18 2007; 27 (29): 7838-7846. [Abstract] [Full Text] [PDF]
J Neurophysiol 87: 493–507, 2002; 10.1152/jn.00211.2001.
Auditory Cortical Images of Cochlear-Implant Stimuli: Coding of Stimulus Channel and Current Level JOHN C. MIDDLEBROOKS AND JULIE ARENBERG BIERER Kresge Hearing Research Institute (Department of Otorhinolaryngology) and Neuroscience Program, University of Michigan, Ann Arbor, Michigan 48109-0506 Received 12 March 2001; accepted in final form 20 September 2001
INTRODUCTION
In the companion paper (Bierer and Middlebrooks 2002), we describe the spatiotemporal patterns of cortical activity in the guinea pig auditory cortex that are elicited by stimulation of a Address for reprint requests: J. C. Middlebrooks, Kresge Hearing Research Institute, 1301 E. Ann St., Ann Arbor, MI 48109-0506 (E-mail:
[email protected]). www.jn.org
cochlear implant. We refer to the patterns elicited by various stimuli as the “cortical images” of those stimuli. Cortical images tended to shift systematically from rostral to caudal in the cortex as the place of cochlear stimulation (i.e., the implant channel) was shifted from basal to apical. Cortical images differed substantially according to the configuration of the stimulating electrodes. Electrode configurations that are presumed to produce more diffuse cochlear electrical fields, such as the monopolar configuration, resulted in cortical images that spanned substantial regions of the auditory cortex, even when stimulus levels were within a few decibels of threshold. Conversely, configurations such as tripolar that are presumed to produce more focal cochlear electric fields produced cortical images that remained restricted across a relatively broad range of stimulus levels. Those results suggest two hypotheses: first, that compared with diffuse configurations, focal electrical configurations permit more accurate cortical representation of place of cochlear stimulation; and second, that focal configurations exhibit a wider dynamic range of distinguishable current levels. Those hypotheses have important implications for the use of cochlear prostheses by humans. We presume that a cochlearprosthesis user’s ability to recognize speech is limited by the accuracy by which place-of-stimulation or level information is transmitted to his or her auditory cortex. For that reason, analysis of cortical images of various electrode configurations in an animal model might predict the relative accuracy of users’ performance in perceptual tasks using corresponding electrode configurations. In particular, there is some indication that users’ ability to recognize speech through a cochlear prosthesis tends to correlate with their ability to identify cochlear place of stimulation (Collins and Throckmorton 2000; Donaldson and Nelson 2000; Henry et al. 2000). For that reason, analysis of place-of-stimulation coding in the cortex could provide insights for design of speech processors for cochlear implants. Comparisons of psychophysical responses among various electrode configurations has been conducted to a limited extent in human prosthesis users, but those studies were limited by restricted access to cochlear electrodes via trans-cutaneous radio-frequency links, limitations in listener time, and safety concerns. The present animal model avoided The costs of publication of this article were defrayed in part by the payment of page charges. The article must therefore be hereby marked ‘‘advertisement’’ in accordance with 18 U.S.C. Section 1734 solely to indicate this fact.
0022-3077/02 $5.00 Copyright © 2002 The American Physiological Society
493
Downloaded from jn.physiology.org on March 8, 2011
Middlebrooks, John C. and Julie Arenberg Bierer. Auditory cortical images of cochlear-implant stimuli: coding of stimulus channel and current level. J Neurophysiol 87: 493–507, 2002; 10.1152/jn.00211.2001. This study quantified the accuracy with which populations of neurons in the auditory cortex can represent aspects of electrical cochlear stimuli presented through a cochlear implant. We tested the accuracy of coding of the place of stimulation (i.e., identification of the active stimulation channel) and of the stimulus current level. Physiological data came from the companion study, which recorded spike activity of neurons simultaneously from 16 sites along the tonotopic axis of the guinea pig’s auditory cortex. In that study, cochlear electrical stimuli were presented to acutely deafened animals through a 6-electrode animal version of the 22-electrode Nucleus banded electrode array (Cochlear). Cochlear electrode configurations consisted of monopolar (MP), bipolar (BP ⫹ N) with N inactive electrodes between the active and return electrodes (0 ⱕ N ⱕ 3), tripolar (TP) with one active electrode and two flanking return electrodes, and common ground (CG) with one active electrode and as many as five return electrodes. In the present analysis, an artificial neural network was trained to recognize spatiotemporal patterns of cortical activity in response to single presentations of particular stimuli and, thereby, to identify those stimuli. The accuracy of pair-wise discrimination of stimulation channels or of current levels was represented by the discrimination index, d⬘, where d⬘ ⫽ 1 was taken as threshold. In many cases, the threshold for discrimination of place of cochlear stimulation was ⬍0.75 mm, and the threshold for discrimination of current levels was ⬍1 dB. Cochlear electrode configurations varied in the accuracy with which they signaled to the auditory cortex the place of cochlear stimulation. The BP ⫹ N and TP configurations provided considerably greater sensitivity to place of stimulation than did the MP configuration. The TP configuration maintained accurate signaling of place of stimulation up to the highest current levels, whereas sensitivity was degraded at high current levels in BP ⫹ N configurations. Electrode configurations also varied in the dynamic range over which they signaled stimulus current level. Dynamic ranges were widest for the BP ⫹ 0 configuration and narrowest for the TP configuration. That is, the configuration that showed the most accurate signaling of cochlear place of stimulation (TP) showed the most restricted dynamic range for signaling of current level. These results suggest that the choice of the optimal electrode configuration for use by human cochlear-prosthesis users would depend on the particular demands of the speechprocessing strategy that is to be employed.
494
J. C. MIDDLEBROOKS AND J. A. BIERER
METHODS
Physiological data The analysis reported here was based on neurophysiological data from 6 of the 10 guinea pigs described in the companion paper (Bierer and Middlebrooks 2002). The six were chosen because they were tested with the largest number of electrode configurations: all were tested with two or more bipolar configurations and with tripolar configurations, all but one were tested with the monopolar configuration, and all but one were tested with the common ground configuration. Essential elements of electrical stimulation and physiological recording procedures are summarized here. All animal procedures were in accordance with policies of the University of Michigan Committee of Use and Care of Animals. Animals were anesthetized and deafened acutely. Electrical stimuli were presented from a six-electrode banded electrode array (Cochlear, Inglewood, CO) implanted through a cochleostomy into the scala tympani. The number of electrodes that was successfully inserted varied among animals: two animals had four working electrodes, two had five, and two had six. Stimuli were single biphasic pulses, 200 s/phase, initially cathodal. The tested electrode configurations were as follows. In the monopolar (MP) configuration, the active electrode was a single intra-scalar electrode, and the return was through a wire positioned in a neck muscle. In the bipolar configuration, the active electrode was one intra-scalar electrode, and the return was a more apical intra-scalar electrode. In bipolar configurations BP ⫹ 0, BP ⫹ 1, BP ⫹ 2, and BP ⫹ 3, the active and return electrodes were separated by, respectively, 0, 1, 2, or 3 inactive electrodes, resulting in center-to-center spacing of 750 –3,000 m from active to return electrodes; the BP ⫹ 0 configuration usually is referred to as “BP” in the implant literature. In the tripolar (TP) configuration, the active electrode was a single intra-scalar electrode, and the return consisted of the two adjacent electrodes, each carrying one-half of the return current. Based on electric-field models and physical measurements (Kral et al. 1998; Spelman et al. 1995), we presume that the cochlear J Neurophysiol • VOL
extent of electric stimulation at a constant current level ranked from diffuse to focal in the order MP, BP ⫹ 3, BP ⫹ 2, BP ⫹ 1, BP ⫹ 0, TP. We also tested a common ground (CG) configuration that consisted of a single intra-scalar active electrode and a return that comprised the remaining N intra-scalar electrodes, each carrying 1/N of the current. Our initial assumption was that the CG configuration produced a highly focal current field, similar to that of the TP configuration, but the cortical images of CG stimuli proved to be somewhat different from the images of TP stimuli. For all of the configurations, we define a channel as an active electrode plus its complement of return electrodes. The channel number corresponds to that of the active electrode; bipolar channels were numbered by the number of the more basal electrode. In accordance with the convention used for the Nucleus clinical implant, channels are numbered increasing from basal to apical. Note that, given a particular number of cochlear electrodes, the number of available channels varied with the electrode configuration. For instance, given six electrodes, six MP or CG channels were available, but only four TP channels were available because of the need for the flanking return electrodes. As described in the companion paper, neural responses were recorded with 16-channel silicon-substrate recording probes that were positioned in the active cortical layers, roughly parallel to the cortical surface. Recording sites were spaced along a single shank at 100-m intervals, roughly parallel to the cortical tonotopic axis (i.e., along the axis of changing best frequency). Based on our previous studies using acoustical stimulation (Arenberg et al. 2000), we estimate that the 16 recording sites sampled neurons with best frequencies that spanned 2–3 octaves in the upper half of the guinea pig’s audible range. The data from each animal consist of recordings from a single such placement of a 16-channel probe. Extracellular spike activity from each channel was sorted off-line to yield the multi-unit spike activity from small numbers of unresolved neurons.
Artificial-neural-network recognition of cochlear place of stimulation and current level We wished to quantify the information that is transmitted from the cochlear implant to the auditory cortex. We used a computer patternrecognition algorithm to discriminate among cochlear stimuli solely on the basis of temporal patterns of spikes recorded at 16 cortical recording sites. This is a form of “ideal-observer” analysis. In each case, recordings were limited to the 16 sites contacted by the recording probe, so one must interpret the results as a conservative estimate of the accuracy of stimulus representation by the entire auditory cortex. Nevertheless, based on our previous experiment using acoustical stimulation (Arenberg et al. 2000), we are satisfied that the recording probe provided a reasonable sample of the cortical representation of the basal turn of the cochlear, which is the cochlear turn that received electrical stimulation in the present study. In pilot studies, we compared several pattern-recognition algorithms, including maximum-likelihood discriminators, various pattern-matching schemes, and two types of artificial neural network (ANN): a nonlinear feed-forward perceptron and a competitive network trained with the learning vector quantization (LVQ) rule. Most of the algorithms produced qualitatively similar results regarding the relative amounts of information transmitted in various electrodeconfiguration conditions. We ultimately selected the competitive ANN because it effectively utilized information in a high-dimensional input space (i.e., 16 channels times 20 time bins) and because, in contrast to the feed-forward architecture used in previous studies from our laboratory (e.g., Arenberg et al. 2000; Middlebrooks et al. 1994), it proved to be more accurate in discriminating among a finite number of alternatives (i.e., 2– 6 cochlear channels or 2–21 stimulus current levels). A maximum-likelihood algorithm would have been a more conventional choice for ideal-observer analysis. Maximum likelihood was not suitable, however, for recognition of the high-dimensional input space used in the present study. The dimensionality of the input
87 • JANUARY 2002 •
www.jn.org
Downloaded from jn.physiology.org on March 8, 2011
those limitations and permitted more exhaustive study of a wide range of electrode configurations. In the present study, we evaluated quantitatively the accuracy of cortical coding of cochlear place of stimulation and stimulus current level. We adopted an ideal-observer approach in which we attempted to identify the place of stimulation or stimulus level solely by recognition of cortical images. The accuracy of stimulus identification was taken as an empirical measure of the accuracy of cortical stimulus representation. Artificial neural networks were used for cortical-image recognition. This approach was similar to previous studies from this laboratory of cortical coding of sound-source location (e.g., Furukawa et al. 2000; Middlebrooks et al. 1994, 1998) and of sound frequency (Arenberg et al. 2000), although the present study employed a network architecture that was better suited to the experimental situation. We tested monopolar, tripolar, and common ground configurations and bipolar configurations in which active and return electrodes were separated by various cochlear extents. The results demonstrated substantial differences among electrode configurations in the accuracy of signaling of place of cochlear stimulation, in the range of current levels over which place of stimulation was signaled accurately, and in the dynamic range over which current levels were signaled. Electrode configurations that permitted accurate identification of place of stimulation over a wide range of stimulus current levels tended to show relatively narrow dynamic ranges for identification of stimulus current level.
CORTICAL CODING OF COCHLEAR-IMPLANT STIMULI
Minimizing level cues to stimulus channel Cortical responses were strongly modulated by changes in both place of stimulation and stimulus current level. For that reason, there was a danger that tests of channel discrimination would be confounded by inter-channel differences in the growth of cortical responses with increasing stimulus current levels. We adopted two J Neurophysiol • VOL
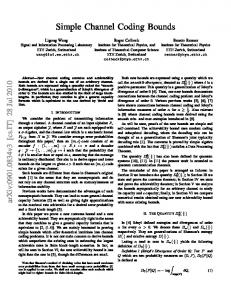
procedures to minimize that confound: roving current levels and functional level matching. The roving-current-level procedure involved varying stimulus currents randomly between trials. Except when stated otherwise, currents roved in a discrete step between a base current level and a level 1 dB higher; currents were 1 and 2, 3 and 4, 6 and 7, 9 and 10, and 12 and 13 dB above cortical thresholds. Analysis of responses to one stimulus channel at one base current level, therefore was based on responses to 80 trials, 40 at each of 2 currents. The rationale for the roving-current-level procedure was that the roving current level would invalidate level-related cues to channel identity and would force the ANN to identify features of cortical images that were predominantly dependent on place of stimulation. All analyses were repeated with a 4-dB range of current-level variation and with no variation. As expected, the accuracy of channel discrimination obtained with 4-dB current ranges was somewhat less accurate, and that obtained with a 0-dB range somewhat more accurate, than the discrimination obtained with a 2-dB range, but all the conclusions about relative differences among electrode configurations were unchanged. We note that Henry and colleagues (2000) employed a roving-current-level procedure in a psychophysical test of channel discrimination. The current levels in that study roved across as much as 60% of the dynamic range (expressed in clinical current units). The functional-level-matching procedure was intended to simulate a typical psychophysical procedure in which, prior to a channel discrimination task, stimulus levels are adjusted to currents at which listeners report equal loudness. Of course, “loudness” per se has no meaning to an anesthetized guinea pig, but we assumed that a state of equal loudness would correspond to one in which differences between cortical images were minimized. Based on that assumption, we adjusted the stimulus currents on pairs of implant channels to minimize the probability of correct discrimination by an ANN. An analogous procedure has been employed in psychophysical studies of nonspectral frequency discrimination in monkeys (Pfingst and Rai 1990; Pfingst and Rush 1987). For descriptive purposes, we refer to currents adjusted in that way as functional-level-matched current levels. For any given pair of stimulus channels, we set the current levels on both channels to a base level above the cortical threshold for each channel. Next, we varied the current level on the more apical channel in 1-dB steps from ⫺4 to ⫹4 dB relative to the base level. The discrimination index (d⬘) for channel discrimination was computed for each currentlevel offset. Figure 1 shows the result of this procedure for two electrode configurations in two animals. The case shown in Fig. 1A is typical of
FIG. 1. Matching of current levels for channel discrimination. Channeldiscrimination sensitivity was evaluated as a function of relative current levels. Current levels were expressed as relative to the threshold for each cochlear channel. The horizontal axes represent differences (“Offsets”) in those current levels. Arrows indicate the “functional-level-matched” current levels defined in the text. A and B represent examples of 2 subjects and channel pairs. BP, bipolar; CG, common ground.
87 • JANUARY 2002 •
www.jn.org
Downloaded from jn.physiology.org on March 8, 2011
could have been reduced from 320 to 16 by expressing each 20element temporal spike pattern as a 1-element spike count. Results with the ANN analysis, however, indicated that information was lost by elimination of temporal information (as in Fig. 9). Also, although maximum likelihood can be shown to be optimal for certain twoalternative discriminations (Green and Swets 1966; Neyman and Pearson 1933), we have shown previously that performance by ANNs can be superior in a multiple-alternative situation (Middlebrooks et al. 1998). Accuracy of stimulus identification was tested using the following cross-validation procedure. Each setting of stimulus parameters was repeated in 40 trials. Cortical images were separated into those recorded on 20 odd-numbered and 20 even-numbered trials. Cortical images in the odd set were used to train the ANN, and the trained network was used to classify cortical images in the even set. Then, the ANN was re-trained with the even set and used to classify the odd set. Performance measures were combined across the two training and testing procedures, yielding results for 40 tests of each stimulus setting. The inputs to the ANN were spike density functions that were formed from 16-channel responses recorded in response to individual stimulus presentations. We compared the condition in which there was no averaging of responses across trials with a condition in which we formed multiple bootstrap averages of responses across four trials (similar to Middlebrooks et al. 1998; also see Efron and Tibshirani 1991). The averaging procedure consistently resulted in more accurate stimulus identification, but results involving relative accuracy between electrode configurations were entirely consistent with the results that were obtained from individual unaveraged trials. For that reason, we present only the data from the unaveraged condition. Spike density functions were computed as follows. A spike-sorting procedure was used to identify spike times with 20-s resolution. The lists of spike times were converted to vectors of 1’s and 0’s. The spike vectors were low-pass filtered below 66 Hz by convolution with a unit Gaussian function ( ⫽ 2 ms), then the vectors were resampled with 2-ms resolution to yield 20-element vectors representing 40 ms of poststimulus time. Then the vectors from each of the 16 channels were concatenated to form a single 320-element vector. For the sake of computational efficiency, vector elements that were zero across all trials (i.e., times at which spikes never occurred) were eliminated from further analysis, so the final input to the ANN had ⬍320 dimensions, typically around 240. The ANN was implemented using the Neural Network Toolbox under MATLAB (The Mathworks, Natick, MA). Network training used the LVQ learning rule (Demuth and Beale 1998; Kohonen 1987). The network architecture consisted of a competitive layer followed by a linear layer. The competitive layer had one hidden unit and one output unit for each value of a tested stimulus parameter. That is, a network configured to classify responses to six cochlear places of stimulation had six hidden units and six outputs. Each hidden unit was specified in N dimensions, where N was the number of elements in the input vectors (N ⱕ 320). The learning rule, in essence, attempted to position each hidden unit in N-dimensional space to minimize the Cartesian distance to the input vectors that corresponded to a particular stimulus. In a six-channel condition, for example, the network would respond to each N-dimensional input vector by selecting the nearest hidden unit and reporting its number, from 1 to 6. A similar network design has been used by Nicolelis and colleagues for study of encoding of tactile information (Nicolelis et al. 1998).
495
496
J. C. MIDDLEBROOKS AND J. A. BIERER
Analysis of ANN results The ANN analysis of cortical images was configured for two tasks: discrimination and identification. In the discrimination task, an ANN was used to discriminate between cortical images of pairs of implant channels at functional-level-matched current levels or of pairs of current levels on a single implant channel. The task was analyzed as a two-alternative-force-choice task. Cortical images of two stimuli were presented an equal number of times, and the number of trials in which the network reported the correct stimulus was divided by the total number of trials to compute the probability of a correct response. That probability was converted to a discrimination index, d⬘, by converting to a standard deviate (i.e., z-score) and multiplying by the square root of 2. In instances in which the probability of correct response was 1.0, d⬘ could not be calculated. In those instances, we set d⬘ to 3.29, which corresponds to a probability of 0.99. In the identification task, an ANN was used to identify cortical images of 3– 6 implant channels at loudness-matched currents or 21 current-levels in 1-dB steps on a single channel; each stimulus value was tested an equal number of times. The network performance was analyzed in the form of a confusion matrix. The analysis was patterned after an analysis of phenome recognition by Miller and Nicely (1955). The confusion matrix counted the number of ANN reports of stimulus j in response to presentation of the cortical image of stimulus i. The accuracy of stimulus identification was expressed as the transinformation T ⫽⫺
冘 i,j
pij log2
pi ⫹ pj pij
where T is the trans-information, pi and pj are the marginal probabilities of stimulus i and ANN-response j, respectively, and pij is the joint probability of an ANN-output j in response to the cortical image of stimulus i. This can be thought of as a measure of the information about stimulus channel or current level that was obtained by classiJ Neurophysiol • VOL
fying the cortical images with the trained ANN. The total entropy, H, in each stimulus set ranged from 1.59 bits (for 3 channels) to 4.39 bits (for 21 current levels). To permit comparison across varying numbers of implant channels, we computed the relative information, which was the percentage of the entropy in the stimulus set that was eliminated by ANN recognition of cortical images (100 * T/H). Statistical comparisons of stimulus discrimination among various configurations were made using two-way ANOVA with factors of configuration and subject. RESULTS
Classification of cortical images by ANNs permitted identification and discrimination of stimulus channels and current levels with accuracy that in many cases was equivalent to performance by human cochlear-implant users. Accuracy varied substantially among various electrode configurations. We begin by presenting results from measures of channel sensitivity, with comments on the influence of stimulus level and on the topography of representation. Next, we present results from measures of current-level coding and dynamic range. Finally, we present evidence that the time structure of cortical images carries appreciable amounts of stimulus-related information. Coding of cochlear place of stimulation The number of cochlear-implant stimulus channels available for test varied from three to six, depending on the subject and the electrode configuration. Figure 2 represents the accuracy of channel identification in two cases. In each vertical column of panels, each panel represents the distribution of responses to stimulation of one channel, with channels 1 to 5 shown from top to bottom. Channel identification was quite accurate in the case shown in the left column, an example of the BP ⫹ 0 configuration. Identification of individual channels in that case ranged from 61 to 90% correct, averaging 73% correct across all channels. In that case, cortical images, as classified by the ANN, transmitted 61.6% of the information present in the stimulus set. Across all subjects, configurations, and base current levels from 1 to 12 dB above threshold, the relative transmitted information ranged from 0.6 to 66.8%, with a median of 15.5%. As shown later, channel identification often was degraded substantially at the highest current levels. Among tests of base current levels limited to 1, 3, and 6 dB, the relative transmitted information ranged from 0.7 to 66.2%, with a median of 21.5%. The right column of Fig. 2 shows an example of the MP configuration for which the relative transmitted information was 22.4%, near the latter median value. In the illustrated case, identification on individual channels ranged from 26 to 71% correct, averaging 46% correct overall. In five-channel cases like those illustrated, the chance-performance level would be 20%. Examples of discrimination between adjacent pairs of cochlear channels are shown in Fig. 3. Channel-discrimination sensitivity, expressed as d⬘, is plotted in Fig. 3A for the same two cases that are shown in Fig. 2; again, these examples are representative of the best and of the median levels of performance. Commonly, channels near the center of the cochlear array were discriminated with greatest sensitivity. In the 58 cases in which discriminations were made in three to five adjacent pairs of channels (i.e., 4 – 6 channels), 71% showed the greatest value of d⬘ for one of the central pairs. We infer
87 • JANUARY 2002 •
www.jn.org
Downloaded from jn.physiology.org on March 8, 2011
about one-half of the cases, in that the minimum value of d⬘ was obtained for a current-level offset near zero. The case shown in Fig. 1B is typical of most of the remaining cases, in which d⬘ decreased monotonically for increasing current levels on the more apical channel. This form of current-level sensitivity can be explained by inspection of cortical images as illustrated in the companion paper (Bierer and Middlebrooks 2002). In that study, cortical images of basal channels often were wider than those of more apical channels, so increases in the current level on a more apical channel tended to widen the image of that channel, causing it to resemble more closely the image of the more basal channel. In all cases, we selected a current offset that minimized d⬘ according to the following procedure. First, we found all the current offsets in the range of ⫺4 to ⫹4 dB that produced discrimination within 0.5 d⬘ units of the minimum d⬘ value. Then, from those offsets, we selected the offset that was closest to 0. Across all animals, configurations, base levels, and pairs of channels, 8.7% of selected offsets were ⫺4 to ⫺1 dB, 63.9% were 0 dB, and 27.4% were 1– 4 dB. In cases in which we tested identification of three to six stimulus channels, we started with a center channel and worked step-wise toward the apical and basal ends of the channel array to minimize pair-wise differences in d⬘ between adjacent channels. The set of currents found in that way was then used for the test of multi-channel identification. Because this functional-level-matching procedure intentionally minimized pair-wise channel discrimination, our estimates of the accuracy of cortical signaling of channel identity probably are underestimated. When all measures of channel identification were repeated without the functional level matching, the accuracy of channel identification was increased, often dramatically so. Nevertheless, similar conclusions about relative differences among various electrode configurations were obtained with or without the functional level matching.
CORTICAL CODING OF COCHLEAR-IMPLANT STIMULI
that discrimination sensitivity was lower near the ends of the cochlear array largely because of the tendency of the corresponding cortical images to extend off the end of the cortical recording array. In Fig. 3B, the data from Fig. 3A are expressed as cumulative d⬘. The horizontal axis plots the distance along the cochlear electrode array measured relative to the most basal electrode. The slope of the best-fitting line was taken as a measure of sensitivity. Such sensitivities, expressed as d⬘ per cochlear millimeter, could be compared across cases in which differing numbers of channels were tested; that computation of sensitivity was patterned after one described in a psychophysical study by Nelson and colleagues (1995). By that measure, perfect discrimination of channels spaced at 0.75 mm predicted a sensitivity of 4.39 d⬘ units/mm (i.e., 3.29 d⬘ units/0.75 mm), and chance performance predicted a slope near 0. The slopes of the two cases in Fig. 3B were 2.18 and 0.89 d⬘/mm. The sensitivity for channel discrimination varied systematically among animals, electrode configurations, and base stimulus currents. Figure 4 summarizes that measure for all cases. Each panel represents one experimental subject, clusters of bars represent electrode configurations, and individual bars in each cluster represent base stimulus currents of 1, 3, 6, and 9 J Neurophysiol • VOL
dB relative to threshold. The number of channel pairs that contributed to each computation of sensitivity varied among configurations, from three to five pairs for MP and CG to one pair for BP ⫹ 3. General trends related to configurations and currents were similar across subjects. Variation among subjects in absolute levels of sensitivity most likely can be attributed largely to variation in placement of the cochlear implants and in placement of the cortical recording electrode. Across all subjects, the channel-discrimination sensitivity increased from MP, to the various bipolar configurations, to TP. The MP configuration consistently showed the lowest sensitivity (MP vs. TP: P ⬍ 0.01 at all levels; MP vs. BP ⫹ 0: P ⬍ 0.025 at base current levels of 1 and 3 dB; MP vs. BP ⫹ 0: P ⬍ 0.05 at base levels of 6 and 9 dB). The BP ⫹ N and TP configurations showed no significant difference at a base current level of 1 dB above threshold, but the sensitivity for the TP configuration was greater that than of the BP ⫹ 0 configuration at 3 and 6 dB (P ⬍ 0.01) and at 9 dB (P ⬍ 0.001). In some subjects (data not shown), there was some indication that sensitivity improved as the extent of a BP pair was reduced from BP ⫹ 2 to BP ⫹ 0, particularly at higher current levels, but that was not seen consistently. Bipolar configurations with large extents were difficult to evaluate in this experiment since, for example, only two BP ⫹ 3 channels could be implemented on a six-electrode cochlear implant. The CG configuration produced a generally high sensitivity, although the performance in that configuration seemed to show more variability across subjects than did some of the other configurations. Sensitivity in the CG configuration was not significantly different from that in the TP configuration. A conspicuous difference among the electrode configurations was in the ability to signal cochlear place at high current levels. All of the configurations showed some degradation in channel-discrimination accuracy as levels increased. That decrease was relatively small for the TP configuration: sensitivity decreased by an average of only 16% as the current level was increased from 3 to 9 dB. In contrast, performance by the other configurations dropped precipitously at the highest currents. For the BP ⫹ 0 configuration, for instance, sensitivity decreased by an average of 78% as the base current level was
FIG. 3. Pair-wise discrimination of channels. A: 2 examples of subjects, configurations, and current levels are represented by different symbols. The position of each point represents the sensitivity for discrimination of the indicated channel number from the adjacent, more apical channel. Current levels were matched for loudness as described in the METHODS. B: the same data are plotted as cumulative sensitivity.
87 • JANUARY 2002 •
www.jn.org
Downloaded from jn.physiology.org on March 8, 2011
FIG. 2. Identification of activated channels. Each column of 5 plots represents the accuracy of identification of cortical images of 5 stimulus channels in 1 subject, configuration, and stimulus level, as indicated. Each panel represents the distribution of reported channel numbers based on cortical images of one stimulated channel. MP, monopolar.
497
498
J. C. MIDDLEBROOKS AND J. A. BIERER
increased from 3 to 9 dB. Again, the CG configuration was highly variable among subjects, in some cases showing essentially no difference across current levels and in other cases showing a large drop in sensitivity at the highest level. Based on the known tonotopic organization of the auditory cortex, one would expect cochlear place of stimulation to map topographically onto the cortical tonotopic axis. Such a topography was confirmed in the companion paper for most configurations (Bierer and Middlebrooks 2002), although the topography was comparatively weak for the MP configuration and was sometimes nonmonotonic for the CG configuration. A monotonic topography leads to the expectation that increases in the distance between a pair of cochlear channels would lead to improved pair-wise channel discrimination (i.e., increased d⬘). We tested that hypothesis for MP, BP ⫹ 0, TP, and CG configurations. Figure 5 plots d⬘ for pair-wise discrimination of channels separated by varying cochlear distances. Vertical pairs of panels represent the four subjects in which five or six working electrodes were available, with the top and bottom rows of panels showing results for current levels 3 and 6 dB above threshold, respectively. Each data point represents the mean of d⬘ for all pair-wise discriminations for the stated subject, configuration, and channel separation; each mean is based on discriminations of one to five channel pairs. The J Neurophysiol • VOL
sensitivity for MP, BP ⫹ 0, and TP configurations generally increased with increasing channel separation. In some cases, one can see a nearly constant increase in d⬘ for each 0.75-mm increment in separation, although that increase was blocked by the ceiling of d⬘ ⫽ 3.29. In contrast, the sensitivity for the CG configuration tended to decline for the largest channel separations. The reduced sensitivity for discrimination of the most apical from the most basal channels in the CG configuration might reflect the tendency shown in the companion paper of cortical images of basal channels in CG configuration to resemble those of apical channels. Coding of stimulus current level The companion study demonstrated that cortical images tend to increase in extent and latencies tend to shorten as stimulus currents were increased. We tested the accuracy with which cortical images signaled stimulus current level. Figure 6 shows two examples of confusion matrices for current-level identification. Current levels were varied in 1-dB steps and are expressed in decibels relative to the cortical threshold, which was the minimum current level at which any of the units recorded at a given probe position showed stimulus-locked responses. The area of each circle represents the percentage of trials in
87 • JANUARY 2002 •
www.jn.org
Downloaded from jn.physiology.org on March 8, 2011
FIG. 4. Sensitivity for various electrode configurations and base current levels. Each panel represents 1 subject. Missing bars indicate conditions that were not tested in particular subjects.
CORTICAL CODING OF COCHLEAR-IMPLANT STIMULI
499
FIG. 5. Channel-discrimination sensitivity at various channel separations. Each column of 2 panels represents 1 subject; each row represents 1 of 2 current levels. Various electrode configurations are indicated by symbols. Channel separation indicates the centerto-center cochlear distance between the active electrodes of each pair of channels. Each point is the average of all channel pairs that were tested in each configuration in each animal; the number included in each average varied as indicated in the text. TP, tripolar.
We wished to compare among electrode configurations the dynamic ranges for current discrimination. For that reason, we defined the dynamic range for each case of subject, configuration, and channel as the range of currents over which the difference limen for current discrimination was ⱕ2 dB. Practically, that corresponded to the range over which the d⬘ for discrimination of a 2-dB current increment was ⱖ1. The horizontal lines in Fig. 7, A and B, show the d⬘ ⫽ 1 criterion. That measure demonstrated a wider dynamic range for the case in Fig. 7A than for the case in Fig. 7B, confirming the impression of these cases from the confusion matrices in Fig. 6. The influence of electrode configuration on the dynamic ranges for current-level coding is demonstrated in Fig. 8. In these box plots, each box and associated symbols represents the distribution of values for one electrode configuration across all subjects and channels. The number of values for each configuration varied: there were 5 values for BP ⫹ 3 and 12–25 for each of the other configurations. Figure 8A shows the distributions of widths of dynamic ranges in decibels. Among MP and the various BP ⫹ N configurations, there was a general trend for dynamic ranges to increase among electrode configurations in the order MP, BP ⫹ 3, BP ⫹ 2, BP ⫹ 1, BP ⫹ 0, i.e., from the most diffuse to the most focal electrode configuration. Pair-wise comparisons of dynamic ranges of specific channels indicate that dynamic ranges were significantly wider for the BP ⫹ 0 configuration compared with the MP or other
FIG. 6. Identification of current levels. A and B represent 2 examples of subjects, configurations, and channels, as indicated. Each vertical column of circles represents the distribution of levels reported in response to presentation of cortical images of a particular current level. The areas of circles represent the percentages of reports.
J Neurophysiol • VOL
87 • JANUARY 2002 •
www.jn.org
Downloaded from jn.physiology.org on March 8, 2011
which a particular current level was reported out of all the trials in which the cortical image of a particular level was presented. The case shown in Fig. 6A accurately signaled currents from 0 to 6 dB relative to threshold. Across that range, identification of particular currents ranged in accuracy from 27.7 to 72.5% correct (mean ⫽ 46.4%), and most incorrect judgements fell within 1–2 dB of the correct value. Accuracy of current-level identification deteriorated at currents more than 7 dB above threshold, presumably as the responses on most recorded cortical neurons reached saturation. In the case shown in Fig. 6B, the dynamic range of accurate identification of current levels was considerably narrower, with accurate identification only of currents between 0 and 2 dB above threshold. Figure 7 shows examples of pair-wise discrimination of currents from the same two cases that are represented in Fig. 6. In Fig. 7, A and B, the plus signs and filled circles show d⬘ for discriminations of 1-dB increments in current. The currentlevel axis represents the lower of the two currents that were discriminated in each case; that is, the d⬘ at ⫺1 dB was relatively high because a below-threshold current (⫺1 dB) was discriminated reliably from a threshold current (0 dB). The open symbols in Fig. 7, A and B, show d⬘ for discrimination of 2-dB increments. They show the expected result that discrimination improved when the current increment was increased. Figure 7, C and D, show the data for 1-dB increments in the form of cumulative d⬘.
500
J. C. MIDDLEBROOKS AND J. A. BIERER
BP ⫹ N configurations (P ⬍ 0.001 to 0.025). In some subjects, one could see a trend toward wider dynamic ranges across BP ⫹ 3, 2, and 1 configurations, but that trend was not consistent across all subjects. The BP ⫹ 2 and BP ⫹ 1 configurations produced significantly wider dynamic ranges than the MP configuration (P ⬍ 0.01); the small number of tested BP ⫹ 3 channels precluded a meaningful comparison of MP and BP ⫹ 3. The dynamic ranges in the CG configurations were quite variable, with a distribution that overlapped the distribution of both MP and BP ⫹ 0 dynamic ranges. There was an exception to the tendency of focal electrode configurations to show wide dynamic ranges: the TP configu-
FIG. 8. Distributions of dynamic-range widths and cumulative level sensitivities. Each box with symbols represents the distribution across all subjects and channels for one electrode configuration. Horizontal lines show the 5th, 25th, 50th, 75th, and 95th percentiles, and plus signs represent outlying data. Only 5 cases were available for the BP ⫹ 3 configuration, so the individual data are shown with plus signs. Other configurations had 12–26 cases. A: dynamic-range width in dB. B: dynamic-range width in units of current (A). Five of 24 BP ⫹ 0 points and 1 of 26 CG points fell above 300 A and were cropped from the plot. C: maximum cumulative sensitivity (cumulative d⬘ across the entire dynamic range) based on discrimination of 1-dB increments of current level.
J Neurophysiol • VOL
87 • JANUARY 2002 •
www.jn.org
Downloaded from jn.physiology.org on March 8, 2011
FIG. 7. Pair-wise discrimination of levels. A and B: sensitivity to 1-dB (⫹ and ●) or 2-dB ({ and 䊐) increments in current level for 2 subjects, configurations, and channels, as indicated. The dashed line indicates d⬘ ⫽ 1, which was the criterion used with the 2-dB level increment to define dynamic range. C and D: data from A and B, respectively, plotted as cumulative sensitivity.
ration produced dynamic ranges that were lower than those in any other configurations (P ⬍ 0.001 to 0.005). That observation was surprising because the companion paper showed that cortical sites tend to show a broader range of thresholds for TP stimuli than for stimuli in other configurations. For that reason, one might have expected that increasing current levels in the TP configuration would recruit active cortical neurons over a wider dynamic range. A possible explanation for the relatively narrow dynamic range of the TP configuration is that the thresholds reported in the companion paper were based on responses averaged over 40 stimulus presentations, whereas the present analysis was based on responses to single presentations. It might be that responses at near-threshold levels near the fringe of the cortical image were too irregular to contribute to accurate judgments of stimulus levels. We tested that hypothesis by averaging across trials to reduce trial-by-trial variability. We generated bootstrapped spike patterns from multiple averages of 10 patterns, drawn randomly without replacement from the pools of odd- or even-number spike patterns (Efron and Tibshirani 1991). The tests of ANN discrimination of current levels were repeated using the bootstrapped spike patterns as input, and dynamic ranges were computed. In the averaged condition, the mean BP ⫹ 0 dynamic range increased by 1.6 dB, but the mean TP dynamic range increased by 5.3 dB. In the averaged condition, the distribution of TP dynamic ranges was not significantly different from the distribution of BP ⫹ 0 dynamic ranges (P ⬎ 0.1). The use of a logarithmic (i.e., dB) scale to report dynamic ranges introduces a confound between dynamic range and threshold. A range of a given number of microamperes above a high-threshold appears as a narrower decibel range than if it is positioned on top of a lower threshold. The companion study shows that thresholds tend to increase with decreasing spatial extent of the electrical field, i.e., from MP, through BP ⫹ 3, 2, and 1, to BP ⫹ 0 (Bierer and Middlebrooks 2002). Shannon and colleagues (Chatterjee 1999; Zeng and Shannon 1992) have argued that it is more appropriate to express stimulus levels for electrical hearing in current units than in decibels. Figure 8B shows dynamic range widths expressed in units of microamperes. As expected, the trend of broadening dynamic range from MP through to BP ⫹ 0 was exaggerated by a microampere representation of dynamic ranges. Conversely, the TP configuration typically showed the highest threshold, so TP dynamic ranges were broadened relative to the decibel
CORTICAL CODING OF COCHLEAR-IMPLANT STIMULI
Contribution of cortical spike timing to stimulus coding The companion paper demonstrates that cortical images of cochlear-implant stimuli exhibit substantial stimulus-dependent changes in their time structure. For instance, some cortical images showed rather constant first-spike latencies across the region of activated cortex. In other cortical images, latencies were minimal within the central region of activity, and latencies increased with increasing cortical distance from the center. In many instances, first-spike latencies correlated highly with spike rates, so that latencies did not carry stimulus-related information that was not available from spike counts. In other instances, however, the correlation was lower, and there was a possibility that first-spike latencies might contribute to stimulus coding. Also, stimulus-related information might be carried by aspects of the temporal structure of spike patterns other than the first-spike latency, such as by interspike intervals. We compared the cortical coding of place of stimulation and current level under three conditions. The first, “full spike pattern,” condition was the same as that shown in all previous sections; all spike-rate and spike-timing structure was intact. In the second, “time-shuffled,” condition, temporal information in spike patterns was disrupted. In that condition, the distribution of spike times from each recording site was compiled across all stimulus conditions, then spike patterns were reconstructed by replacing each spike time with one drawn randomly without replacement from the distribution of all spike times. That procedure had the effect of preserving spike rates and the first-order distribution of spike times while eliminating any J Neurophysiol • VOL
specific stimulus-related timing. In the third, “spike-rate” condition, all temporal information was eliminated by representing the response at each cortical site by the spike rate. The input to the ANN in that condition consisted of vectors of the spike rate at each of 16 recording sites. Figure 9 shows the sensitivity (d⬘) for pair-wise channel discrimination in the full-spike-pattern condition compared with the time-shuffled condition. In some cases, discrimination sensitivity was roughly equal in the two conditions, but a substantial majority of cases showed reduced sensitivity in the time-shuffled condition; those cases are represented by data points lying beneath the diagonal line in Fig. 9. Across all cases of channel discrimination, d⬘ averaged 0.25 units lower in the time-shuffled condition (P ⬍ 0.001). That difference was somewhat compressed by the many cases in which discrimination sensitivity was low under both conditions. In the 47% of cases in which d⬘ was ⱖ1 in one or both conditions, the difference was 0.33 d⬘ units (P ⬍ 0.001). A similar reduction in sensitivity was observed for the spike-rate condition relative to the full-spike-pattern condition; sensitivity averaged 0.23 d⬘ units lower across all cases and 0.33 units lower in cases in which one or both values of d⬘ were ⱖ1. Disruption of temporal information in spike patterns had a somewhat smaller effect on discrimination of current levels than on channel discrimination. The current-level sensitivity was reduced by only 0.13 d⬘ units in the time-shuffled condition. DISCUSSION
We have used an ANN algorithm to recognize spatiotemporal patterns of cortical activity (“cortical images”) and thereby to identify cochlear electrical stimuli. In effect, we quantified the stimulus-related information that an ideal observer could obtain by observing neural firing patterns at 16 sites in the auditory cortex. The results confirm the hypothesis that various cochlear electrode configurations differ in the accuracy with which they signal to the cortex the place and level of cochlear stimulation. The present analysis was designed with the goal of facilitating comparison of the physiological results with published human psychophysical results. In this discussion, we begin by considering some of the factors that bear on the
FIG. 9. Discrimination of channels by full spike patterns (abscissa) and time-shuffled patterns (ordinate). The symbols represent every subject, configuration, level, and channel separation.
87 • JANUARY 2002 •
www.jn.org
Downloaded from jn.physiology.org on March 8, 2011
representation. Expressed in microamperes, the dynamic ranges of TP channels are roughly equivalent in width to those of BP ⫹ 1, 2, and 3 configurations, although TP dynamic ranges still were narrower than those of BP ⫹ 0 configurations. An alternate way to represent the range of accurate currentlevel representation is to consider the cumulative sensitivity for discrimination of adjacent current increments (as in Fig. 7, C and D). The maximum cumulative d⬘ across the entire dynamic range may be regarded as an estimate of the number of discriminable steps across the dynamic range of a channel. Figure 8C shows the distributions of maximum cumulative-currentlevel sensitivity for various electrode configurations. In general, the influence of configuration on cumulative d⬘ was similar to the influence on dynamic range expressed in decibels. Among the BP ⫹ N and TP configurations, there was an inverse relationship between the width of dynamic ranges for current-level coding and the range of levels over which place of stimulation was signaled accurately; this can be seen by comparing Figs. 4 and 8. Generally, the TP configuration showed the narrowest dynamic range, yet TP was the configuration that showed the most accurate channel discrimination at high currents. Conversely, the BP ⫹ 0 configuration showed the widest dynamic range for current discrimination yet showed severe degradation in channel discrimination at higher stimulus currents. In the case of the TP configuration, the three highest currents that were used in tests of channel discrimination (6, 9, and 12 dB re threshold) were above the current-level dynamic range of most channels. That is, accurate channel discrimination was possible under conditions in which the cortical sensitivity to changes in stimulus current level was saturated.
501
502
J. C. MIDDLEBROOKS AND J. A. BIERER
validity of such comparisons. Then we relate our results on current-level and channel identification to corresponding human psychophysical results. Finally, we consider the implications of our physiological results for the design of speech processors for cochlear prostheses. Validity of comparison to human psychophysics
J Neurophysiol • VOL
Level discrimination and dynamic ranges In the companion study (Bierer and Middlebrooks 2002), we defined the dynamic ranges of single neurons as the range of current levels over which neurons increased their normalized firing rates from 25 to 75% of their maximum rates. Dynamic ranges at the most sensitive cortical recording sites tended to be narrow, only around 1–2 dB. Wider dynamic ranges were measured at cortical sites away from the most sensitive sites, especially for BP ⫹ N and TP configurations. Thresholds also varied according to cortical location relative to the most sensitive site. For those reasons, estimates of current levels based on responses at multiple cortical sites would necessarily show wider dynamic ranges than the 1- to 2-dB ranges measured for the most sensitive units. In the present study, we measured the accuracy with which current levels could be signaled by the entire ensemble of neurons recorded by 16-channel probes, including the most sensitive sites as well as more remote sites. Patterns of cortical activity signaled cochlear electrical current levels with considerable accuracy. In many cases, the difference limens for detection of changes in current level were ⬍1 dB, as indicated by d⬘ ⱖ 1 for a current increment of 1 dB. We
87 • JANUARY 2002 •
www.jn.org
Downloaded from jn.physiology.org on March 8, 2011
Our operating premise was that a listener’s auditory perceptual experience is limited by the information that is available to his or her auditory cortex. We assumed that pairs of stimuli that elicit very different patterns of cortical activity are more easily discriminated in a perceptual task than pairs of stimuli that elicit indistinguishable cortical patterns. There are numerous factors that would limit detailed comparison of the absolute accuracy of stimulus discrimination or identification between the present physiological results and human perceptual results. Obvious examples of such factors include the difference in species and the presence or absence of anesthesia. Also, absolute levels of accuracy in the physiological study were influenced by the number of cortical sites that were studied, typically 16, and the range of the cortical frequency representation that was sampled, typically the representation of the highest 2–3 octaves of the guinea pig’s auditory range. The number of recorded sites was determined by the design of our recording probe. In preliminary tests, we simulated recording from more neurons by averaging responses across multiple trials. Given enough averages, absolute levels of stimulus discrimination could be elevated to nearly perfect performance across many or all stimulus conditions. This observation illustrates the lack of validity of absolute measures of performance. Nevertheless, it is encouraging that the performance based only on the responses of neurons at 16 cortical sites on individual trials tended to span the range of performance that is seen in human studies. That indicates that our performance measures are likely to be sensitive to stimulus parameters similar to those that influence human perception. We are more confident about conclusions that we can draw from relative measures of performance among electrode configurations. Pilot studies indicated that such comparisons are robust to experimental details such as number of recorded cortical sites or to the use of averaging procedures. We assume that relative measures, for the most part, are robust to interspecies differences. The present physiological results regarding comparisons among electrode configurations are validated to some extent by the few human psychophysical studies that have compared electrode configurations; generally, our physiological results in guinea pig agree with published psychophysical results, which are discussed in later sections. Another experimental difference between our study and most psychophysical studies is that our stimuli were single electrical pulses, whereas most psychophysical studies of channel or current identification have employed short bursts of pulses. In preliminary studies, we have obtained similar results from single pulses and short bursts of pulses in regard to several aspects of stimulus coding, but that issue needs further attention in future studies. A potentially significant limitation in the comparison of our results to results from human listeners relates to the status of the auditory nerve. In humans, deafness results from a wide variety of etiologies, and patients show a wide variety of
histories in regard to duration of deafness and implantation. As a result, patients show great variability in the status of survival of auditory nerve fibers. In contrast, all our guinea pigs were deafened by intra-scalar application of an ototoxic drug, and all were implanted and studies completed within 16 h of deafening. For that reason, we infer that the status of the auditory nerves in our study was more uniform and that the proportion of surviving fibers was higher than in most human patients. The more-uniform status of auditory nerves in our study might account for the generally lower levels of inter-subject variability that we observed compared with human psychophysical studies. For instance, channel-discrimination sensitivity in the BP ⫹ 1 configuration at 1 dB above threshold ranged only from 1.16 to 2.99 d⬘/mm in our six guinea pig subjects (at the 1-dB current level). In contrast, a comparable measure ranged from 0.12 to 3.16 d⬘/mm among 12 human subjects in the psychophysical study by Nelson and colleagues (1995). The status of auditory nerves might influence conclusions regarding comparisons among electrode configurations. In our study, the most focal electrical fields provided the most accurate signaling of cochlear implant channel. Highly focal configurations might be less suitable for patients who show relatively sparse nerve survival. Future studies are needed to address the impact of auditory-nerve status on responses to various electrode configurations. A further caveat in comparison of our results to results from human listeners relates to the possibility of CNS reorganization consequent to long-term deafness with or without cochlearimplant stimulation. Studies in cats have demonstrated that the auditory cortex maintains at least a rudimentary representation of the cochlea during long-term deafness (Hartmann et al. 1997; Raggio and Schreiner 1999). Nevertheless, other results in the cat have identified deafness- or stimulation-induced changes in the cochlear representation in the auditory cortex (Raggio and Schreiner 1999) and inferior colliculus (Snyder et al. 1990). Similar reorganization might be present in human patients, whereas no such reorganization was likely in our acutely deafened guinea pigs.
CORTICAL CODING OF COCHLEAR-IMPLANT STIMULI
J Neurophysiol • VOL
average of BP ⫹ 0 through BP ⫹ 3, 3.5 dB for TP, and 6.0 for CG. Busby and colleagues (1994) compared in human patients pseudo-monopolar, bipolar (BP ⫹ 1 or 2), and common ground configurations. Dynamic ranges varied considerably among electrodes in each subject and among subjects but averaged 5.4 dB for monopolar, 6.1 dB for bipolar, and 7.6 dB for common ground. The ranking in that study of dynamic ranges for monopolar and bipolar configurations agreed with our results, but the dynamic range for common ground ranked higher than in our results. Pfingst and colleagues (1997) tested BP ⫹ 0 and BP ⫹ 6 configurations and obtained mean dynamic ranges of 4.2 and 5.0 dB, respectively. That ranking is opposite to the modest decrease in dynamic ranges that we observed with increasing bipolar extent. Chatterjee (1999) explored the influence of spatial extent of bipolar stimulation on the growth of loudness associated with increasing current level. In that study, listeners reported loudness on a scale from 1 to 100, in which 1 indicated just detectable and 100 indicated too loud. The loudness estimates were fit closely by an exponential function of current in microamperes, with the exponent containing a multiplier that depended on the cochlear extent from the active to the return electrode. We estimated dynamic ranges from the Chatterjee study by taking scores of 99 and 2 as the upper and lower ends of the dynamic range and computing the corresponding current levels. The dynamic ranges expressed in microamperes increased with decreasing cochlear extent, but the exponential nature of the current-to-loudness function implied that dynamic ranges expressed in decibels are independent of cochlear extent. That conclusion agreed with the present physiological results that the dynamic ranges expressed in decibels showed little or no consistent change in dynamic range across BP ⫹ 1 to BP ⫹ 3 configurations. Dynamic ranges for the BP ⫹ 0 configuration in our study, however, were significantly wider than for BP ⫹ 1, 2, or 3. Chatterjee did not report results for the BP ⫹ 0 configuration (M ⫽ 1 in her terminology), so a question remains as to whether or not the most restricted bipolar configuration provides a particularly wide dynamic range. Nelson and colleagues (1996) examined difference limens for current discrimination as a function of current level. They estimated the number of discriminable steps of current across a listener’s entire dynamic range. The estimates varied widely, from 6.6 to 45.2 steps, depending on the listener. Electrode configurations all were BP ⫹ 0 or BP ⫹ 1 in that study. In the present study, the d⬘ for discrimination of a 1-dB current increment typically ranged from about 0.5 to 2, and d⬘ increased roughly linearly across ranges of currents increments that gave d⬘ in that range. If we define the difference limen as that current increment that produces d⬘ ⫽ 1, then the sum of d⬘ across the dynamic range (the maximum cumulative d⬘) is an estimate of the number of discriminable steps. Across all subjects and channels in the present study, all the BP ⫹ N configurations exhibited roughly the same maximum cumulative sensitivity (around 6 –9 d⬘ units), whereas that measure was reduced to about 81% of the mean of those values for the MP configuration. The TP configuration displayed a considerably lower maximum cumulative sensitivity, only 55% of the mean value exhibited by the BP ⫹ N configurations.
87 • JANUARY 2002 •
www.jn.org
Downloaded from jn.physiology.org on March 8, 2011
defined the dynamic range for each stimulation channel in each electrode configuration as the range of levels over which the difference limen for detection of changes in electrical current was ⱕ2 dB. The dynamic ranges varied among electrode configurations. Averaged across all subjects, dynamic ranges for MP and BP ⫹ N configurations tended to increase with decreasing extent of cochlear electrical field, showing the widest dynamic range for the BP ⫹ 0 configuration. In the companion study, we noted that cortical thresholds for cochlear stimulation in the TP configuration tended to range widely across the 16 cortical recording sites in each animal. If dynamic ranges were based on the activity of all cortical neurons, then those wide ranges of thresholds would predict wide dynamic ranges for TP stimuli. Contrary to that prediction, TP configurations consistently showed the narrowest dynamic ranges as computed in the present study. One possible explanation for that contrary result is that neurons remote from the centroid of cortical activity might have fired with high trial-by-trial variability so that they did not contribute to the network identification of current level. We tested a condition in which trial-by-trial variability in responses was reduced by averaging across sets of 10 trials. Current-level discrimination improved in that condition, and dynamic ranges in the TP configuration increased. Presumably an awake animal makes sensory judgments based on the activity of many more than 16 cortical neurons. One possibility is that the coordinated activity of many neurons improves the accuracy of level judgments and the width of dynamic ranges in the TP configuration relative to other configurations. Alternatively, the relative differences in sizes of activated populations between TP and other configurations might persist and result in differences in dynamic ranges. In human psychophysical studies, dynamic range usually is defined as the range of currents from the lowest detectable current to the current that produces the maximum comfortable (or maximum acceptable) loudness (e.g., McKay et al. 1999; Nelson et al. 1996). In the present study, dynamic ranges represented the range of currents over which changes in current resulted in changes in cortical images. At this time, we can only speculate on the correspondence between dynamic ranges measured with perceptual and physiological techniques. In human psychophysical studies, sensitivity to changes in current levels remains constant or even improves at the upper end of the dynamic range (Chatterjee 1999; Nelson et al. 1996). That implies that maximum comfortable loudness corresponds to a current that lies within the physiological dynamic range. For that reason, the upper ends of our physiological dynamic ranges probably are higher than the guinea pig equivalent of comfortable loudness, implying that the dynamic ranges in the present study tend to be fairly broad estimates of perceptual dynamic ranges. We do not know, however, whether the currents at the upper ends of the physiological dynamic ranges are close to or are well above the currents corresponding to maximum comfortable loudness levels. There have been few reports that compared human psychophysical dynamic ranges across various electrode configurations, but those reports suggest that the differences among configurations are somewhat smaller than the differences that we observed in physiological dynamic ranges. In our study, dynamic ranges averaged 4.6 dB for MP, 6.7 dB for the
503
504
J. C. MIDDLEBROOKS AND J. A. BIERER
Channel discrimination and identification
J Neurophysiol • VOL
Common-ground configuration and cortical topography In the CG electrode configuration, there is a single active electrode and a return path formed by all the other intra-scalar electrodes. That configuration is regarded as a highly focal configuration that can be implemented on Nucleus electrode arrays (from Cochlear) using the implanted receiver stimulators (Busby et al. 1994; Henry et al. 2000). The TP configuration, in contrast, has only recently become available on any of the devices that use transcutaneous radio-frequency links. In the present study, the accuracy of channel discrimination for the CG configuration tended to show more inter-subject vari-
87 • JANUARY 2002 •
www.jn.org
Downloaded from jn.physiology.org on March 8, 2011
Information about the spectral content of sounds is transmitted to cochlear-prosthesis users primarily by activation of particular channels in the cochlear electrode array. In the animal model in the present study, the accuracy with which cortical activity represented the identity of active cochlear channels depended strongly on the cochlear electrode configuration. Generally, the accuracy of channel identification and discrimination ranked inversely with the size of presumed cochlear electrical fields; i.e., accuracy improved in the rank MP, BP, and TP. That result corresponds to the observation in the companion study that progressively more focal cochlear electrical fields result in progressively more focal cortical images. In conditions in which the spread of cortical activity was more restricted, the activity of individual cortical neurons tended to be more strongly modulated by the place of cochlear stimulation, and thus the activity of each neuron signaled more effectively the identity of the active channel. In most cases, the cochlear images of BP ⫹ 0 and TP stimuli were largely encompassed by the 16 sites of our 1.5-mm-long recording array, whereas the images of MP stimuli often extended to (and presumably beyond) the edge of the recording array. For that reason, it is possible that the accuracy of cortical representation of MP stimuli was underestimated. That is, recognition of MP channels might have been more accurate had we surveyed a more widespread cortical area. Our recording arrays typically spanned the cortical representation of 2 to 3 octaves of the audible range. In the absence of relevant perceptual data, we have no basis for determining the extent of the cortical area to which a listener attends for the purpose of identifying an active cochlear electrode. Given the dimensions of the recording array, however, neurons beyond the sampled cortical area would have had characteristic frequencies more than about an octave beyond the characteristic frequency at the stimulated cochlear site. Studies of human cochlear-implant users have tested electrode discrimination (Henry et al. 2000; McKay et al. 1999; Pfingst et al. 1999; Zwolan et al. 1997), place-pitch ranking (Collins et al. 1997; Donaldson and Nelson 2000; Nelson et al. 1995; Townshend et al. 1987), and channel identification (Busby et al. 1994; Collins et al. 1997; Tong and Clark 1985). As in the present animal study, performance in those human studies varied widely among subjects and among electrodes, from near-chance to near-perfect discrimination of adjacent channels. Only a few human psychophysical studies have tested the influence of electrode configuration on channel discrimination or identification. In the early study by Tong and Clark (1985), listeners identified members of sets of seven channels. Two subjects were tested with bipolar pairs that differed in spatial extent: BP ⫹ 1 and BP ⫹ 4 in one subject and BP ⫹ 2 and BP ⫹ 4 in the other. In each case, there was negligible difference in channel identification between the pair of spatial extents. Similarly, in the present study we observed little difference in channel sensitivity among BP ⫹ 0, 1, 2, and 3 configurations. In the pitch-ranking study by Townshend and colleagues (1987), a tripolar configuration was compared in one case with a monopolar configuration. The sensitivity for pair-wise discriminations along seven channels was approximately double in the tripolar configuration compared with the monopolar. The present cortical results consistently showed
superior performance in the TP configuration, with sensitivity always more than a factor of 2 greater than sensitivity in the MP configuration. In the study by Henry and colleagues (2000), individual subjects used either BP or CG stimuli. Although configurations were never compared within a single subject, the 3 CG subjects consistently showed better channel discrimination than did the 12 BP subjects. In the present study, discrimination in the CG configuration was better than the BP ⫹ 0 configuration only at a high current level (9 dB above threshold). The greatest differences between BP ⫹ N and TP configurations appeared at relatively high current levels. Discrimination of BP ⫹ N channels was markedly degraded at current levels 6 dB above threshold and higher. The dynamic ranges for current discrimination in bipolar configurations averaged as high as 7.3 dB (for BP ⫹ 0). That range of currents coincides partially with the range of currents over which channel discrimination was degraded. In contrast, discrimination of TP channels was essentially unchanged across levels from 1 to 12 dB above threshold. The dynamic range for current discrimination in the TP configuration averaged only 3.5 dB. If we assume that the upper end of the physiological current-discrimination range is at or beyond a listener’s maximum comfortable loudness, accurate channel discrimination at higher current levels is of questionable value. Regardless, it appears that the TP configuration permitted accurate channel discrimination across all usable current levels, whereas the BP configuration showed loss of accuracy over much of what appears to be the usable dynamic range. Two studies have examined the influence of current level on channel discrimination using a bipolar configuration (McKay et al. 1999; Pfingst et al. 1999). Both found that increases in current levels resulted in a weak increase in discrimination performance. That is counter to the present study in which increases in current level across a range of several decibels resulted in prominent decreases in discrimination for all but the TP configuration. Again, there is uncertainty here about the sound levels that we tested relative to the perceptual comfort level. In the published psychophysical studies, best performance by most subjects was obtained at the highest tested levels: 100% (McKay et al. 1999) or 75% (Pfingst et al. 1999) of the current level that corresponded to maximum comfortable loudness. Our tests at 6 and 9 dB above threshold might have been at a considerably higher effective level. If we restrict attention to our measurements at 1 and 3 dB above threshold, a 2-dB increase in current produced no significant change in performance except in the MP configuration, in which performance declined somewhat (P ⬍ 0.05).
CORTICAL CODING OF COCHLEAR-IMPLANT STIMULI
Implications for speech processors The results from the present animal model provide insight into electrical stimulus characteristics that might improve psychophysical sensitivity to stimulus current and cochlear place of stimulation. We now can look to the speech-perception literature to evaluate the importance of current and channel sensitivity for speech recognition. One approach to testing the importance of channel (i.e., place-of-stimulation) sensitivity has been to measure channel-discrimination sensitivity and speech-recognition performance and to compute the correlation across subjects. Results have been somewhat mixed. Little or no significant correlation has been found in studies that used the MPEAK speech-processing strategy for tests of speech recognition (Donaldson and Nelson 2000; Nelson et al. 1995; Zwolan et al. 1997). The MPEAK strategy used in those studies, however, provided relatively low-resolution spectral information. In contrast, studies with the SPEAK processing strategy, which provides spectral-peak information over more channels (Skinner et al. 1994), have demonstrated significantly better speech recognition in listeners who show better channel discrimination sensitivity. Donaldson and Nelson (2000) found that, among experienced SPEAK users, superior channel sensitivity correlated significantly with superior speech-recognition performance. Henry and colleagues (2000) also found a J Neurophysiol • VOL
strong correlation between channel discrimination sensitivity and speech recognition using the SPEAK strategy, but only when they tested channel discrimination in a condition in which current levels varied randomly between trials. That suggests that a listener’s ability to identify channels at uncertain current levels is important for effective speech recognition. An analogous roving-current procedure was used in the present study in evaluation of channel discrimination. Further evidence for the importance of accurate channel discrimination is provided by a study by Zwolan and colleagues (1997), who tested listeners’ channel sensitivity and identified channels that subjects could not discriminate. Speech recognition improved when those listeners’ speech processors were reprogrammed to avoid activation of indiscriminable channels. Studies of the importance of current-level sensitivity for speech recognition have produced varied results that depend on the speech-processing strategy that was used. In one study, Zeng and Galvin (1999) reprogrammed speech processors so that they delivered only two current levels (essentially “on” or “off”) to each channel. Listeners showed little degradation in speech recognition in quiet, although performance suffered in the presence of background noise. Those results suggest that amplitude sensitivity is of little importance for speech recognition, although listeners in that study used the SPEAK strategy, which provides fairly detailed spectral information in the form of cochlear place of stimulation. Loizou and colleagues (2000) obtained different results using the continuously interleaved stimulation strategy (CIS) (Wilson et al. 1991), which uses fewer cochlear channels than SPEAK and places more importance on the amplitude of the envelope of the speech waveform. In that study, speech recognition improved as the number of current levels was increased up to an asymptote of eight levels. That study was conducted in quiet conditions; presumably a larger number of amplitude steps would be beneficial in noisier conditions. In a simulation of the CIS strategy with normal-hearing listeners, Loizou and colleagues (2000) demonstrated a trade-off in speech recognition between the number of frequency bands and the number of amplitude levels. That is, an increase in frequency-band count could compensate for a decrease in the number of amplitude steps, and vice versa. The present physiological results suggest that the choice of the optimal cochlear electrode configuration might depend on the characteristics of the speech-processing strategy that is to be used. The present-day SPEAK and ACE strategies, for instance, can exploit a relatively high channel count and emphasize detailed cochlear-place signaling (e.g., Skinner et al. 1994). Our results suggest that the TP configuration might be best suited for such strategies. We note that the CG configuration has been employed as means of obtaining a highly focal current field (like that of TP) and that instances of high levels of speech recognition have been reported using the CG configuration with the SPEAK strategy (Henry et al. 2000). We also note, however, that our results with the CG configuration show irregularities in the cortical topography and considerable inter-subject variability in regard to channel discrimination and dynamic range. Moreover, psychophysical studies have demonstrated substantial pitch reversals in the CG configuration (Busby et al. 1994). For those reasons, we regard the CG configuration as a poor substitute for TP. The CIS strategy, in contrast, employs a fixed, relatively small, number of channels
87 • JANUARY 2002 •
www.jn.org
Downloaded from jn.physiology.org on March 8, 2011
ability than did the other configurations, but in most cases the accuracy was quite high. The topography of cortical representation of the CG configuration, however, was somewhat irregular. As demonstrated in Fig. 5, the MP, BP ⫹ 0, and TP configurations tended to show monotonically increasing discrimination sensitivity as the channel separation increased. Those trends were consistent with a monotonic, essentially one-dimensional cortical representation of cochlear place. Consistent with that interpretation, the companion paper demonstrated that the spike-rate-weighted centers of masses (the “centroids”) of cortical images tended to shift systematically in cortical place according to changing cochlear channel number. In the CG configuration in the present study, increases in the separation between channels resulted in nonmonotonic changes in discrimination sensitivity, such that in some cases channels that were more than four channels apart were discriminated less accurately than were adjacent channels. Similarly, cortical centroids of CG channels measured in the companion study showed a nonmonotonic map of CG channel onto cortical place. The irregular channel discrimination in CG configuration observed in the present study parallels an observation from the human psychophysical literature. In the study by Busby and colleagues (1994), listeners often demonstrated a major reversal in pitch estimates in the progression of CG channels along the cochlear array. Those authors speculated that the pitch reversal could have resulted from high impedance in the current path for the active electrode compared with a lower impedance for more distant electrodes. In the present study, because of the geometry of the stimulating array relative to the guinea pig cochlea, the most apical electrodes probably were situated closer to the cochlear modiolus than were more basal electrodes. For that reason, the apical return electrodes of a nominally basal CG stimulus might have elicited a cortical image resembling that of a more apical active channel.
505
506
J. C. MIDDLEBROOKS AND J. A. BIERER
and relies on comparatively detailed transmission of currentlevel information (Wilson et al. 1991). A narrow dynamic range for current-level discrimination would be a liability for such a strategy. The TP configuration exhibited the narrowest dynamic ranges in the present study, so that configuration might be poorly suited for a strategy that relied on detailed signaling of current levels. By that logic, our present results would favor a bipolar configuration for the CIS strategy. Concluding remarks
We thank Z. Onsan for help with illustrations and production of the manuscript and S. Furukawa, E. Macpherson, B. Pfingst, and C. Stecker for thoughtful comments on the manuscript. Multichannel recording probes were graciously provided by the University of Michigan Center for Neural Communication Technology, which is supported by National Center for Research Resources Grant P41-RR-09754. This research was supported by National Institute on Deafness and Other Communication Disorders Grants RO1 DC-04312 and T32 DC-00011.
REFERENCES ARENBERG JG, FURUKAWA S, AND MIDDLEBROOKS JC. Auditory cortical images of tones and noise bands. JARO 1: 183–194, 2000. BIERER JA AND MIDDLEBROOKS JC. Auditory cortical images of cochlearimplant stimuli: dependence on electrode configuration. J Neurophysiol 87: 478 – 492, 2002. BUSBY PA, WHITFORD LA, BLAMEY PJ, RICHARDSON LM, AND CLARK GM. Pitch perception for different modes of stimulation using the cochlear multiple-electrode prosthesis. J Acoust Soc Am 95: 2658 –2669, 1994. CHATTERJEE M. Effects of stimulation mode on threshold and loudness growth in multielectrode cochlear implants. J Acoust Soc Am 105: 850 – 860, 1999. COLLINS LM AND THROCKMORTON CS. Investigating perceptual features of electrode stimulation via multidimentional scaling paradigm. J Acoust Soc Am 108: 2353–2365, 2000. COLLINS LM, ZWOLAN TA, AND WAKEFIELD GH. Comparison of electrode discrimination, pitch ranking, and pitch scaling data in postlingually deafened adult cochlear implant subjects. J Acoust Soc Am 101: 440 – 455, 1997. J Neurophysiol • VOL
87 • JANUARY 2002 •
www.jn.org
Downloaded from jn.physiology.org on March 8, 2011
This study set out to test two hypotheses. The first was that, compared with diffuse configurations, focal electrical configurations permit more accurate cortical representation of place of cochlear stimulation. That hypothesis was confirmed by quantitative results that TP and BP ⫹ N configurations permit more accurate channel recognition than does the MP configuration and that the TP configuration permits accurate channel recognition over a wider range of current levels than does the BP ⫹ N configuration. The second hypothesis was that focal configurations exhibit a wider dynamic range of discriminable current levels than do diffuse configurations. That hypothesis was confirmed in part by the result that BP ⫹ N configurations show wider dynamic ranges than does the MP configuration. The hypothesis was partially refuted, however, by the observation that the most focal tested configuration, TP, showed the narrowest dynamic ranges. The results from our animal model are largely consistent with the few human psychophysical studies that have compared responses to multiple electrode configurations in individual subjects. We hope that the present results will serve to focus the design of future psychophysical studies in animals and humans. We intend to proceed with application of this animal model to further studies of cortical responses to single cochlear-implant channels and of interactions among multiple channels.
DEMUTH H AND BEALE M. Neural Network Toolbox for Use With MATLAB. Natick, MA: The Mathworks, 1998. DONALDSON GS AND NELSON DA. Place-pitch sensitivity and its relation to consonant recognition by cochlear implant listeners using the MPEAK and SPEAK speech processing strategies. J Acoust Soc Am 107: 1645–1658, 2000. EFRON B AND TIBSHIRANI R. Statistical data analysis in the computer age. Science 253: 390 –395, 1991. FURUKAWA S, XU L, AND MIDDLEBROOKS JC. Coding of sound-source location by ensembles of cortical neurons. J Neurosci 20: 1216 –1228, 2000. GREEN DM AND SWETTS JA. Signal Detection Theory and Psychophysics. New York: Wiley, 1966. HARTMANN R, SHEPHERD RK, HEID S, AND KLINKE R. Response of the primary auditory cortex to electrical stimulation of the auditory nerve in the congenitally deaf white cat. Hear Res 112: 115–133, 1997. HENRY BA, MCKAY C, MCDERMOTT HG, AND CLARK GM. The relationship between speech perception and electrode discrimination in cochlear implantees. J Acoust Soc Am 108: 1269 –1280, 2000. KOHONEN T. Self-Organization and Associative Memory (2nd ed.). Berlin: Springer-Verlag, 1987. KRAL A, HARTMANN R, MORTAZAVI D, AND KLINKE R. Spatial resolution of cochlear implants: the electrical field and excitation of auditory afferents. Hear Res 121: 11–28, 1998. LOIZOU PC, DORMAN M, POROY O, AND SPAHR T. Speech recognition by normal-hearing and cochlear implant listeners as a function of intensity resolution. J Acoust Soc Am 108: 2377–2387, 2000. MCKAY CM, O’BRIAN A, AND JAMES CJ. Effect of current level on electrode discrimination in electrical stimulation. Hear Res 136: 159 – 164, 1999. MIDDLEBROOKS JC, CLOCK AE, XU L, AND GREEN DM. A panoramic code for sound location by cortical neurons. Science 264: 842– 844, 1994. MIDDLEBROOKS JC, XU L, CLOCK EDDINS A, AND GREEN DM. Codes for sound-source location in nontonotopic auditory cortex. J Neurophysiol 80: 863– 881, 1998. MILLER GA AND NICELY PE. An analysis of perceptual confusions among some English consonants. J Acoust Soc Am 27: 338 –352, 1955. NELSON DA, SCHMITZ JL, DONALDSON GS, AND VIEMEISTER NF. Intensity discrimination as a function of stimulus level with electric stimulation. J Acoust Soc Am 100: 2393–2414, 1996. NELSON DA, VAN TASSELL DJ, SCHRODER AC, AND SOLI S. Electrode ranking of “place pitch” and speech recognition in electrical hearing. J Acoust Soc Am 98: 1987–1999, 1995. NEYMAN J AND PEARSON ES. On the problem of the most efficient test of statistical hypotheses (Abstract). Philos Trans R Soc Lond A Math Physiol Sci 231: 289, 1933. NICOLELIS MAL, GHAZANFAR AA, STAMBAUGH CR, OLIVEIRA LMO, LAUBACH M, CHAPIN JK, NELSON RJ, AND KAAS JH. Simultaneous encoding of tactile information by three primate cortical areas. Nature Neurosci 1: 621– 630, 1998. PFINGST BE, HOLLOWAY LA, ZWOLAN TA, AND COLLINS LM. Effects of stimulus level on electrode-place discrimination in human subjects with cochlear implants. Hear Res 134: 105–115, 1999. PFINGST BE AND RAI DT. Effects of level on nonspectral frequency difference limens for electrical and acoustic stimuli. Hear Res 50: 43–56, 1990. PFINGST BE AND RUSH NL. Discrimination of simultaneous frequency and level changes in electrical stimuli. Ann Oto Rhinol Laryngol 96: 34 –37, 1987. PFINGST BE, ZWOLAN TA, AND HOLLOWAY LA. Effects of stimulus configuration on psychophysical operating levels and on speech recognition with cochlear implants. Hear Res 112: 247–260, 1997. RAGGIO MW AND SCHREINER CE. Neuronal responses in cat primary auditory cortex to electrical cochlear stimulation. I. Activation patterns in short- and long-term deafness. J Neurophysiol 82: 3506 –3526, 1999. SKINNER MW, CLARK GM, WHITFORD LA, SELIGMAN PM, STALLER SJ, SHIPP DB, SHALLOP JK, EVERINGHAM C, MENAPACE CM, ARNDT PL, ANTOGENELLI T, BRIMACOMBE JA, PIJL S, DANIELS P, GEORGE CR, MCDERMOTT JH, AND BEITER AL. Evaluation of a new spectral peak coding strategy for the Nucleus 22 channel cochlear implant system. Am J Otol 15, Suppl 2: 15–27, 1994. SNYDER RL, REBSCHER SJ, CAO K, LEAKE PA, AND KELLY K. Chronic intracochlear electrical stimulation in the neonatally deafened cat. I. Expansion of central representation. Hear Res 50: 7–34, 1990.
CORTICAL CODING OF COCHLEAR-IMPLANT STIMULI SPELMAN FA, PFINGST BE, CLOPTON BM, JOLLY CN, AND RODENHISER KL. The effects of electrical current configuration on potential fields in the electrically stimulated cochlea: field models and measurements. Ann Oto Rhinol Laryngol (St. Louis) Suppl 166: 131–136, 1995. TONG YC AND CLARK GM. Absolute identification of electric pulse rates and electrode positions by cochlear implant patients. J Acoust Soc Am 77: 1881–1888, 1985. TOWNSHEND B, COTTER N, VAN COMPERNOLLE D, AND WHITE RL. Pitch perception by cochlear implant subjects. J Acoust Soc Am 82: 106 –115, 1987.
507
WILSON BS, FINLEY CC, LAWSON DT, WOLFORD RD, EDDINGTON DK, AND RABINOWITZ WM. Better speech recognition with cochlear implants. Nature 352: 236 –238, 1991. ZENG F-G AND GALVIN JJ III. Amplitude mapping and phoneme recognition in cochlear implant listeners. Ear Hear 20: 60 –74, 1999. ZENG F-G AND SHANNON RV. Loudness balance between electric and acoustic stimulation. Hear Res 60: 231–235, 1992. ZWOLAN T, COLLINS L, AND WAKEFIELD G. Electrode discrimination and speech recognition in postlingually deafened adult cochlear implant subjects. J Acoust Soc Am 102: 3673–3685, 1997.
Downloaded from jn.physiology.org on March 8, 2011
J Neurophysiol • VOL
87 • JANUARY 2002 •
www.jn.org