the conclusion, that computer scientists take more interest in scientific data landscapes ... metadata such as theme categories (classes), title, abstract, subject.
Veslava Osinska Nicolaus Copernicus University, Torun, Poland Joanna Dreszer-Drogorob Nicolaus Copernicus University, Torun, Poland Grzegorz Osinski College of Social and Medial Culture, Torun, Poland Michal Gawarkiewicz Nicolaus Copernicus University, Torun, Poland
Cognitive Approach in Classification Visualization: end-users study Abstract: Visualization of scientific information extends the possibility to explore how the science is organized and does change over the time. Particularly classified data include a great potential of discovering the structure and dynamics of specified domain. The authors applied tested and previously presented conception of ACM CCS (Computing Classification System) classification mapping into a sphere surface. Classified documents form pattern according to their semantic similarity. Two main goals of obtained visualizations were determined. It could be mainly used as multiperspective analytical tool of original classification and its structure. Classification sphere also might be considered as an ergonomic interface for exploring scientific resources as well as information retrieval. Obtained graphical representations deliver quantitative material for analysis of classification development and dynamics. The authors try to find reliable tools to evaluate it. They constructed an appropriate interface and surveyed the distinct groups of users, who were asked about key aspects of visualization layout and their changes. Results of our study allow to evaluate visualization of classification thereby to improve proposed methodology as well as to discover a new semantic features and laws in visual layout. Keywords: visualization interface; Infoviz; mapping; classification scheme; ACM Computing Classification System.
1. Introduction Information Visualization is one of the stages in data analysis process and delivers research material in a graphical form. Data correlations and hidden structure can be discovered using visualization layouts with more or less complex distribution of nodes. High perceptible attributes like colour, size and location describe the main properties of data. Is interpretation of such graphical pattern always coherent and correct? In any case, the author(s) take main part in interpretation, and therefore, the final conclusion involves subjective aspects. The question “Do you see the same as me?” relates to the problem of evaluation in visual analysis. Computer scientists narrow down the evaluation of visualization to comparison of layouts created by means of different metrics and/or mapping algorithms (Boyack, 2005; Börner, 2010). However, this approach does not resolve the problem of subjective interpretation because,
2 again, the end-analyst is a person who knows the main research problem and may conduct his or her own scheme of assessment (Szelag et al, 2010). Meteorological maps are claimed to be designed for a large group of recipients. Usually cognitive mechanisms are implemented there, thus represented data are easily understandable for all users. Examples of science maps (Exhibit Purpose and Goals 2007) are helpful in stydying pattern recognition by human. Authors observation of the participants of Places@Spaces exhibition leads to the conclusion, that computer scientists take more interest in scientific data landscapes than Humanities and Social Sciences specialists. Probably it caused by habituation of visual communication among information technology practicians (Carretié et all, 2003). Birger Hjørland underlined the role of user-based study to Knowledge Organization (2013). Cognitive approach has a long tradition (since 1970s) in library and information science study (Birger 2013). In the past two decades user-centered tendency became influential in broader society branches, for example: technologies, businesses organizations, market and education. According to Birger Hjørland Knowledge Organization, research must include subjective aspects, and therefore is based on “collective views in discourse communities” (Birger 2013). This paper is a continuation of the study on visualization interface of classified articles using a new topology. Obtained visualizations of computer science classification and related classified articles are described from different epistemological perspectives in a series of papers (Osinska, Bala 2010; Osinska 2010). The authors discern two main practical applications of this novel approach. The first one is a visual analysis of classification which consists of scheme evolution and dynamics study as well as their consequent improvement. The second potential concerns documents navigation space and semantic retrieval. Because of specialization of the interface, the authors focus on the first issue i.e. visual analysis of classification and its reliable evaluation. In the case of classification visualization where a high level of abstraction is involved, interpretation of graphical distribution of classes is extremely difficult. The authors have decided to include different groups of users in the interpretation process. 2. Model of Classification Visualization The main problem in the graphical presentation is a low dimension topology accessible in a standard computer monitor. Multidimensional data structure is displayed on a plane, however the human perception systems are naturally adapted for spherical vision (Ware, 2004). The target visualization space to be chosen is the sphere surface because of its good ergonomic properties. Theoretical basis of dimension reduction of large-scale data was proposed by Thurston (1997). The analysis method applied by the author tries to exploit the human perception and cognition mechanisms through 3D computer graphics
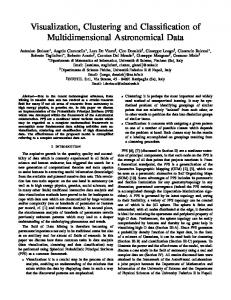
3 and interactive interface. This combination leads to natural and efficient human-computer interaction. Such property of sphere surface as homeomorphism preserves cohesion in terms of topology. Similar topological space is used in visualization like Large Map of Science (Klavans & Boyack, 206) and Circos application dedicated to comparative genomics (Krzywinski, 2009). Currently, it is a standard visualization model for considerable data sets. In the presented study, a well-known cognitive problem of Cartesians coordinates was eliminated by using nonlinear metrics (Osinska & Bala, 2010). Datasets constituted documents classified by Computing Classification System and derived from Association for Computing Machinery Digital Library. The metadata such as theme categories (classes), title, abstract, subject descriptors and keywords were used. An original conception was based on similarity of co-classes and the assumption: similarity degree is proportional to the number of common publications (Osinska & Bala, 2010). The final number of all classes and subclasses in collection determined the dimension of coclasses similarity matrix. To place the nodes of classes and documents on sphere surface, the multidimensional scaling technique was applied. Documents nodes formed a pattern according to their thematic similarity. The nodes were indicated by a proper colour of main class they belonged to (Figure 1). The authors investigated similar and distinct research fields as well as clusters organization by means of obtained graphical patterns. They also analyzed the dynamics of classification due to data series for different publishing periods with a 10-year step. The results show that visualization of classified documents reveals both organization of digital library content and allows to identify hierarchical thematic categories.
Figure 1: Visualization sphere – screenshot of interface for on-line classification exploration (Application is accessible online:
4 http://www-users.mat.umk.pl/~garfi/vis2009v3).
3. Methodology
3.1. Application Figure 1 demonstrates the screenshot of the application interface. The user is able to rotate the sphere, select different combinations of main classes and thus analyze the graphical distribution of documents nodes. The application is accessible online in two language versions: Polish and English. For the interface design, popular Web technologies such as Hyper Text Markup Language with Cascading Style Sheets and JavaScript are used. This ensures compatibility with all web browsers, but it is recommended to access the interface using up-to-date versions of modern web browsers like Mozilla Firefox or Google Chrome. Rendering of 3D task is provided by “Canvas K3D library”.
3.2. Survey research Seventeen volunteers were divided into three groups (two students groups – participants ranging in age from 19 to 26 years, and one experts group), distinguished according to subjects’ computer usage experience. The first group included seven undergraduate university students who had been recruited from different humanistic or social sciences departments. The second group consisted of seven undergraduate university students of Mathematics and Computer Science. All participants from both students groups had been recruited via a word-of mouth or an announcement at Nicolaus Copernicus University in Torun (Poland) whereby extra course credits were offered as well as feedback about their performance on the study tasks. The last group consisted of three experts from Computer Science Faculty at the same University. Subjects from all three groups were tested individually. They were asked about key aspects of visualization layout using a questionnaire. The survey research was oriented towards substantial assessment of interpretation of graphical representations by both individuals and groups. To reach uniformity of output quantitative data, series of closed-ended questions were constructed. Thematic categories labeled with letters A-K predefined an exhaustive set of responses. Multiple-choice questions indicated the labels (categories/classes). The authors added simple instructions at the beginning of the questionnaire form to get respondents-amateurs acquainted with the topic. The ten questions concerned four crucial characteristics of graphical distribution of documents nodes related to the three-dimensional layout: (1) dynamics of changes, (2) clustering degree, (3) closeness and (4) semantic correlation between two contemporary infrastructure logistics, i.e. “cloud computing” and “grid computing”. The dynamics was analyzed through seeking the most changeable patterns across three different years of publishing. First quaternary questions were concerned to the dynamical or permanent
5 distribution. If a category was highly dynamical, it couldn’t be selected again for the question about the non-changeable pattern. The next question: “Find overlapping/separate categories by seeking the most/least colours mixing between groups?” - was related to significant clustering and even distribution which are mutually exclusive. Some categories of documents indicated by different colours were located close to each other; some of them were more distant. The proper question was formulated: “What the categories are the most distant from each other?”. Semantic distribution could be discovered by tracking graphical pattern of articles by selected topic across a years. Cloud computing, the most popular technology today, has evolved from networks (sub)classes. Three last questions were designed to prove that dependence. The final item in the questionnaire included all ideas and comments about the implementation of interface.
4. Results Evaluation of research based on comparison the true answers defined by experts and respondents answers. Only the experts may properly comprehend and interpret classification system evolution. Accuracy was defined as a simple percentage quotient of correct to all answers. A wide choice of response items (11 main categories plus negative option) in each question has determined the survey results to a large extent. It was observed that respondents in each group displayed two different cognitive styles during exploration of graphical patterns. The first one related immediate reply and the second was characterized by longer time to select questionnaire answering sequences. In the last case, the choice was more reasonable. Those distinct analysis approaches caused discrepancy in the results and complicated the estimation process. Final accuracy varies in the range from 50% to 86% and strongly depends on the nature of a question. Given response sequences were compared with the ones accepted by the experts. The lowest accuracy is observed in two cases related to clustering and overlapping of thematic categories. Finding clusters was problematic as the respondents wrongly understood the concept and the formulation of the question was unclear. That can be the reason of comparatively low accuracy in relative responses. Semantic overlapping is possible to be revealed through tracking the intensity of colour mixing. According to suggestions of the experts, some colours combination create difficulties in complex patterns perception. That problem concerns orange (H._Information Systems Organization) and aqua (I._Computer Methodologies) nodes distribution. The best accuracy has been obtained for the following issues: dynamics characteristics, even distribution as well as monitoring the cloud computing patterns. It was noted that Computer Science and Humanities students exposed different behaviour during interface analysis. Humanities students
6 focused on the practical application (information retrieval, Web browsers, digitalization, library resources cataloguing) and knowledge domains (Library and Information Science, computer science, robotics, education) of presented visualization while computer science students were more interested in the working principle of application and ignored appearing technical weaknesses of interface like large delay time or lack of grid sphere.
5. Discussion and Conclusion Obtained visualization maps might be used for methodological study of original classification, its development, structure, dynamics as well as efficiency regarding users. Classified documents form a complex pattern according to their thematic similarity. The main assumption is that output graphical pattern corresponds to the semantic structure of classification using relevant topological space (sphere surface in current paper). Professionals who are competent in both computer science and science of science issues are able to comprehend output visualization maps and finally interpret them in the most rational manner. The experts play such a role in the proposed experiment. Users-amateurs are involved simultaneously in the process of visual reading. The main objective is based on comparison of users-nonprofessionals perception of maps with experts’ insight. The results could provide a basis for quantitative evaluation of classification visualization approach. Accuracy of responses does not fall below 50%. The best accuracy (86%) relates to both dynamics and cloud/grid computing distribution analysis. Clustering and overlapping of (sub)classes observations deal with great discrepancy (lowest accuracy). Suitable questions are biased by insufficient understanding and perception mechanism, for instance, scattered nodes of isolated category were perceived as cluster. Besides, distance estimation (proximity task) on sphere surface is problematic due to lack of texture, coordinates and reference point (something like Greenwich). Experts have also noticed the difficulty with colours differentiation on a black background. Except those weaknesses, visualization interface is positively assessed by users. Interaction and spherical configuration provides the convenient exploration. By rotating a sphere, it is possible to see a graphical pattern created by all categories and simultaneously to investigate the distribution of nodes locally. That technique is widely used in Infoviz and it is called focus+context (Osinska 2010, Young 1996). This pilot study was a first step to answer the question how to prove that visualization method and interface. Distinct groups of users had to investigate classification visualization using interactive interface. They demonstrate distinct cognitive styles according to their individual cognitive processes. The authors plan to extend experiment with a large users group (more that one hundred).
7 Parallely all experts observations and suggestions must be taken into consideration. Improvement of survey and interface includes: -
better clarification of formulation of such concepts like clustering, overlapping, closeness; consideration of distinct cognitive styles of users; sphere rendering including grid, coordinates and reference points; textured sphere surface; better perceptible colours combination;
Proposed visualization method which provides a nonlinear exploration space can be very useful for librarians, classifiers, information specialists and all scientists from interdisciplinary research fields.
References Borner, K. (2010). Atlas of Science, MA: MIT Press. Börner, K. (2010) Extracting and Visualizing Semantic Structure in Retrieval Results for Browsing. In: Proceedings of the fifth ACM conference on Digital Libraries, NY, USA:ACM, 2010. Available at: ftp://ftp.cse.buffalo.edu/users/azhang/disc/disc01/cd1/out/papers/dl/p234-borner.pdf Boyack, K W. et al. (2005). Mapping the backbone of science. Scientometrics. Vol. 64, no. 3, pp. 351-374. Available at: http://scimaps.org/exhibit/docs/05-boyack.pdf Birger, H. (2013). User-based and Cognitive Approaches to Knowledge Organization: A Theoretical Analysis of the Research Literature. Knowledge Organization. 40(1). Carretié, L. et al. (2003). Cerebral patterns of attentional habituation to emotional visual stimuli. Psychophysiology, 40, pp. 381-338. Klavans, R.; Boyack, K. (2006). Quantitative Evaluation of Large Maps of Science. Scientometrics 68 (3): pp. 475-499, 2006. Available at: http://www.researchgate.net/publication/220365101_Quantitative_evaluation_of_large_ maps_of_science/file/d912f50757fca9ec7a.pdf Krzywinski, M. et al. (2009). Circos: an information aesthetic for comparative genomics. Genome Research, 19(9). Available at: http://genome.cshlp.org/content/early/2009/06/15/gr.092759.109.full.pdf+html Osinska, V. (2010). Visual Analysis of Classification Scheme. Knowledge Organization, 37(4). Osinska, V.; Bala, P. (2010). New Methods for Visualization and Improvement of Classification Schemes – the case of computer science. Knowledge Organization, 37(3). Exhibit Purpose and Goals [online] (2007- ). Places@Spaces: Mapping Science. Available at: http://www.scimaps.org/.
8
Szelag, E.; Dreszer, J.; Lewandowska, M.; Medygral, J.; Osinski, G.; Szymaszek, A. (2010). Time and Cognition from the Aging Brain Perspective: Individual Differences. Personality from biological, cognitive and social perspectives. Eliot Werner Publications INC, 2010, pp. 331-364. Thurston, W. (1997). Three-dimensional geometry and Mathematical Series, Vol.1, 35. Princeton University Press, NJ.
topology.
Princeton
Ware, C. (2004) Information Visualization: Perception for Design. Morgan Kaufmann, pp. 11, 188, 273. Young, P. (1996). Three Dimensional Information. [online]. Department of Computer Science. Available at: http://vrg.dur.ac.uk/misc/PeterYoung/pages/work/documents/litsurvey/IV-Survey/.
About authors Veslava Osinska is an assistant professor at the Institute of Information Science and Book Studies, Nicolaus Copernicus University in Torun where she teaches information architecture, information visualization, ICT and computer graphics. She has a degree in physics and holds a PhD in library and information science. Her research interest is in modern information and knowledge domain visualization with particular interest in applications of nonlinear properties to information organization and streaming. Veslava is also a member of the Polish Chapter of International Society of Knowledge Organization and the Polish Computer Science Society Joanna Dreszer-Drogorob holds a PhD in psychology. She is an assistant in the Multimedia Lab at the Fine Arts Department at the Nicolaus Copernicus University in Torun where she also teaches cognitive psychology. Her research interests are in developmental aspects in time perception, neural basis of human cognition, intelligence, cognitive abilities. She is also interested in the dynamics in social psychology, such as dynamics in attitudes, feeling, and self-esteem. Grzegorz Osinski is a computer scientist, neuroscientist and physicist. His current research is in nonlinear dynamics systems in biomedical sciences where he applies numerical methods and computer simulations for modeling behaviours of neural correlates in different dynamical states. His other interests are in cognitive aspects of neural activity in perception and communication. processes. Michal Gawarkiewicz holds a degree in computer science from the Nicolaus Copernicus University in Torun. His master’s thesis was on semantic memories in narrow domain using machine-readable information. His current PhD studies are on database optimizations. Michal also teaches programming classes and works in the area of data processing and mobile technologies.