Collaboration Rules Please note that to reduce file size, some non-essential but graphics-intensive elements have been deleted These materials are based in part on “Collaboration Rules’ by Philip Evans and Bob Wolf Harvard Business Review July-August 2005 pp 96-104. (This article can be downloaded at http://custom.hbsp.com/b01/en/implicit/p.jhtml?login=EVAN082905&pid=R0507H ) Other content is pre-publication. Therefore please do not redistribute or cite these materials
Copyright © The Boston Consulting Group 2006 All rights reserved
Please direct any comments or enquiries to the author:
[email protected] 617 973-1286
Philip Evans The Boston Consulting Group
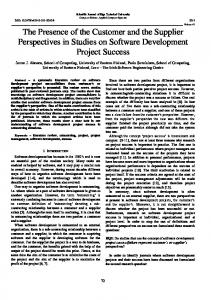
Source: US Department of Defense satellite photographs
Intensity of midnight illumination
Low
Copyright © The Boston Consulting Group 2006 All rights reserved
High
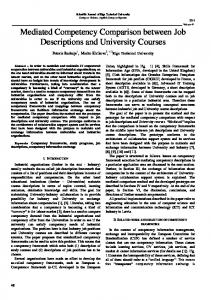
Bio-Tech Alliances 1988 1998 1995 1991 Links: R&D collaborations Financial links Joint commercialization Cross-licensing
Nodes: Pharmaceutical corporations Dedicated bio-tech firms Venture capital firms Universities, research institutes Government institutes
Source: W.W. Powell, D.R. White, K.W. Koput & J. Owen-Smith: ‘Evolution of a Science-Based Industry: Dynamic Analysis and Network Visualization of Biotechnology’ http://www.fek.umu.se./dpcc/powell.pdf Copyright © The Boston Consulting Group 2006 All rights reserved
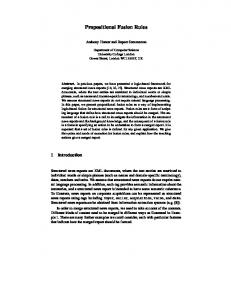
A Global Sales Organization
HQ Staff Finance Marketing Sales Technical General Manager Source: BCG Analysis of client network Copyright © The Boston Consulting Group 2006 All rights reserved
A Global Sales Organization
...without Headquarters
Finance Marketing Sales Technical General Manager Source: BCG Analysis of client network Copyright © The Boston Consulting Group 2006 All rights reserved
A Global Sales Organization
...without Headquarters ...without domestic links
Finance Marketing Sales Technical General Manager Source: BCG Analysis of client network Copyright © The Boston Consulting Group 2006 All rights reserved
The Physical Internet
Source: Lumeta Corporation http://www.lumeta.com/graphics/wired.gif Copyright © The Boston Consulting Group 2005 2006 All rights reserved
Self-Organization of the Physical Internet Degree-Frequency Distribution Frequency Probability of a router having the given number of direct connections
100 10-1 10-2 10-3
10-4 10-5 10-6 100
101
102
Degree Number of direct router connections Sample of 150,000 router interfaces and 200,000 adjacencies. Source: Govindan & Tangmunarunkit, Proceedings of the IEEE INFOCOM 2000 Vol 3 Copyright © The Boston Consulting Group 2006 All rights reserved
103
The Linux Kernel Programming Community
Source: BCG analysis of the Linux Kernal Mailing Listserv http://www.ussq.iu.edu.hypermail/linux/kernet/ Copyright © The Boston Consulting Group 2006 All rights reserved
‘Self-Organization’ in the Linux Community
Degree-Frequency Distribution
Degree-Clustering Distribution 1
1 Probability that a programmer has the given number of 0.1 collaborative links or more
Average Clustering coefficient
Predicted by a Random Network Actual
Predicted by a Random Network Actual
0.1
0.01
p 0.01
0.001 1
10 100 Degree: Number of Collaborative Links
1000
1
10
100
Degree: Number of Collaborative Links
The ‘clustering coefficient’ of a node i is the probability that any two nodes connected to i, are connected to each other Source: BCG Analysis of the Linux Kernel collaboration patterns Copyright © The Boston Consulting Group 2006 All rights reserved
1000
Denso Denso
Normal supply flow
Toyota
Emergency teaming
Toyota
Dispatch of parts, blueprints, workers Aisin
Aisin
Logistical coordination Emergency supply flow
Units
Kyoritsu Sangyo
16,000 14,000 12,000 10,000 8,000 6,000 4,000 2,000
Fri
Sat
02/01/97
Network map is schematic Sources: Asahi Shinbun, Aisin Seiki:
Sat Sun
02/01/97
Mon
Tues
Wed Wed
04/02/97 02/02/97
Sun 02/10/97
(Procedural Guide for the Emergency Resumption of Production)
Copyright © The Boston Consulting Group 2006 All rights reserved
Pagers Externally: A4 Reports Common Open licensing e-Mail, listservs e.g. Sourceforge, Slashdot Rich work ‘semantic’ Blogs discipline Swapping patent portfolios Wikis e.g. Wikipedia Licenses: GPL, Creative Commons Collaborative trust filtering e.g. eBay, Amazon Leakage viaand labor and capital markets TheftCertification: e.g. Verisign Broadcast, Trust Social software e.g. Friendster, LinkedIn ‘granular’ Internally: communication Multiplayer online game environments, e.g. Second Life Team-based rewards XML / Web services / Semantic Web Low transaction Rf ID costs
Copyright © The Boston Consulting Group 2006 All rights reserved
Pagers Externally: A4 Reports Common Open licensing e-Mail, listservs e.g. Sourceforge, Slashdot Rich work ‘semantic’ Blogs discipline Swapping patent portfolios Wikis e.g. Wikipedia Licenses: GPL, Creative Commons
Scalable Low Collaborative trust and filtering e.g. eBay, Amazon Leakage via labor and capital transaction markets self-organizing TheftCertification: e.g. Verisign costs networks Broadcast, Trust
Social software e.g. Friendster, LinkedIn ‘granular’ Internally: communication Multiplayer online game environments, e.g. Second Life Team-based rewards XML / Web services / Semantic Web Low transaction Rf ID costs
Copyright © The Boston Consulting Group 2006 All rights reserved
Procurement productivity (Inverse of transaction costs) (Dollar volume ($M) of parts purchased per person in procurement)
14 Toyota 12
10
Nissan
8
6 DaimlerChrysler Ford
4
2 GM
1
2
3
4
5
6
7
Automaker Trustworthiness (Mean score on 3 metrics of trust*) *Trust metrics: vendor ratings surveyed on a 7-point Likert scale: • Extent to which the supplier trusts the OEM to treat the supplier fairly • Extent to which the OEM has a reputation for trustworthiness • Extent to which the OEM would take unfair advantage of the supplier (reverse scored) Source: J Dyer: ‘The Role of Trustworthiness in Reducing Transaction Costs and Improving Performance’ Copyright © The Boston Consulting Group 2006 All rights reserved
Value added per employee Index 1968=100
800 700 Toyota 600 500 Japanese Suppliers
400 300
US OEMs
200 US Suppliers
100
0 1968
1971 1974
1977
1980 1983
1986
1989
1992
1995 1998
2001
Source: BCG analysis, updating time series developed by M. Lieberman and S. Asaba: ‘Inventory Reduction and Productivity Growth: A Comparison of Japanese and US Automotive Sectors’, Managerial and Decision Economics, Vol 18, pp 73-85 (1997). Copyright © The Boston Consulting Group 2006 All rights reserved
MMORPGs1: The Emergence Of ‘Peer Production’ z z
1,000
z z z
z
z
Second Life (Including playerproduced content)
100
z z
Programmer/ years (for coding and content development)(2)
z
z
z
z
z z
z z
100
The Godfather
World of Warcraft, Sims 2
Star Wars Galaxies, Doom 3
Second Life (Platform Only) zz
Log scale z z
Most expensive movie 10
Later PS1, N64 titles
Earlier PS1, N64 titles
Voodoo 1 chip enables 3D content
1
10 z
1
Atari, VCS Games
z
Playstation 1
NES Games, arcade
z
1980
1985
1990
1995
2000
2005
(1) Massively Multiplayer Online Role Playing Games (2) Implicit translation: one programmer year costs $100,000 Source: Linden Labs, BCG Analysis Copyright © The Boston Consulting Group 2006 All rights reserved
($M)
Self-Organization in MMORPGs… Transactions Among Players of Second Life 100000
Numbers of players with the given number of transactions or fewer
. Instant messaging traffic . Monetary exchanges
10000
1000
100
10
1 1 Data are for one week of transactions Source: Linden Labs, BCG analysis
10
100
1000
Number of transactions
Copyright © The Boston Consulting Group 2006 All rights reserved
10000
…More Self-Organization in MMORPGs Links among Guild Sites Frequency Number of sites with the given level of connectivity (to other guild sites) or more
1
Everquest Dark Age of Camelot
0.1
0.01
0.001 1
10
100
1000
Degree Number of guild sites connected to the given site Source: BCG analysis, webcrawl data Copyright © The Boston Consulting Group 2006 All rights reserved
Transaction Costs
Competing Modes of Co-ordination
Low
Trust
Scalable self-organizing networks
Low transaction costs
Power
Contract
High
Small
Large
‘Scalability’ (Potential Scale) Copyright © The Boston Consulting Group 2006 All rights reserved
Technology enables large scale, human networks... •
to be mapped, analyzed and influenced (new managerial tools)
•
to emerge (a new phenomenon)
…within organizations, across organizations, and among customers These networks organize on a mixture of principles: IN:
ALLOCATING RESOURCES VIA:
•
Contracts
•
Markets
•
Supply & Demand
•
Power
•
Hierarchies
•
Rational Planning
•
Trust
•
Teams or Clans
•
Emergent Modularity
Such networks blur traditional distinctions: producer Q consumer, boss Q worker, work Q play These networks are advantaged in the production of knowledge goods, where very large scale, complexity, innovation and adaptability are the key priorities These networks drive, and are driven by, low transaction costs Copyright © The Boston Consulting Group 2006 All rights reserved
Six Priorities Networks, as a lens and a phenomenon Contracts (markets) versus Power (hierarchies) versus Trust (teams or clans) Modularity, emergent and engineered Trusting supply chains: upstream and downstream User- or peer-created content Intellectual property: open versus closed
Copyright © The Boston Consulting Group 2006 All rights reserved