Email: {ganeshs,blake}@u.washington.edu. Abstract ... a peer-to-peer architectureâ to the third, with a client-server architecture. We had set up a ... In addition, a dedicated network or the Internet could also be used for ..... UDP packet reflector program was hosted at the servers of our collaborators in order to test the virtual.
Experimental Internet Haptic Collaboration Using Virtual Coupling Schemes Ganesh Sankaranarayanan and Blake Hannaford Biorobotics Laboratory, Department of Electrical Engineering, University of Washington Seattle, Washington 98195 Email: {ganeshs,blake}@u.washington.edu Abstract In this paper we present the results from several global-scale haptic collaboration experiments that were performed using the Internet for three virtual coupling schemes proposed to maintain position coherency in a networked haptic virtual environment (NHVE). We compared two of our virtual coupling schemes —which represent a peer-to-peer architecture— to the third, with a client-server architecture. We had set up a packet reflector network at our collaborator servers in order to be able to perform the experiments with subjects located within the same laboratory. Our largest one-way latency was in the order of 200 ms for the packet reflector situated in Italy. The virtual coupling parameters were chosen so that it resulted in stable operation for all the delay values that were tested. UDP was used for haptic data communication because of the high transmission rate requirement for NHVEs. There were three experiments carried out in total: two of them at the packet transmission rate of 1000 Hz with a change in the virtual coupling parameters in Scheme 2 and the third one which tested the three virtual coupling schemes at two fixed transmission rates of 500 Hz and 100 Hz. Locally, the haptic update rate was maintained at 1000 Hz during all the experiments. Our results demonstrate that the peer-to-peer virtual coupling schemes can be used for maintaining position coherency in a NHVE. We also show that the position error and the force rendered to the users increase with the reduction in the packet transmission rate. As such, this work could be used for global-scale stable haptic collaboration using the Internet.
I. I NTRODUCTION Networked haptic virtual environments (NHVEs) have been increasingly used in a wide variety of applications, including surgical training [1], maintenance procedure training and networked games. In such environments, multiple users collaborate on a shared virtual space and at the same time experience force feedback. The implementation of a NHVE could be either in a peer-to-peer (distributed) or a client-server (centralized) architecture. In addition, a dedicated network or the Internet could also be used for communications. As in any delayed system, the NHVE poses several challenging problems. Firstly, the overall system should be stable for the entire duration of the collaboration. Since NHVEs are similar to bilateral systems —in which the energy flows in both directions– they tend to destabilize quickly in presence of communication latency. Secondly, for a meaningful collaboration, position coherency between the copies of the virtual objects should be maintained at all times; otherwise, the virtual objects would start to drift from one another and the collaboration would become meaningless beyond certain time. Lastly, in order to feel stiff objects [2], the haptic update rate has to be maintained at 1000 Hz, which requires a larger bandwidth for haptic data communication. A client-server architecture with a central server which manages one copy of the virtual object is efficient in maintaining position coherency, but round-trip delay is added between the clients and the server. In contrast, in a peer-to-peer architecture, each peer maintains a copy of the virtual object and updates it locally. Therefore, this architecture has half the delay of the client-server architecture but is more susceptible to position discrepancy among the virtual objects. In our previous work [3], we proposed virtual coupling schemes to enforce position coherency in a NHVE and tested it with constant time delays. In this current work, we have tested our virtual coupling schemes in a time-varying delay condition and within the stable region of the system by using the Interent
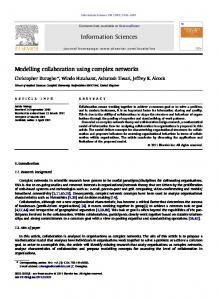
as the network, and at variable packet transmission rates. We also implemented a packet reflector network on the Internet to enable participants on the same laboratory to experience real Internet delays. To our knowledge, there has been no prior work in NHVE that objectively compared the performance of peerto-peer and client-server architecture in time varying delay conditions using the actual Internet. A. Position Coherency We define position coherency in a NHVE as the position discrepancy between the multiple copies of a virtual object at a single instant of global time. B. Goals of this study Our objective in this paper is to evaluate three virtual coupling schemes in terms of how well they minimize the error between the position of the virtual copy of a rigid body that multiple users share in a haptic virtual environment in time varying delay network conditions and at three fixed packet transmission rates. We also evaluate one of the schemes with two different virtual coupling parameters. We are not studying the question of stability in this work; all experiments were conducted with parameters and delay values which resulted in stable operation. II. BACKGROUND Previous work in NHVE can be classified based on connection architecture as either centralized (clientserver) [4], [5], [6], [7], [8] or distributed (peer-to-peer) architecture [9], [10], [11], [12]. Depending on the type of force rendering technique, the NHVE can be further classified into Continuous [5], [6], [7], [11], [3], [12] [13] where users simultaneously manipulate a virtual object, and Impulsive [9], [10], [4], where each user takes turns in manipulating the virtual object. In [13] a multi-rate control architecture for haptic collaboration was proposed and the stability and performance was studied for a fixed transmission rate of 128 Hz and with small communication latency. In [3] three virtual coupling schemes, two representing a peer-to-peer and one client-server architecture was proposed. Human subjects study was conducted to analyze the performance of the virtual coupling schemes using objective measures. In [14], [15], [16], the performance of a shared virtual environment was studied with and without haptic feedback. Their results show that the addition of haptics in a shared virtual environment increased the task performance and virtual presence felt by users. In [17], inclusion of network delay in a cooperative shared haptic virtual environment was found to reduce the task performance. In order to provide fairness among all the participants in a client-server architecture, and to mitigate the effects due to delay jitter, media synchronization techniques available in video and audio streaming [18] were applied to haptic media in [6], [5], and [7]. In [12], a motion synchronization technique based on feedback controller was used to maintain consistency in a two-user peer-to-peer system. Their system was effective up to a roundtrip delay of 300 ms. In [19], a peer-to-peer system with local and global representation of the virtual objects was used for collaboration. TCP/IP was used for communication at low packet transmission rate and locally an optimistic simulation predicted the position of the virtual objects until new information was updated through the network. The simulation was stopped if there was any large discrepancies in position of the local and global representations. Actual Internet was used in [1], [11]and [19]for the implementation of their systems. III. M ETHODS In our previous work [3] we had proposed three virtual coupling schemes for enforcing position coherency in a networked haptic virtual environment. Here, we present the overview of these three virtual coupling schemes. Our virtual environment consists of a simplified collaboration model which supports two users with one degree of freedom as shown in Figures 1, 2, and 3. The virtual copy of the haptic device position is represented by haptic handles H1−1 and H1−2 . O1−1 and O1−2 represent the virtual
Fig. 1.
Virtual Coupling Scheme 1
copies of the rigid body with which both users interact. KV C1 , BV C1 , KV C2 and BV C2 are the virtual couplings that transmit forces to users 1 and 2 respectively. An impedance type haptic display is used to represent the interaction between the human operator and the haptic device. x1 and x4 represent the position of the haptic device and x2 and x3 represent the position of the virtual copies of the rigid bodies. Viscous damping Bd is added between the cube and the surface to keep the mass from drifting off when users are not in contact. The purpose of all these schemes consist in minimizing the error between x2 and x3 . The dotted lines separate the local and the remote user that are connected by a communication network. The time varying delays between the peers and between clients and the server is represented by T1 (t) for the communication path left to right and T2 (t) for the path right to left. A. Scheme 1 Scheme 1 (Fig. 1) represents a peer-to-peer architecture in which both virtual copies of the rigid body are connected by a virtual coupling. This enables the virtual copies to track one another and also transmit forces between them. The masses of the virtual objects were equally divided between the virtual copies to ensure consistency in the total mass felt by each user. A position-position architecture was used to implement the virtual coupling network, which mirrors approaches in bilateral teleoperation [20]. Equations 1 to 4 demonstrate the reaction force applied to each user and the control force acting on the virtual objects. F1 = KV C1 (x2 (t) − x1 (t)) + BV C1 (x˙2 (t) − x˙1 (t)) m x¨2 (t) − Bd x˙2 (t) = KT (x3 (t − T2 (t)) − x2 (t)) 2 +BT (x˙3 (t − T2 (t)) − x˙2 (t)) − F1 F2 = KV C2 (x3 (t) − x4 (t)) + BV C2 (x˙3 (t) − x˙4 (t)) m x¨3 (t) − Bd x˙3 (t) = KT (x2 (t − T1 (t)) − x3 (t)) 2 +BT (x˙2 (t − T1 (t)) − x˙3 (t)) − F2
(1)
(2) (3)
(4)
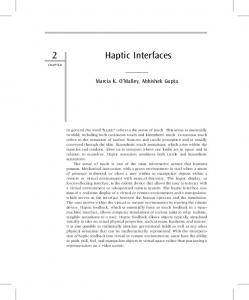
B. Scheme 2 Scheme 2 (Fig.2), described in equations 5 to 8, represents a peer-to-peer architecture with a parallel control structure. Unlike in Scheme 1, the virtual copies of the rigid body are free to move on their respective sides and each user’s position is transmitted across the network. In addition, local virtual couplings are adopted to couple the position of the remote and local user. This scheme requires continuous contact by the two users in order to track the virtual object. F1 = KV C1 (x2 (t) − x1 (t)) + BV C1 (x˙2 (t) − x˙1 (t)) mx¨2 (t) − Bd x˙2 (t) = KV C21 (x4 (t − T2 (t)) − x2 (t)) +BV C21 (x˙4 (t − T2 (t)) − x˙2 (t)) − F1
(5)
(6)
F1
H
KVC21 O1-1 m
BVC1
1-1
x2
Bd
x1 K VC1
BVC21
Position Only
x4 Position Only KVC2
KVC12 O1-2 m
BVC12
x1
x2
Server
KVC21
H 1-1
BVC1
x3
Virtual Coupling Scheme 2
KVC1 F1
F2
2-2
BVC2 Bd
Fig. 2.
H
Bd
O1-1 m
x4
Position Only KVC2
BVC21
H
F2
2-2
Position Only
BVC2 x3 Client
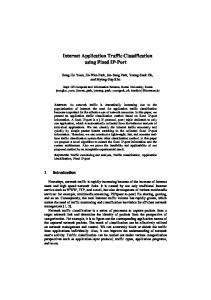
Fig. 3.
Virtual Coupling Scheme 3
F2 = KV C2 (x3 (t) − x4 (t)) + BV C2 (x˙3 (t) − x˙4 (t)) mx¨3 (t) − Bd x˙3 (t) = KV C12 (x1 (t − T1 (t)) − x3 (t)) +BV C12 (x˙1 (t − T1 (t)) − x˙3 (t)) − F2
(7)
(8)
C. Scheme 3 Scheme 3 (Fig. 3) represents a client-server architecture with User 1 located in the server and User 2 as the client. The server maintains the only copy of the rigid body. The position of User 2 is conveyed across the communication network and, along with the position of User 1, updates the position of the virtual object centrally at the server. The position update of the virtual object is then transmitted back to the client who then uses a local virtual coupling to generate the appropriate reaction forces to User 2. Since the virtual object at the client’s side displays the updated position from the server, it is represented as just a position constraint in Fig. 3. Equations 9 to 12 describe Scheme 3. F1 = KV C1 (x2 (t) − x1 (t)) + BV C1 (x˙2 (t) − x˙1 (t)) mx¨2 (t) − Bd x˙2 (t) = KV C21 (x4 (t − T2 (t)) − x2 (t)) +BV C21 (x˙4 (t − T2 (t)) − x˙2 (t)) − F1
(9)
(10)
x3 (t) = x2 (t − T1 (t))
(11)
F2 = KV C2 (x3 (t) − x4 (t)) + BV C2 (x˙3 (t) − x˙4 (t))
(12)
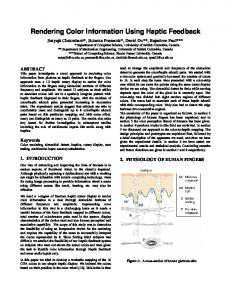
IV. E XPERIMENT S ETUP The experimental collaborative haptic system is shown in Fig. 4. The hardware part of the setup includes two workstations, WS1 and WS 2, two PHANToM Omni haptic devices and a network connection to enable Internet haptic collaboration. WS1 is an AMD Opteran 1.5 GHz with 1 GB RAM, and WS2 is an Intel Pentium 4 2.66 GHz with 1GB RAM with both running Fedora Core 4 Linux. The two workstations are situated in the same laboratory but in different cubicles. Both WS1 and WS2 have static IPs assigned
Fig. 4.
Experiment Setup
to them to enable opening specific ports for UDP and TCP communications. The collaboration software framework implements the virtual coupling schemes and enables Internet communication. The packet reflector setup enables experiments using the Internet. A. Collaboration Software Framework The collaboration software framework consists of two separate programs for each user. The Haptic controller (written in C++) implements the virtual coupling schemes, manages communication with the haptic device, performs collision detection and dynamic updates of the virtual objects, and renders appropriate forces to the users. The communication module of the Haptic controller manages the haptic UDP communication at variable rates. The graphical display program for the user interface and the virtual environment are managed using a separate application HcolGUI based on Qt 4.1.1 and OpenGL libraries. This architecture would enable us to render a complex virtual environment for collaboration by running the graphic application in a separate computer with advanced graphic hardware and memory. The Haptic controller and HcolGUI communicate using TCP/IP connection: the graphic display updates at 30 Hz and the data communication from HcolGUI to Haptic controller is event-based. The Haptic controller program also detects the corrupt and out-of-sequence packets using a simple checksum and unique packet sequence number that is generated in the servo loop for each data packet. In this work, both out-of-sequence and corrupt packets are dropped and the last valid packet information is utilized until the new data packet information is updated: essentially, a zero-order hold (ZOH). The snapshot of the haptic virtual environment as seen by User 1 is shown in Fig. 5. It consists of a cube that is restricted to one degree of freedom movement on a floor in a three dimensional room. Blue and yellow spheres represent the positions of the local and remote users. It also contains a target sphere that moves at a constant speed of 1.333 mm/s along a solid white line. The task of the users is to jointly move the cube along the line and to make the target align at the center of the cube at all times. The users can touch and feel all sides of the cube but can contribute to the motion only by pressing on the left or the right side of the cube. In this work, User 1 was allowed to touch the left side of the cube and User 2, the right side. Collision detection based on an accelerated bounding box method was chosen to compute collisions between user positions and the cube. The collision between the walls and the cube also restricts the latter to be in the visible scene at all times. A similar virtual environment with its display rotated (for User 2 to see the right side of the cube) is shown at WS2. The virtual environments also had additional attributes in order to aid the users during the experiments. The color of the cube –which is initially white– is changed to blue when the users make contact, as long as the reaction force applied to users exceeds 10% of 3.3N (the maximum recommended continous force for the Omni haptic device). The color of the cube changes to red when the user reaction force is greater than 3.3N. The color of the
Fig. 5.
Fig. 6.
Simulator snapshot
Experiment network topology
target sphere changes from green to purple during tracking and the solid white line gives the user a hint about when the target is going to change direction. B. Packet Reflector Network UDP packet reflector program was hosted at the servers of our collaborators in order to test the virtual coupling schemes using the Internet. The packet reflector program routed the UDP haptic data packets between the workstations WS1 and WS2. Consequently, human subjects could be located in the same laboratory, which simplified recruiting, consistent enforcement of experiment protocol and procedures, and avoided the usual issues of assorted time zones. Different networks with varying delays, number of hops, and bandwidths can be tested seamlessly by switching between the packet reflectors during the experiment. The network topology of our packet reflector set up is shown in Fig. 6. It consists of three packet reflector locations: one at the Robotics and Control Laboratory at the University of British Columbia (UBC), Vancouver, Canada, another one at the Image Analysis Laboratory at the North Carolina State University (NCSU), Raleigh, USA, and the last one at the CRIM Lab at Scuola Superiore Sant’Anna (SSUP), Pontedera, Italy. The packets are transmitted to these points from the experimenters’ location at the Biorobotics Laboratory, University of Washington (UW), Seattle, USA. The UW and the NCSU are partners in NLR (the National Lambda Rail), a gigabit research network and the NLR link directly connects both locations. The connection between UW and UBC is through NLR and CANARIE (the Canadian gigabit research network), and the one between UW and SSSUP is through NLR, GEANT2 and GARR network (both European gigabit research networks); a switching node in New York City connects GEANT2 to NLR. The three packet reflector locations along with the local network connection constitute four time varying delay conditions whose values obtained during the experiments using UDP packets appear in Table I. The difference in measured delay to round-trip ping times to the servers was due to clock system drift between workstations WS1 and WS2.
TABLE I D ELAY C ONDITION W ITH PACKET R EFLECTOR L OCATION
Delay Condition
WS 1
Ping Time
Mean (ms)
Std (ms)
Mean (ms)
1 - Local
1.27
0.35
0.10
2 - UBC
43.8
0.53
30.46
3 - NCSU
74.2
0.63
76.53
4 - SSSUP
203.9
2.52
189.65
V. E XPERIMENT P ROCEDURE Sixteen subjects, 10 male and six female, with ages ranging from 19 to 50 years old were selected for the experiments. Two subjects were left-handed and the rest were right-handed. The experimenter acted as User 1 and each subject as User 2. Through an instructional video, each subject was given a detailed explanation of what they were going to do in the experiment. Each subject was then given five practice trials to get comfortable with the virtual environment and the interaction with the cube. Their performance was monitored at the same time, and if they successfully complete five trials, the practice trials were stopped and they proceeded to the actual experiment. They were asked to touch and apply forces on the right side of the cube as the experimenter interacted on the left side. The subjects were encouraged to maintain contact with the cube at all times. The target motion was enabled by the experimenter by pressing the button on the stylus of the Omni haptic device. Each subject waited for the change of color in the target to start moving. They were also instructed to apply less force when the color of the cube changed to red and until it reverted back to blue. To reduce the learning effect, the order of the schemes and delay conditions were randomized for the experiments and loaded as a configuration file during the beginning of each one. Three different experiments were conducted to test the virtual coupling schemes. Two different virtual coupling parameters were used to test Scheme 2, distinguished by the labels 2-1 and 2-2. The virtual coupling parameters used in the three experiments are shown in Table II. Experiment 1 was conducted for Schemes 1, 2-1 and 3. Ten subjects were used for this experiment and each one of them completed 12 trials corresponding to three schemes and four delay conditions. In experiment 2, Scheme 2-2 alone was tested with a total of 10 subjects. Each subject did four trials for this experiment. In experiment 3, Schemes 1, 2-2 and 3 were tested for two different UDP haptic data packet transmission rates of 500 and 100 Hz respectively. Only delay conditions 1, 3 and 4 were used to reduce the number of trials for each subject. As a result, each subject performed 18 trials in this experiment, corresponding to three schemes, three delay conditions and two packet transmission rates. The position and velocity of the two cubes, along with the position of the target and forces rendered to each user, the number of corrupt, out-of-sequence and lost packets, and the delay in ms computed from the time stamp information were recorded in a file for later analysis. VI. R ESULTS The histograms of the one-way delay between WS1 and WS2 for the four delay conditions are shown in Fig. 7a. The independent axis in logarithmic scale is the time in ms and the dependent axis is the count of the one-way delays in ms measured at WS1. All the delay values had a peak value around their respective means and a long tail towards increasing delay. The delay condition four exhibited the longest tail among all the conditions. Fig. 7b shows the time varying delay as measured at WS1 from one of the
TABLE II V IRTUAL C OUPLING PARAMETERS Parameters
Values
Schemes
Selection
m
0.25Kg
1, 2-1, 2-2, 3
experimental
Bd
Ns 0.025 mm
1, 2-1,2-2, 3
experimental
N 2.0 mm
1,2-2
experimental
Ns 0.3 mm
1,2-2
experimental
N 0.5 mm
1, 2-1, 3
device manual
Ns 0.003 mm
1,2-1,3
device manual
KT , KV C21 , KV C12 BT , BV C21 , BV C12 KV C1 , KV C2 , KV C12 , KV C21 BV C1 , BV C2 , BV C12 , BV C21
trial from experiment 1. The independent axis is the time in ms and the dependent axis is the measured one-way delay in ms. Fig. 8a shows the position of the two cubes relative to the position of the target for delay condition 4 and for Scheme 1 from experiment 3. The packet transmission rate was set at 100 Hz. The independent axis is the time in ms and the dependent axis is the position x2 , x3 and the target in mm. The position of the two cubes shows the two users tracking the target. Fig. 8b shows the zoomed view of Fig. 8a to highlight the time varying delay and ZOH effect on the position of Cube 2 received remotely from WS2. (a)
4
(b)
x 10
350
PR 1000 Hz
12
300
10
250 One−way Delay in ms
Delay Count
14
Local NCSU − USA
8
6 UBC − Canada 4
PR 1000 Hz
SSSUP, Italy
200
150 NCSU, USA
100 SSSUP − Italy
2
UBC, Canada
50 Local
0 0 10
1
2
10 10 One Way Time varying Delay log(ms)
(a) Fig. 7.
3
10
0
0
2
4
6 8 Time in ms
10
12
14 4
x 10
(b)
a, Histogram of one-way time varying delay. b, one-way delay between WS2 and WS1
Figs. 9a, 10a and 11a show the RMS position error between x2 and x3 measured at WS1 for all the schemes and packet transmission rates. Due to system clock drift between WS1 and WS2, the position errors are reported only with respect to WS1. The vertical error bars represent the standard deviation around mean error values. On the whole, the RMS position error increased for all the schemes with increasing time. For scheme 1 the RMS position error ranged from 0.4606 mm to 0.67 mm for the transmission rate of 1000 Hz, and 0.7545 mm to 0.8285 mm for 500 Hz and 0.717 mm to 0.86 mm for 100 Hz respectively. For scheme 2-1 it ranged from 1.6 mm to 2.58 mm for 1000 Hz transmission rate. For scheme 2-2 it ranged from 0.55 mm to 0.93 mm for 1000 Hz, and 0.74 mm to 1.01 mm for 500 Hz and 0.78 mm to 1.13 mm for 100 Hz respectively. For Scheme 3 it ranged from 0.003 mm to 0.76 mm for 1000 Hz, 0.005 mm to 0.8 mm for 500 Hz, and 0.09 mm to 0.83 mm for 100 Hz respectively. The RMS error was substantially higher for Scheme 2-1. Schemes 2-2 had much lower error values
(a)
(b)
50
−7
Cube1 X2 Cube2 X3 Target
PR 100 Hz
40 30 20
−8 Position in mm
Position in mm
Cube1 X2 Cube2 X3
PR 100 Hz −7.5
10 0 −10
−8.5
−9
−20 −30
−9.5
−40 −50
0
2
4
6 8 Time in ms
10
12
14
−10 7.6
4
x 10
(a)
7.61
7.62
7.63
7.64 7.65 Time in ms
7.66
7.67
7.68 4
x 10
(b)
Fig. 8. a, Positions of Cube 1 and Cube 2 tracking the target. b, Positions of Cube 1 and Cube 2 zoomed to show the variable delay and ZOH effect
compared to Scheme 2-1 but was still higher than Scheme 1. Scheme 2-1 was not included in the statistical analysis of the data since it was tested only for 1000 Hz transmission rate. Repeated measures ANOVA of the data show that delay had significant effect on all the schemes for all packet transmission rates (p < 0.001) and all the three schemes were significantly different from each other (p < 0.001). Post Hoc comparisons using Bonferroni method further revealed that for scheme 1 packet transmission rate of 1000 Hz was significantly different from 500 Hz and 100 Hz with a p value of 0.004 and 0.003 respectively. Between the 500 Hz and 100 Hz, no statistical significance was found. In scheme 2-2, the packet transmission rate of 100 Hz was significantly different from both 500 Hz and 100 Hz with a p value of 0.016. No significant difference was found between 1000 Hz and 500 Hz and 100 Hz and 500 Hz packet transmission rates respectively. Figs. 9b, 10b and 11b show the peak position error between x2 and x3 measured at WS1 for all the schemes and packet transmission rates. On the whole, the peak position error increased for all the schemes with increasing time. For scheme 1 the peak position error ranged from 0.907 mm to 1.59 mm for the transmission rate of 1000 Hz, and 1.4184 mm to 2.0 mm for 500 Hz and 1.323 mm to 2.074 mm for 100 Hz respectively. For scheme 2-1 it ranged from 3.65 mm to 6.33 mm for 1000 Hz transmission rate. For scheme 2-2 it ranged from 1.78 mm to 2.76 mm for 1000 Hz, and 2.08 mm to 3.26 mm for 500 Hz and 2.53 mm to 3.18 mm for 100 Hz respectively. For Scheme 3 it ranged from 0.04 mm to 1.93 mm for 1000 Hz, 0.053 mm to 2.21 mm for 500 Hz, and 0.11 mm to 2.38 mm for 100 Hz respectively. The peak position error was substantially higher for Scheme 2-1. All the schemes showed an increasing trend in the error for increase in delay. Repeated measures ANOVA of the data show that delay had significant effect on all the schemes for all packet transmission rates (p < 0.001) and all the three schemes were significantly different from each other (p < 0.001). Post Hoc comparisons using Bonferroni method further revealed that for peak position error, the packet transmission rate didn’t had significant effect. (a) RMS Position Error in mm
3 2.5 2 1.5 1 0.5 0
(b) 9
Delay 1 Delay 2 Delay 3 Delay 4
Delay 1 Delay 2 Delay 3 Delay 4
8 Peak Position Error in mm
4
3.5
7 6 5 4 3 2 1
1, 1000 1, 500 1, 100 Scheme, Packet Transmission Rate in Hz
(a)
0
1, 1000 1, 500 1, 100 Scheme, Packet Transmission Rate in Hz
(b)
Fig. 9. a, RMS position error between Cube 1 and Cube 2 measured at WS 1 for Scheme 1. b, Peak position error between Cube 1 and Cube 2 measured at WS1 for Scheme 1
(a) RMS Position Error in mm
(b) 9
Delay 1 Delay 2 Delay 3 Delay 4
3 2.5 2 1.5 1 0.5 0
Delay 1 Delay 2 Delay 3 Delay 4
8 Peak Position Error in mm
4
3.5
7 6 5 4 3 2 1 0
2−1, 1000 2−2, 1000 2−2, 500 2−2, 100 Scheme,Packet Transmission Rate in Hz
(a)
2−1, 1000 2−2, 1000 2−2, 500 2−2, 100 Scheme, Packet Transmission Rate in Hz
(b)
Fig. 10. a, RMS position error between Cube 1 and Cube 2 measured at WS 1 for Scheme 2. b,Peak position error between Cube 1 and Cube 2 measured at WS1 for Scheme 2
(a) RMS Position Error in mm
(b) 9
Delay 1 Delay 2 Delay 3 Delay 4
3 2.5 2 1.5 1 0.5 0
Delay 1 Delay 2 Delay 3 Delay 4
8 Peak Position Error in mm
4
3.5
7 6 5 4 3 2 1 0
3, 1000 3, 500 3, 100 Scheme,Packet Transmission Rate in Hz
(a)
3, 1000 3, 500 3, 100 Scheme, Packet Transmission Rate in Hz
(b)
Fig. 11. a, RMS position error between Cube 1 and Cube 2 measured at WS 1 for Scheme 3. b, Peak position error between Cube 1 and Cube 2 measured at WS1 for Scheme 3
(a)
(b) 3.5
Delay 1 Delay 2 Delay 3 Delay 4
3 2.5 2 1.5 1 0.5 0
1, 1000 1, 500 1, 100 Scheme, Packet Transmission Rate in Hz
(a) Fig. 12.
RMS Force Applied To User 2 in N
RMS Force Applied To User 1 in N
3.5
Delay 1 Delay 2 Delay 3 Delay 4
3 2.5 2 1.5 1 0.5 0
1, 1000 1, 500 1, 100 Scheme, Packet Transmission Rate in Hz
(b)
(a, RMS force applied to User 1 for Scheme 1. b, RMS force applied to User 2 for Scheme 1
Figs 12a and 12b show the RMS value of the force applied to User 1 and User 2 for scheme 1 and for all three packet transmission rates. The RMS value of force for user 1 ranged from 0.92 N to 1.36 N for 1000 Hz, and 1.53 N to 1.65 N for 500 Hz, and 1.46 N to 1.72 N for 100 Hz respectively. For user 2 the RMS value of force ranged from 0.95 N to 1.33 N for 1000 Hz, and 1.54 N to 1.64 N for 500 Hz, and 1.47 N to 1.69 N for 100 Hz respectively. Figs 13a and 13b show the RMS value of the force applied to User 1 and User 2 for scheme 2-1 and 2-2, and for all three packet transmission rates. For scheme 2-1 the RMS value of force for user 1 ranged from 0.69 N to 0.88 N for 1000 Hz. For scheme 2-2 it ranged from and 1.01 N to 1.17 N for 1000 Hz, and 1.3 N to 1.51 N for 500 Hz, and 1.47 N to 1.44 N for 100 Hz respectively. For user 2 the RMS value of force for scheme 2-1 ranged from 0.76 N to 0.8 N for 1000 Hz. For scheme 2-2 it ranged from and 1.06 N to 1.32 N for 1000 Hz, and 1.4 N to 1.57 N for 500 Hz, and 1.46 N to 1.51 N for 100 Hz respectively.
(a)
(b) 3.5
Delay 1 Delay 2 Delay 3 Delay 4
3 2.5 2 1.5 1 0.5 0
RMS Force Applied To User 2 in N
RMS Force Applied To User 1 in N
3.5
2 1.5 1 0.5 0
2−1, 1000 2−2, 1000 2−2, 500 2−2, 100 Scheme, Packet Transmission Rate in Hz
Delay 1 Delay 2 Delay 3 Delay 4
3 2.5
2−1, 1000 2−2, 1000 2−2, 500 2−2, 100 Scheme, Packet Transmission Rate in Hz
(a)
a, RMS force applied to User 1 for Scheme 2. b, RMS force applied to User 2 for Scheme 2
(a)
(b)
RMS Force Applied To User 1 in N
3.5
3.5
Delay 1 Delay 2 Delay 3 Delay 4
3 2.5 2 1.5 1 0.5 0
RMS Force Applied To User 2 in N
Fig. 13.
(b)
2 1.5 1 0.5 0
3, 1000 3, 500 3, 100 Scheme, Packet Transmission Rate in Hz
Delay 1 Delay 2 Delay 3 Delay 4
3 2.5
3, 1000 3, 500 3, 100 Scheme, Packet Transmission Rate in Hz
(a) Fig. 14.
(b)
a, RMS force applied to User 1 for Scheme 3. b, RMS force applied to User 2 for Scheme 3
Figs 14a and 14b show the RMS value of the force applied to User 1 and User 2 for scheme 3 and for all three packet transmission rates. For user 1 it ranged from and 0.87 N to 1.02 N for 1000 Hz, and 1.48 N to 1.59 N for 500 Hz, and 1.43 N to 1.58 N for 100 Hz respectively. For user 2 the RMS value of force for scheme 2-1 ranged from 0.87 N to 1.2 N for 1000 Hz, and 1.55 N to 1.62 N for 500 Hz, and 1.45 N to 1.6 N for 100 Hz respectively. Scheme 1 had higher values of force for User 1 and User 2. Scheme 2-2 had a lower value of force compared to Scheme 1 and 3. The force values for User 1 and 2 increased on the whole with decrease in the packet transmission rate. Repeated measures ANOVA of the data show that packet transmission rate had significant effect on both RMSF1 and RMSF2 with a p value of 0.003 and 0.007 respectively. Post hoc comparison using Bonferroni method show that delay didn’t had significant effect on scheme 2-2 and 3 for RMSF1 and scheme 3 for RMSF2. (a)
(b) 4.5
Out−of−Sequence Packets (%)
4
1000 Hz 500 Hz 100 Hz
3.5 3 2.5 2 1.5 1 0.5 0
1000 Hz 500 Hz 100 Hz
4 Packets Lost in Communication (%)
4.5
3.5 3 2.5 2 1.5 1 0.5
1
2
3 Delay Condition
(a)
4
0
1
2
3
4
Delay Condition
(b)
Fig. 15. a, Percentage of out-of-sequence packets for all the experiments combined. b, Percentage of packets lost in transmission for the experiments combined
Figs. 15 a and 15 b shows the network performance in terms of percentage of out-of-sequence packets
and packets that are lost in communication measured at WS1. Packet measurement data for four delay conditions from all the experiments were combined to calculate the lost and out-of-sequence packets as a percentage of total packets used during the experiments. For delay condition 1 the out-of-sequence packet percentage were 0.0007 % for 1000 Hz, and 0 % for both 500 Hz and 100 Hz packet transmission rates respectively. For delay condition 2 it was 0.0064 % for 1000 Hz. For delay condition 3 it was 0.0086 %, 0.0075 % and 0.0078 % for 1000 Hz, 500 Hz and 100 Hz respectively. For delay condition 4 it was 0.0396 %, 0.0224 % and 0.0172 % for 1000 Hz, 500 Hz and 100 Hz respectively. The percentage of packets lost in communication was 0 % for delay conditon 1 for all the three transmission rates. For delay condition 2 it was 0.042 % for 1000 Hz. For delay condition 3 it was 0.0085 %, 0.0113 % and 0.0088 % for 1000 Hz, 500 Hz and 100 Hz respectively. For delay condition 4 it was 3.67 %, 4.05 % and 2.83 % for 1000 Hz, 500 Hz and 100 Hz respectively. On the whole, the out-of-sequence packets percentage were negligible compared to UDP packets lost in communication. The lost packets percentage was highest for the delay condition 4, which was a transatlantic link to Italy from Seattle. VII. D ISCUSSION In the experimental results, the two peer-to-peer schemes 1 and 2-2 showed a comparable performance to that of the server-based Scheme 3. Between Scheme 2-1 and 2-2, Scheme 2-2 was better in preserving position coherency. In our experiments with two fixed packet transmission rates, both the position error and the force rendered to the users increased with the reduction of the packet transmission rate for all three schemes. Scheme 2-1 showed a large position error due to the compliance between the remote and local user position at each user’s end. When the virtual coupling parameters were increased to the same value of scheme 1, the position errors reduced to a level comparable to that of Scheme 1. The position error was sensitive to both delay and packet transmission rate and the force rendered to the user was sensitive to the packet transmission rate. The increase in the position error and force for all the three schemes in the reduced packet transmission rate was due to the ZOH that holds the previous valid haptic data value until the new transmission arrives to each user. We plan to further investigate using a higher order hold and prediction techniques to mitigate this problem. In this work the virtual coupling schemes were tested within its stable region of operation. We have implemented time delay compensation techniques using wave variables and time-domain passivity control methods for scheme 1 and compared the performance to that of a tuned PD Control [21]. In addition, in this work only two users were considered; subsequently, we plan to study the virtual coupling schemes for more than two users. ACKNOWLEDGMENT We would like to thank Oliver Tonet from SSSUP, Orucn Goskel and Tim Salcudean at UBC and Krish Karthik from NCSU for hosting the packet reflector network. Funding from Boeing, US Army, Medical Research and Materials Command, grant number DAMD17-1-0202 and TATRC, Telemedicine and Advanced Technology Research Center. R EFERENCES [1] C. Gunn, M. Hutchins, D. Stevenson, M. Adcok, and P. Youngblood, “Using collaborative haptics in remote surgical training,” in Proc.First Joint Eurohaptics Conference and Symposium on Haptic Interfaces for Virtual Environment and Teleoperator Systems(WHC’05), 2005, pp. 481–482. [2] C.B.Zilles and J. Salisbury, “A constraint-based god-object method for haptic display,” in Proc.IEEE/RSJ International Conference on Intelligent Robots and Systems, Pittsburgh,PA, 1995, pp. 146–151. [3] G. Sankaranarayanan and B. Hannaford, “Virtual coupling schemes for position coherency in networked haptic environments,” in Proc. BioRob 2006. The First IEEE/RAS-EMBS International Conference On Biomedical Robotics And Biomechatronics., Pisa,Italy, 2006, pp. 853–858.
[4] H.R.Choi, B.H.CHoi, and S.M.Ryew, “Haptic display in the virtual collaborative workspace shared by multiple users,” in Proc. IEEE International Workshop on Robot and Human Communication(RO-MAN’97), 1997, pp. 478–483. [5] K. Hikichi, H. Morino, Y. Yasuda, I. Arimoto, and K. Sezaki, “The evaluation of adaptation control for haptics collaboration over the internet,” in Proc. IEEE Communications Quality and Reliability(CQR) International Workshop, May 2002. [6] Y. Ishibashi, T. Kanbara, T. Hasegawa, and S. Tasaka, “Traffic control of haptic media in networked virtual environments,” in Proc. IEEE Workshop on Knowledge Media Networking, 2002, pp. 11–16. [7] Y. Ishibashi, T. Hasegawa, and S. Tasaka, “Group synchronization control for haptic media in networked virtual environments,” in Proc. IEEE International Symposium on Haptic Interfaces for Virtual Environment and Teleoperator Systems(HAPTICS’04), 2004, pp. 106–113. [8] M. Y. Sung, Y. Yoo, K. Jun, N.-J. Kim, and J. Chae, “Experiments for a collaborative haptic virtual reality,” in Proc. 16th International Conference on workshop on Artificial Reality and Telexistence-ICAT’06, Washington, DC, USA, 2006, pp. 174–179. [9] J. P. Hespanha, M. McLaughlin, G. S. Sukhatme, M. Akbarian, R. Garg, and W. Zhu, “Haptic collaboration over the internet,” in Proc.Fifth PHANToM Users’ Group Workshop(PUG00), Aspen,CO, 2000, pp. 9–13. [10] P. Buttolo, R. Oboe, and B. Hannaford, “Architectures for shared haptic virtual environments,” Computer and Graphics, vol. 21, no. 4, pp. 478–483, 2000. [11] J. Kim, H. Kim, H. K. Tay, M. Muniyandi, M. A. Srinivasan, J. Jordan, J. mortensen, M. oliveira, and M. Slater, “Transatlantic touch: A study of haptic collaboration over long distance,” PRESENCE, vol. 13, no. 3, pp. 328–337, 2004. [12] J. Cheong, S.-I. Niculescu, A. Annaswamy, and M. A. Srinivasan, “Motion synchronization in virtual environments with shared haptics and large time delays,” in WHC ’05: Proceedings of the First Joint Eurohaptics Conference and Symposium on Haptic Interfaces for Virtual Environment and Teleoperator Systems. Washington, DC, USA: IEEE Computer Society, 2005, pp. 277–282. [13] M. Fotoohi, S. Sirouspour, and D. Capson, “Multi-rate control architectures for dextrous haptic rendering in cooperative virtual environments,” in Proc. IEEE Conference on Decision and Control, San Diego, CA, USA, 2006, pp. 4478–4483. [14] M. N. Masahiro Ishii and M. Sato, “Networked spidar: A networked virtual environment with visual, auditory, and haptic interactions,” PRESENCE, vol. 3, no. 4, pp. 351–359, 1994. [15] C. Basdogan, C. hao Ho, M. A. Srinivasan, and M. Slater, “An experimental study on the role of touch in shared virtual environments,” ACM Transactions on Computer-Human Interaction, vol. 7, no. 4, pp. 443–460, 2000. [16] E.-L. Sallnas, K. Rassmus-Grohn, and C. Sjostrom, “Supporting presence in collaborative environments by haptic force feedback,” ACM Transactions on Computer-Human Interaction, vol. 7, no. 4, pp. 461–476, 2000. [17] M. O. Alhalabi, S. Horiguchi, and S. Kunifuji, “An experimental study on the effects of network delay in cooperative shared haptic virtual environment,” Computer and Graphics, vol. 27, no. 2, pp. 205–213, 2003. [18] Y. Ishibashi and S. Tasaka, “A comparative survey of sychronization algorithms for continuous media in network environments,” in Proc. IEEE Local Computer Networks LCN 2000, Tampa,Florida, 2000, pp. 337–348. [19] M. Glencross, C. Jay, J. Feasel, L. Kohli, M. Whitton, and R. Hubbold, “Effective cooperative haptic interaction over the internet,” in Proc.IEEE Virtual Reality Conference, Charlotte, NC, March 2007, pp. 115–122. [20] R. J. Anderson and M. W. Spong, “Bilateral control of teleoperators with time delay,” IEEE Trans. Automat. Contr., vol. 34, no. 5, pp. 494–501, May 1989. [21] G. Sankaranarayanan and B. Hannaford, “An experimental comparison study for bilateral internet-based teleoperation,” in review for Proc.IEEE International Conference Robotics and Automation, Pasadena, CA, May 2008.