Collaborative Visualization: Current Systems and Future Trends Christophe Mouton∗ EDF R&D, Paris, France
Kristian Sons† DFKI, Saarbr¨ucken, Germany
Ian Grimstead‡ Cardiff University, Cardiff, UK
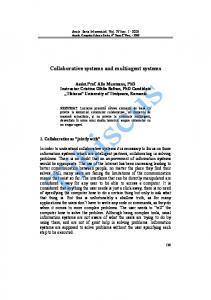
Figure 1: Transatlantic Collaborative Visualization with ParaViewWeb. From left to right: In New York on an iPad (with multi-touch navigation) and on a MacBook, in Paris on a Desktop PC
Abstract
easily work remotely with teams of people, pulling in the compute power needed for a special project—without investing in a complete HPC solution of our own. Given the recent advances in mobile networking, hand-held devices and rendering hardware, it is timely to review current approaches to collaborative visualization and compare against these latest advances. In this paper, we present a review in the next section of the current state-of-the-art in collaborative visualization, covering CAE collaborative / distributed visualization, multi-user online gaming, integration of collaborative support into existing applications / processes, and the common issues these systems all face. The next section then examines the recent trends in technology, covering hardware platform, networks, and web browsers. This information is reviewed and brought together in the following section projecting how these trends will merge with collaborative visualization to produce the next generation of visualization facilities. We then finish our report with our conclusions regarding the future direction of collaborative visualization.
Collaborative visualization is becoming more and more important, given the distributed and mobile nature of teams. Current visualization systems are often still monolithic and not flexible enough for todays users; they have not kept pace with improvements in other areas of information technology (mobile networking, compute-ondemand). With this in mind, we review current visualization systems (covering CAE collaborative visualization, multi-user online games and solutions to bring collaboration to existing applications / processes) and contrast against the latest related advances in technology: new hardware platforms, availability of cloud computing, mobile network capabilities and web browser functionality. We then analyse how these advances could impact on future collaborative visualization systems and discuss potential areas of improvement to existing systems. CR Categories: H.5.3 [Information Interfaces and Presentation]: Group and Organization Interfaces—Computer-supported cooperative work; I.3.2 [Computer Graphics]: Graphics Systems— Distributed/network graphics
2
Looking back at a previous review of distributed visualization [Grimstead et al. 2005] taken in 2005 (at the start of Grid/Web Service development), it was noted that most systems were designed for less than 100 simultaneous users, relying on single or multiple servers to support the users. This pattern was explained by providers wishing to ensure quality of service, and to maintain security. The exception was collaborative VR systems, where peerto-peer networking was often used to support in excess of one thousand simultaneous users. Each system required a custom client, with each system operating in isolation and not interoperating with other systems. With this context in mind, we now wish to review recent advances in the field and note significant changes at the end of this section.
Keywords: CAE, Collaborative, Scientific Visualization, Web3D, 3D-Internet
1
Current Collaborative Visualization Systems
Introduction
Over the last year, there has been an explosion in mobile computing—making stories from science fiction suddenly every day reality, such as remotely controlling your house (switching off lights, increasing the temperature of the heating) through your smartphone, all whilst walking along the street. Suddenly - there is an app for that. The ubiquitous nature of mobile computing is changing the way we work and live, whilst being accompanied by new business models for HPC such as pay per use. Now, we can
2.1
∗ e-mail:
[email protected] † e-mail:
[email protected] ‡ e-mail:
[email protected]
Computer-Aided Engineering (CAE) Collaborative / Distributed Visualization
The COVISE (COllaborative VIsualization and Simulation Environment) system has continued to evolve [W¨ossner et al. 2002; Niebling et al. 2010], moving from a specific client program to the latest release supporting a WebGL and HTML5 client, which runs natively in a web browser. The WebGL client requires no local installation, and connects to existing COVISE sessions with other more complex clients. However, the full polygonal scene graph must be downloaded for display, which is slow due to slow text
Copyright © 2011 by the Association for Computing Machinery, Inc. Permission to make digital or hard copies of part or all of this work for personal or classroom use is granted without fee provided that copies are not made or distributed for commercial advantage and that copies bear this notice and the full citation on the first page. Copyrights for components of this work owned by others than ACM must be honored. Abstracting with credit is permitted. To copy otherwise, to republish, to post on servers, or to redistribute to lists, requires prior specific permission and/or a fee. Request permissions from Permissions Dept, ACM Inc., fax +1 (212) 869-0481 or e-mail
[email protected]. I3D 2011, Paris, France, June 20 – 22, 2011. © 2011 ACM 978-1-4503-0774-1/11/0006 $10.00
101
2.2
parsing of AJAX messages, although once received the rendering speed is very good. COVISE supports per-session access control, and can use multiple servers to distribute the workload.
Generic Collaborative Visualization Tools
Generic tools cannot make any assumption about data format, therefore they rely on sampling the remote systems graphics buffer (i.e. the screen display) and sending it to interested parties in the form a video stream. Such systems can operate at the system/driver level, and not interfere with existing applications; they may be considered “screen sharing” tools. In this section we describe some of these systems.
The Resource-Aware Visualization Environment (RAVE) [Grimstead et al. 2009] was designed to test the suitability of Web Services to support collaborative visualization. It used a central data server to host sessions, supporting multiple users per session (10s of users) and multiple sessions per server. RAVE differs from most other systems in that local client resources were examined to select an appropriate mthod of transport: either the polygonal dataset was transmitted for viewing, or a service was used to perform the rendering for the client, which then received a real-time video feed. Both approaches presented the same experience to the end user enabling a PDA to view the same dataset simultaneously with a high-end workstation, each with unique viewpoints. A Java Applet, embedded in a web page, is used on the client. Since issues were encountered with firewalls, web services (SOAP) were used for initial handshakes and then a binary TCP/IP port was required for scene graph or image transmission.
Originating from the ITU-T T.128 standard [ITU 2008], Microsoft Remote Desktop Protocol (RDP) is used to forward complete desktop access from a machine to a remote client, so a remote access mechanism rather than distribution to multiple simultaneous viewers. However, it will remotely forward any application through frame buffer capture - including audio and file system redirection. RemoteFX [Microsoft 2011] is the successor to RDP, using hardware-assisted graphics acceleration for Virtual Desktop Infrastructure (VDI) customers, reaching 15 FPS in interactive tests with 20 Mbps networks [Riverbed 2011]. Virtual Network Computing (VNC) [Richardson et al. 1998] is another screen capture and forwarding system, although this system can be used in a distributed manner by permitting multiple users to log into the same server. Issues arise when multiple users wish to control the remote mouse/keyboard, as there is no locking mechanism or other fine grained security (the server itself, however, can be securely accessed). As for today, VNC continues to be developed, with many variations now available [Wikipedia 2011]. In spite of the success of VNC-like technologies, interactive 3D visualization is extremely difficult because of the low framerate that could be encoded in the “native” VNC protocol. Funded by Sun MicroSystems for their thinClient products, TurboVNC and VirtualGL [Commander 2011] produce high framerates and are real challengers of proprietary software such as IBM DCV/RVN [IBM 2009] and HP Remote Graphics Software (RGS) [HP 2011]. However, HP RGS and its HP3 encoding algorithm seems to stay ahead in terms of performance and image quality [Lohnhardt et al. 2010].
Web support was further developed in the web based postprocessing framework SCOS/V3D. It was developed on two main concepts: the remote sharing of post-processed results (via the transfer of an X3D [Web3D Consortium 2008] data file corresponding to the final virtual reality scene) and communications based on HTTP to bypass standard proxy and firewall limitations. ShareX3D [Jourdain et al. 2008] was developed as part of SCOS/V3D to test the possibilities for scientific collaborative visualization tools over HTTP. Visualization tools may not be designed for collaboration, but can support distributed viewing, and limited distributed interaction. For instance, ParaView is a visualization tool, designed on top of the VTK system but extended to support parallel cluster rendering. It has been extended to include JavaScript and Flash support [Jourdain et al. 2010]. ParaViewWeb can be accessed through a web browser over HTTP (negating any firewall issues) as shown in Figure 1 for a transatlantic session on several devices. This approach permits a user to access a rendering cluster from a web page, without collaboration support. The latter could be created with a higherlevel application written in JavaScript.
The Games@Large project [Nave et al. 2008] is investigating the render instruction capture of an application (i.e. game) whilst it is running, and transmitting the commands for remote rendering. The system only sends changes in the scene to the remote client (to reduce bandwidth consumption), and relies on the remote client to render the graphics locally. This results in high frame rates using between 4 to 40Mbit/sec on a local network; if the available bandwidth is insufficient or a GPU is not available on the client, then video encoding is used instead.
A generic means of visualizing data is presented in [Shu et al. 2008], where an ontology is used to abstract away the exact visualization method used to display data in a visual manner. Meta-data is given to the system to define the format of input data, with an ontology used to identify appropriate visualization techniques (e.g. isosurface for a 3D regular sample set, or a 2D graph for a series of 2D coordinates). A portal is presented as the means of accessing the system, enabling it to be accessed from a web browser and abstracting away the various underlying visualization package, which may each implement a subset of the methods in the ontology.
In a related work as part of the MobiThin project [Dhoedt 2010], the captured render data is instead translated into BiFS (Binary Format for Scenes, part of the MPEG-4 standard), and then replayed on a standard MPEG-4 player. Local client interactions are then sent upstream to the encoding server for it to react accordingly, with its onscreen rendering continuously encoded into BiFS for the client to display. An example application is transcoding an X11 display into BiFS for remote interaction. For large graphical changes, VNC encoding was found to be more efficient, whereas for general interaction (such as using a text editor), BiFS was more efficient.
In summary, collaborative systems such as those described above require security and user-level access control. Per-user viewpoints are often a requirement (depending on target application). However, multi-modal support is often left to a third party application (such as video conferencing). It should also be noted that a generic HTTP client hosted in a web browser may not support high-speed binary data transmission, as such generic clients are usually orientated around XML (uncompressed ASCII format data, compared to the requirement of high-speed binary data). The current trend is towards more open interfaces—namely, web access without the restriction shown by specific stand-alone client software or “apps”.
Capturing the local machines scene graph at the API level is also used with OpenGL via utilities such as GLIntercept [Trebilco 2005]. The frame buffer can thus be captured for remote distribution, or the scene graph itself can be captured, by intercepting calls to the OpenGL library as well as the current state of the OpenGL system. This concept was used in Stanford Universitys Chromium Library [Humphreys et al. 2002] to drive DisplayWalls and is currently implemented in commercial products as Techviz
102
XL to display non-parallel OpenGL-based software on DisplayWalls [TechViz 2010].
The game is running and rendering on the remote server, while the user just sends his input data and receives a video stream. OnLive developed a proprietary video compression method that runs in hardware on server side. The decompression time depends on the client platform but OnLive distributes a thin console to decode the stream and to play games on televisions, smartphones and tablet PCs.
The systems reviewed here either capture the pixels of the servers desktop, or they capture the polygons being presented to the rendering hardware. Games@Large (and RAVE from the previous section) switches between scene graph transmission and frame buffer transmission, depending on the clients capabilities. However, no hybrid systems appear to have been published, where sections of the scene graph can be transmitted (for high local interaction rates) whilst less important information is transmitted as a pixel stream.
2.3
The Otoy company has proposed a Remote Cloud Gaming service, using GPUs to directly run their capture software (ORBX) to enable 48 first-person shooting games to run at 60fps on a single 1U server [Waite and Urbach 2010].
Multi-user Online Gaming Environments
The European KUSANAGI project [Eureva 2011] intends to follow the same strategy for gaming and high definition professional visualization. KUSANAGI is supported by major European telco companies, high definition display manufacturers and game companies. Remote rendering is particularly challenging for control room makers, with the requirement to transmit massive resolution imagery in real-time. For example, BARCO provides VNC-like IP tools or hardware encoders like the JP2K accelerator card [Barco 2010]. This supports, with redundancy for high availability, remote collaborative use of realtime 3D applications in different resolution video streams for display on DisplayWalls or operators screens.
Multi-user Online Games can be considered as collaborative applications where the users pursue a game specific objective. Similar to scientific collaborative visualization, gaming requires per-user unique viewpoints, system security and user-level access control otherwise, players/participants would be able to modify other players avatars, their environment, etc. Quality of Services must be supported—as players may be paying to use the system. Finally, scalability is required, depending on the system - from 10s of participants to 10s of thousands. Games often include multi-modal support, such as distribution of matching audio with graphics, and potentially voice conferencing. Such facilities are made possible because the client is domain-specific - extremely so; the client application cannot be used for any other purpose except to play the given game - it cannot view a variety of datasets.
Gaming on demand is also interesting for the game industry because it prevents cheating, software piracy and enables high-end gaming for audiences without high-end desktop PCs—similar desires as collaborative visualization users. With a market of billions of users, it could explain why the mobile telephone and tablet manufacturer HTC has invested $40 million in this sector [HTC 2011].
A research platform for collaborative virtual environments, ISReal [Kapahnke et al. 2010] has been developed which uses XML3D to render the scene directly in a web browser. In addition, object ontologies are used with software agents to control the behaviour of the system—rendered objects. Such objects are then registered against the ontology to enable users and agents to interact with the objects in a meaningful way (for instance: defining an object as being of type “door”). The ontology approach shows promise for assisting a user when interacting with the system.
Peer-to-peer architectures have been used in many collaborative virtual environments, ranging from decade-old systems to latest developments [Alma Mart´ınez et al. 2009]; such systems use localisation to only transmit and update information local (near) to the player/participant. However, peer-to-peer systems seem to only be supported for virtual environments—probably due to their reliance on virtual participant spatial separation to distribute data amongst participants, which may not be a sufficient distribution mechanism for scientific visualization.
Metaverses such as Second Life are a particular type of multi-user virtual environments (MUVE). Their functionality is similar to 3D games, but unlike these they present a seamless and persistent world and do not have predefined goals. Each user is represented as an avatar and can enhance and modify the world based on user-level access control. The frameworks provided by metaverse platforms such as OpenSimulator [OpenSimulator 2011] are also attractive for scientific visualization. Virtual World platforms have been used for collaborative scientific visualization [Lang and Kobilnyk 2009] and for collaborative design [Rosenman et al. 2007].
Video streaming techniques have been shown to be efficient even for highly latency-sensitive applications such as games. These techniques also demonstrate that it is possible to run applications requiring fast resources remotely. Finally it is not necessary to modify the application to run it remotely, which can cause issues as discussed in the next section. All of these features are of importance for collaborative visualization. Nevertheless, gaming on demand does not answer how to integrate collaborative functionality into existing applications and does not allow the use of services from more than one source in the sense of a mashup.
[Bourke 2008] evaluates whether Second Life can be used to support collaborative scientific visualization. Though considering it as an interesting environment satisfying many of the requirements for collaborative visualization, Bourke emphasises limitations such as the low geometric complexity supported and limited interaction capabilities. Second Life was designed as a social game rather than a general-purpose MUVE. However, some of the restrictions could be overcome in more recent platforms for virtual worlds such as Sirikata. Sirikata is extensible, thus that e.g. arbitrary geometry representations can be used. Sirikata is an open-source, extensible platform for virtual worlds, with an example application KataSpace [KataLabs 2011] presenting a shared virtual world in a web browser, by making use of HTML5 and WebGL.
2.4
Integration of Collaborative Visualization into Existing Applications/Processes/ IT
As we saw previously, generic collaborative tools could provide “seamless” integration of collaborative applications on a single notebook or workstation. Such systems are hampered by local security policies on corporate networks (such as software installation, open network access). Several projects and off-the-shelf products have appeared in recent years, filling the gap between the service provided by these powerful tools and the needs of secured integration in the IT architecture of companies.
Another phenomena appeared in gaming is Gaming on Demand— an application of Cloud Computing where games are installed on high performance servers. One of the first and probably the most popular Gaming on Demand provider is OnLive [OnLive 2011].
At the Texas Advanced Computing Center, a web portal is the frontend for the users: they can book a remote, possibly collaborative, visualization session in the easiest and most secure way possible—
103
Collaborative Visualisation Strategy Optimize Business as usual
Embracing the Future
Virtualized and Remote Graphics Approach
Web 2.0 and 3.0 approach
Extend existing software
Image streaming on server side
Remote Streaming Gaming Platforms - OnLive, - OTOY, - ...
Remote Parallel CAE portal - VISUPORTAL with HP RGS, or TurboVNC/Virtual GL JWS plugin
Warning n°1: - Use on LAN recommended, - High bandwith needed, - Sensitive to latency issues
3D Interception on "source" side
Virtualization - RemoteFX,
Web3D Services
Web conferencing - Adobe Connect with Acrobat 9 Extended 3D Capture tool
Remote Imagebased SciViz Web Service
HTML5 + Declarative 3D - Covise-webGL
- ParaviewWeb, - TACC EnVision
Warning n°2: 3D data could be captured on Client side
Warning n°1 applied
Warning n°2 applied
Add a "Gateway"
A neutral 3D publishing format
COLLAVIZ Hub
PLM Collab Tools
- X3D binary-based progressive streams for CAD and SciViz 3D scenes
- AutoDesk NavisWorks, - SIemens TeamCenter - DS Enovia - 3D Live - VCollab/Marechi
Watermarking to the rescue?
Warning n°2 applied
Figure 2: Off-the-shelf Remote Collaborative Visualization service platforms for IT departments
as simple as a customer buying products on a commercial website. The EnviSion system [Johnson et al. 2009] interviews the user to create the whole visualization process before allocating resources and the viz session itself. In the same way, Deutsches Klimarechenzentrum (DKRZ) propose a Web-GUI [DKRZ 2011] to book graphics resources. At the end of the booking process, the name of the cluster node is shown on the resulting web page through which a connection via HP RGS can be established. The user must manually set up the HP RGS client to begin to work on his visualization session.
during asynchronous reviewing sessions [Autodesk 2011]. ENOVIA Live Collaboration [Dassault Systems 2011] proposes not only a complete PLM environment for each project but also the connection for live 3D synchronous reviews. Live synchronous reviews are possible through use of 3DXML, Dassault Systems (DS) Interchange format, with 3DLive Clients developed by DS and IBM [Dassault Systems 2007]. Several external solutions also exist, such as VCollab [VCollab 2010] and RealityLounge [Grooviz 2010] which allow users to work remotely on huge datasets with a proprietary distributed graphics technology for clusters.
The VisuPortal system [Schmutz 2010] was conceived and implemented during the CARRIOCAS project [Audouin et al. 2009] to manage the access to the graphics resources of a giant “test bed” of next-generation HPC architecture design (24 MPixel display hardware with 64 graphics compute nodes). Expanding on previous projects, the VisuPortal workflow lets the user select their preferred output device (local screen or booked facility), the screen transport mechanism and what software to use from a suite of 3D/CAD/scientific visualization packages, from Windows and Linux. The VisuPortal heuristics engine selects an optimal hardware configuration and immediately (or at the time he has decided) the user receives an email, clicks on a link, fills his password and the Java WebStart client of the remote viz solution is downloaded and opens directly on his viz session, ready for use. This has occurred after only 7 mouse clicks—with collaborators ready in 2 clicks and a password.
In summary, web portals are preferred as the means of presenting a guided set of options to an end user to produce his visualization session—removing the requirement of software/hardware expertise to launch these complex applications.
2.5
Common Issues and Challenges
Using current commercial systems as a point of comparison, we examine the methods of visualization transmission shown in Figure 2.This shows warnings and approaches that we will refer to in this section, summarizing common issues and challenges. It can be seen that several approaches exist to enable collaborative tasks within a CAE process. Client-side rendering with video streaming is becoming a mature off-the-shelf technology; this has the advantage that thin clients (such as smart phones, tablet PCs) can handle the video stream due to embedded video decoding hardware. In addition, the actual source data resides on the server rather than transmitted to the client, which might be preferred for security reasons (e.g. distributing medical records or other sensitive data)— transmitting the scene graph enables the polygonal data to be captured post-encryption and processed outside the original application (warning #2). However, server-side solutions reduce interactivity due to latency between local action and receipt of an updated image (due to network delay, video render encode/decode, etc.; warning #1) and are also bandwidth consuming. This has been shown to be surmountable, as demonstrated by the several remote gaming services. Responsiveness of traditional client/server CAE software can also be increased, if the server running the CAE software is connected to the data server (located in the same data center) with
Usability is the key factor which could explain the users interest in this range of integrated system: Envision or ParaViewWeb propose a complete workflow for analysing and visualizing simulation data, including the choice of filters and rendering engine (both cases using VTK). Such systems have high potential for decision-making support. CAD software vendors have adapted their products to the globalization challenge: a company could have design offices or subcontractors all around the world, and the same for manufacturing their final products. All Product Lifecycle Management (PLM) solutions have their dedicated product for synchronous or asynchronous collaboration for remote teams: Autodesk NavisWorks allows engineers to convert their files, share them by emails and annotate the files
104
at least 1GBit/s. This setup can then be accessed remotely by thin clients as shown in [HP 2008], skipping the delay/latency inherited from “internal” data exchange on the public local area network..
Cloud computing has emerged after the initial surge in Grid computing, where the exact location of the compute services is not in a known/static place, instead in a remote cloud of compute devices upon which a service is running on a subset of available resources. The cloud is instead asked for resources, where a service may be hosted. This includes the concept of virtual machines, where a logical (virtual) machine may be sharing a physical host with several other virtual machines—reducing cost of ownership for the service provider. Cloud computing also introduced the on demand aspect where users can now request as many resources as they need, with short notice - and then reducing the resources when they no longer need them (and hence no longer have to pay). Such a pay-per-use approach has formed a successful commercial model, with companies such as Amazon, Google, IBM and Microsoft offering cloud computing services commercially.
Generic Collaborative Visualization Tools provide a quick way to share and distribute the data, through direct frame buffer capture of existing applications, but provide only limited collaborative functionality and no integrated multi-modal support. Systems should be designed from the beginning to be truly collaborative— but legacy systems will still need to be supported (“optimize business as usual”). MUVE platforms fulfil a rich set of collaborative requirements but are seldom generic enough to solve all requirements specific for scientific visualization—such as large data set support and domain-specific functionality. However the French ANR Collaviz project [ANR Collaviz Project 2011] aims to answer these specific needs e.g. by proposing a robust solution to stream binary X3D scenes progressively [Maglo et al. 2010] for the Collaviz framework [Dupont et al. 2010]. When MUVE applications eventually move into the browser, no additional software will be needed and the visualization part can be combined with other collaborative modalities such as document editing and video conferencing (“embracing the future”).
Amazon has recently introduced GPGPUs [Amazon 2010] into its Elastic Compute Cloud (EC2) offering. Users can (on-demand) request high-end rendering hardware over the web, enabling a rendering cluster to be created on-demand - such as leasing additional GPGPU nodes when the demand for local hardware exceeds its capability. Suddenly, you can expand your rendering power without requiring a large investment in hardware, and also downscale your server if you no longer need such a large system.
”The nice thing about standards is that you have so many to choose from.”
In addition to the advent of pay-per-use/on-demand computing power, the form factors of workstations are changing. The compute power of a modern mobile phone is a dual-core 1GHz CPU [Gwennap 2010]; this device has more compute power than that of a multimillion dollar Cray Y-MP C90 supercomputer [Cray Inc. 2010] from the late 1980s. Similar processing power is contained in new wave of lightweight tablet computers following the introduction of the Apple iPad, after tablet computers almost vanished from the market (see [Microsoft 2002]). The advent of touch-screens (rather that a radio frequency-based digitizing stylus) has changed the accessibility of such devices—they are no longer seen as a quirky object, but now a ubiquitous user interface on consumer devices.
This quote from Andrew S. Tanenbaum is highly applicable to the area of distributed graphics and related technologies. The SC4/TC184 Consortium has led a call for technology in 2009 to define which formats could be considered as standardized enough to publish Step files for collaborative review purposes. [SC4 Visualization Ad Hoc Group 2009] notices, that among all these standards the XML-based format look promising for the future, even if CAD native formats seem very efficient. Many studies [Hartman 2009; Hartman and Lim 2008] show that the quest for a neutral and interoperable format could appear vain as each standard format was built for a specific purpose. Their extension and/or reuse could be truly considered as very difficult. New approaches are studied, such as processing scene graphs of different formats through an adaptive architecture [Rozenn Bouville Berthelot and Arnaldi 2008], where formats are analyzed to wrap the data into a common scenegraph (“a neutral publishing format”).
Multi-touch interfaces present a natural interface which makes such a device accessible to non-technically minded people—the QWERTY keyboard has gone, the WIMP has gone—to be replaced by media activated by touch. Form factor (slim device, balanced mass, lightweight) and battery life (several days worth of use) similarly increase the accessibility of these platforms. Such touch-screen devices are described as being used for mobile internet browsing as much as mobile phones, with 50% of Fortune 100 companies contemplating using iPads for commercial use [Elding 2010]. Such an easily accessible device is becoming ubiquitousbe it an Apple iPad or an Android based tablet.
With regard to XML formats, the W3C is working to provide new compression schemes for Efficient XML Interchange (EXI) [W3C 2011a]. The Web3D Consortium has proposed X3Db, a binary version of X3D. X3Db uses Fast Infoset algorithms [ISO 2007] to compress the X3D XML ASCII encoded files by a factor of 10. Even compressed, 3D content could be intercepted on the client side (warning #2); methods such as watermarking algorithms are under active research [Wang et al. 2010] to avoid this risk.
3
3.2
Home networks utilising ADSL technology, such as ADSL 2+ (ITU standard G.992.5 [ITU 2009]), can now reach up to 24Mbit/s download speed—considering that the maximum bitrate that an H.264 / MPEG-4 decoder can process is 20Mbit/sec (1920x1080 @ 30fps) [DivX 2010], high quality streaming of full high-definition video is now possible—especially since perfectly acceptable video can be streamed using around 6Mbit/sec.
Technology Trends
This section examines the current trends in related technology, looking at how they impact on remote / collaborative visualization.
3.1
Network Trends
Trend in Hardware Platforms
The Grid computing concept emerged around 2004, comparing compute power to electricity, where you may just plug into the compute grid to obtain compute power without the complexity of access currently associated with HPC systems (such as needing an account on each machine). The initial design of distributed, batchprocessing on the Grid was then extended into Grid Services and Web Services (as used by RAVE, for example).
Current third generation (3G) mobile telephone networks (such as High Speed Downlink Packet Access variants) support up to 21Mbit/sec download rates [Ericsson 2009] enabling mobile streaming of video. 3G is rapidly being replaced with so-called fourth generation (4G) systems such as Long Term Evolution (LTE) with up to 160Mbit/sec download rates. In comparison, general WiFi (such as 802.11n, superceding earlier 802.11a/b/g networks)
105
have a theoretical limit of 600Mbit/sec (with multiple simultaneous streams) [AirMagnet 2008].
Although WebGL enables 3D capabilities in the Browser, it has also some drawbacks; it does not answer the question “How is the data delivered to the client?”. All works mentioned above use domainspecific data structures[Niebling et al. 2010] or those provided by a JavaScript library above the WebGL layer. Working with structured data on a higher abstraction layer (i.e with a scene graph) means that the rendering logic has to be implemented in JavaScript. Though the performance of JavaScript has significantly increased over the past few years, the renderer logic will still take a large proportion of the available CPU time. This portion of CPU time is then not available for the application, especially on mobile devices with restricted CPU resources.
The latest generations of networks (3G/4G) can hence support mobile visualization with full video and audio streaming capabilities, enabling local consumption of remote resources. Access to data is no longer constrained to wired connectivity, or even basic WiFi technology; mobile telephony is now sufficient to host such services.
3.3
Web Browser Trends
With the advent of XMLHttpRequest, which allows the access of new data from the server within a web page, the migration of classical desktop applications to the web finally took off. Most of the features of HTML5, such as video and audio support, File API, and client-side-storage are introduced to support this trend. These techniques have also helped to extend classical single user tasks with collaborative functionality. Examples are documentation (e.g. Wikipedia), document editing (e.g. Google docs) and Instant Messaging in the browser.
WebGL does not define how and in which format the data is transferred to the client—it has to be defined for each application. This makes it hard to use or extend standard collaboration frameworks for 3D graphics. Last but not least the functionality of WebGL is fixed to OpenGL ES 2.0 from 2007. New features of recent hardware of interest to CAE cannot be used; high performance GPU are restricted to an API designed for embedded systems. Two declarative approaches based on the browsers Document Object Model (DOM) are X3DOM [Behr et al. 2010] and XML3D [Sons et al. 2010]. Both approaches can leverage the recent WebGL capabilities to render the scene that is described in the DOM into a HTML5 canvas. X3DOM tries to fit the ISO graphics standard X3D into the DOM by streamlining many of its concepts. Above that, it adds support for certain HTML elements, DOM Events, and CSS profiles such as CSS3 3D Transforms [W3C 2009]. It also offers a fallback model, using a X3D plug-in if available, other 3D capabilities such as WebGL otherwise. In comparison, XML3D is instead developed as an extension to HTML5 to describe 3D graphics. It focuses on providing only concepts that they already known from HTML and CSS and introduces new concepts only where necessary. It tries to leverage the available hardware using compiler technologies [Karrenberg et al. 2010] along with an integrated data flow mechanism.
Web Applications have major benefits compared to desktop applications. Browsers are available for all mainstream platforms including mobile devices and Tablet PCs. It is easy to adapt the presentation to the target media. The deployment of Web Applications is easy, in particular they do not require the user to install or update software other than the browser. Vendors can deploy and distribute their own software instantly and worldwide—without the reliance on a sales/distribution network. Additionally Collaborative Web Applications benefit from the rich set of networking features. Besides the mentioned XMLHttpRequest, the WebSockets API [W3C 2011b] is a W3C draft specification and allows bi-directional full-duplex communication and will eventually substitute models like Comet for bi-directional communication via XMLHttpRequest. Nevertheless, these networking capabilities still suffer from the lack of a fine grained security model as described in [Taivalsaari 2009].
Having 3D objects as first level elements in the DOM is advantageous, as it is a well-known data structure. Many frameworks exist to manipulate the DOM from client and server side and even DOM events can be used as protocol to synchronize scenes as shown in [Lowet and Goergen 2009].
Beyond networking capabilities, collaborative Web Applications can benefit from a range of existing frameworks that implement essential features such as session management, rights management and concurrent editing of a data model. Video conferencing as an additional modality is currently only possible using RIA plugins such as Adobe Flash or Microsoft Silverlight. This could change in the short term, if the Media Capture API [W3C 2010] becomes available in browsers.
4
Future Collaborative Visualization Platforms
Given the ubiquity of internet access (over local WiFi or mobile telephony) at bandwidths which can support streaming video, we see that mobile access of high-end visualization is now possible and poised to improve. Mobile handsets / tablet computers have now reached sufficient compute power to render complex scenes locally, or to be able to marshal and decode video at sufficient quality and rates to be comparable with that of direct rendering on a desktop machine.
Due to the missing 3D and video capabilities of web browsers, their usage as a collaborative platform for 3D visualization was limited. With the advent of video capabilities in Flash and HTML5, serverside 3D rendering became available. The recently released WebGL [Khronos 2011] specification allows browsers to use OpenGL ES 2.0 [Khronos 2007] via JavaScript through the canvas Element. Google Chrome 9 is the only non-beta browser to support WebGL but it’s expected to appear in the next major releases of Apple Safari, Firefox, and Opera. There are previews for WebGL browsers on the Android platform.
The combination of Cloud Computing with such mobile bandwidth shows that remote rendering of even the most complex datasets is now achievable without a large investment in infrastructure even on mobile devices. This suggests that the future will lie with lightweight hand-held computing being used on-site, on-demand to visualize data rather than remaining at a desk and visually preparing in advance. Data can be taken everywhere, rendered on demand and shared with colleagues—all via mobile network links.
WebGL has already been used for scientific visualization [Callieri et al. 2010] and science education [Google Labs 2010; Belmonte 2011]. As mentioned above, WebGL has already been used for collaborative scientific visualization in [Niebling et al. 2010]. Although these applications are demonstrators rather than fully qualified products, considering they were all developed before the recent final release of the WebGL specification, results are already promising.
To further the cause of collaborative visualization, the client applications must not require a specific install, or be restricted to a specific platform. Restriction of this nature reduces take-up, due to
106
basic technical issues such as firewall limitations, local site software restrictions, variations in available hardware, etc. If an application uses existing standards (such as HTTPS) for data transport, then the data will reach the clients screen without any issue. Furthermore, if native support can be used in the clients web browser, no local installation is required. Leveraging the latest WebGL standard (now being supported in most major browsers) and HTML5 extensions (such as video objects), a fully-fledged collaborative visualization package can be completely presented in the web browser. This enables remote working (on site, or at a remote desk)—especially of use when wishing to present results to clients in their offices; firewalls, software installation restrictions and variation in hardware would otherwise prevent a client viewing the same dataset.
We predict that given the availability of visualization ontologies, compute power on-demand and web browser rendering integration that a true collaborative visualization service will now finally happen.
Acknowledgements This work has been founded by French National Research Agency (ANR) through COSINUS Program (project Collaviz ANR-08COSI-003). The authors would like to thank the TERATEC association and the partners of the ANR Collaviz Project.
References
If visualization is carried out within the web browser, then it can become regarded as a commodity application—a widget to be pulled in to perform a task, alongside other collaborative tools, such as video conferencing, shared document editing, etc. We imagine a fully collaborative toolset akin to Google Docs [Google 2011], but going beyond basic text and 2D drawing; instead, an instantly shared application, with remote rendering support for complex data. Such an application would require research to make better use of remote rendering capabilities—at present, a single image is generated in isolation, rather than scalably recycling the scene graph processing as far as possible to reduce repeated work. Approaches such as Lumigraph / LightField rendering (e.g. [Okamoto et al. 2009]) may be beneficial, where rendered results are recycled.
A IR M AGNET. 2008. 802.11n Primer. Tech. rep., Aug. http://www.airmagnet.com/assets/ whitepaper/WP-802.11nPrimer.pdf. A LMA M ART´I NEZ , G., H E´ CTOR O ROZCO , A., F E´ LIX R AMOS , C., AND S ILLER , M. 2009. A peer-to-peer architecture for real-time distributed visualization of 3d collaborative virtual environments. In Proceedings of the 2009 13th IEEE/ACM International Symposium on Distributed Simulation and Real Time Applications, IEEE Computer Society, Washington, DC, USA, DS-RT ’09, 251–254. A MAZON, 2010. Amazon Elastic Compute Cloud (EC2): High Performance Computing. http://aws.amazon.com/ec2/ hpc-applications/.
To reduce reliance on bandwidth, such clients should attempt to make maximum use of local client resources, which should increase local interactivity rates and reduce server load. Systems tend to either stream the entire rendered image or transmit the entire scene graph; a hybrid system could transmit (at low rate) the background objects as a video feed, whilst rendering details near the viewer using the clients rendering resources.
5
ANR C OLLAVIZ P ROJECT, 2011. collaviz.org.
Collaviz.
http://www.
AUDOUIN , O., BARTH , D., G AGNAIRE , M., M OUTON , C., V ICAT-B LANC P RIMET, P., RODRIGUES , D., T HUAL , L., AND V ERCH E` RE , D. 2009. Carriocas project: Towards converged internet infrastructures supporting high performance distributed applications. J. Lightwave Technol. 27, 12 (Jun), 1928–1940.
Conclusion
We reviewed a selection of recent approaches to enable collaborative work on visual data sets. Some approaches leverage new on demand computing, networking and video streaming facilities, whereas the application itself is still monolithic. Other examined approaches use recent browser technology and increased client capabilities to produce client-side visualization. However, only a few systems use hybrid client/server rendering approaches; whereas classical server/client approaches seem to dominate over P2P architectures. No approaches have been found, where applications from separate vendors could be used simultaneously on a shared data set, probably due to the lack of common data formats and protocols.
AUTODESK, 2011. Coordinated, complete control. http://images.autodesk.com/adsk/files/ autodesk_navisworks_2011_brochure.pdf. BARCO, 2010. TransForm N – Universal visualization platform. http://www.barco.com/en/product/2169I. B EHR , J., J UNG , Y., K EIL , J., D REVENSEK , T., Z OELLNER , M., E SCHLER , P., AND F ELLNER , D. 2010. A scalable architecture for the html5/x3d integration model x3dom. In Proceedings of the 15th International Conference on Web 3D Technology, ACM, New York, NY, USA, Web3D ’10, 185–194.
The rapid increase in performance of mobile communications and devices reveals the potential for visualization hosted natively in a mobile web browser—without custom software installation, using ontologies for data interchange. The availability of graphics hardware in the cloud and its use for real-time game rendering highlights the potential for visualization as a service. For future collaborative visualization platforms we propose an open web-based architecture that allows transparent use of server-sided, client-sided or mixed rendering.
B ELMONTE , N. G., 2011. PhiloGL - Temperature Anomalies. http://senchalabs.github.com/philogl/ PhiloGL/examples/temperatureAnomalies/. B OURKE , P., 2008. Evaluating Second Life as a tool for collaborative scientific visualisation. C ALLIERI , M., A NDREI , R. M., D I B ENEDETTO , M., Z OPP E` , M., AND S COPIGNO , R. 2010. Visualization methods for molecular studies on the web platform. In Proceedings of the 15th International Conference on Web 3D Technology, ACM, New York, NY, USA, Web3D ’10, 117–126.
Visualization being a service, a company could provide a data stream, another an analysis / processing tool, and another a presentation service, forming a full visualization pipeline—all charged per use via computing-on-demand in the cloud, or hosted on a companys in-house system at lower cost. Hybrid visualization applications (Mashups) could then be produced from multiple services/sources, following the trend of Web 2.0 service use (as has occurred in other business processes such as enterprise resource planning).
C OMMANDER , D., 2011. The VirtualGL Project - 3D without Boundaries. http://virtualgl.org/. C RAY I NC ., 2010. Cray Timeline, Dec. http://www.cray. com/Assets/PDF/about/CrayTimeline.pdf.
107
DASSAULT S YSTEMS, 2007. IBM and Dassault Systems launch 3DLive for Online 3D Collaborative Intelligence. http://www.3ds.com/company/news-media/ press-releases-detail/release/-94cf2faf1d/ single/1487/?cHash=449b3a2d32.
HP, 2008. Whitepaper – A Case Study Comparing Data Access Methods Using Remote Graphics Software and Siemens PLM Softwares Teamcenter 2007 and NX 5. http://newsletter.plmworld.org/Vol7No3/ pc-RGS-Whitepaper.pdf.
DASSAULT S YSTEMS, 2011. ENOVIA – Collaborative Product Lifecycle Management. http://www.3ds.com/ products/enovia/welcome/.
HP, 2011. HP Remote Graphics System. //h20331.www2.hp.com/hpsub/cache/ 286504-0-0-225-121.html.
D HOEDT, B., 2010. Mobithin d5.7 phase ii experimental validation lab trials, June. http://www.mobithin.eu/ documents/MobiThin_D5.7_WP5__30June2010_ IBBT_V1.0.pdf.
HTC, 2011. HTC announces partnership and strategic investment with OnLive. http://www.htc.com/us/press/. H UMPHREYS , G., H OUSTON , M., N G , R., F RANK , R., A H ERN , S., K IRCHNER , P. D., AND K LOSOWSKI , J. T. 2002. Chromium: a stream-processing framework for interactive rendering on clusters. In Proceedings of the 29th annual conference on Computer graphics and interactive techniques, ACM, New York, NY, USA, SIGGRAPH ’02, 693–702.
D IV X, 2010. DivX Plus HD. http://www.divx.com/ files/DivX_Plus_HD_Brochure.pdf/. DKRZ, 2011. Web-GUI and Reservation System – Visualization Server. http://www.dkrz.de/dkrz/services/vis/ visserv01.
IBM, 2009. IBM Deep Computing Visualization. http://www.ibm.com/servers/deepcomputing/ visualization/.
D UPONT, F., D UVAL , T., F LEURY, C., F OREST, J., G OURAN ´ , G., AND TON , V., L ANDO , P., L AURENT, T., L AVOU E S CHMUTZ , A. 2010. Collaborative scientific visualization: The COLLAVIZ framework. In Proceedings of Joint Virtual Reality Conference of EuroVR - EGVE - VEC.
ISO, 2007. Generic Applications of ASN.1: Fast Infoset. ISO/IEC 24824-1. http://www.iso.org/iso/iso_ catalogue/catalogue_tc/catalogue_detail. htm?csnumber=41327.
E LDING , R. 2010. The Apple iPad: Trends and Statistics. Tech. rep., Sept. http:// www.yudu.com/item/details/212676/ The-Apple-iPad--Trends-and-Statistics.
ITU, 2008. Multipoint application sharing. ITU-T T.128. http: //www.itu.int/rec/T-REC-T.128. ITU, 2009. Asymmetric digital subscriber line (ADSL) transceivers extended bandwidth ADSL2 (ADSL2plus). ITU G.992.5, Jan.
E RICSSON. 2009. HSPA, the undisputed choice for mobile broadband. Tech. rep., Feb. http://www1.ericsson. com/news/090201_hspa_and_mobile_Broadband_ 254740099_c. E UREVA, 2011. The KUSANAGI Project. kusanagi.eu/default.htm.
G OOGLE, 2011. com/.
Google Docs.
J OHNSON , G. P., M OCK , S. A., W ESTING , B. M., AND J OHN SON , G. S. 2009. Envision: A web-based tool for scientific visualization. In Proceedings of the 2009 9th IEEE/ACM International Symposium on Cluster Computing and the Grid, IEEE Computer Society, Washington, DC, USA, CCGRID ’09, 603– 608.
http://www.
G OOGLE L ABS, 2010. Google body browser. bodybrowser.googlelabs.com/.
http:
http://
https://docs.google.
J OURDAIN , S., F OREST, J., M OUTON , C., N OUAILHAS , B., M O NIOT, G., KOLB , F., C HABRIDON , S., S IMATIC , M., A BID , Z., AND M ALLET, L. 2008. Sharex3d, a scientific collaborative 3d viewer over http. In Proceedings of the 13th international symposium on 3D web technology, ACM, New York, NY, USA, Web3D ’08, 35–41.
G RIMSTEAD , I. J., WALKER , D. W., AND AVIS , N. J. 2005. Collaborative Visualization: A Review and Taxonomy. In 9-th IEEE International Symposium on Distributed Simulation and Real Time Applications.
J OURDAIN , S., AYACHIT, U., AND G EVECI , B. 2010. ParaViewWeb, A web framework for 3D Visualization and Data Processing.
G RIMSTEAD , I. J., AVIS , N. J., AND WALKER , D. W. 2009. Rave: the resource-aware visualization environment. Concurrency and Computation: Practice and Experience 21, 4, 415– 448. G ROOVIZ, 2010. Visualization driving productivity. http:// www.grooviz.com/. G WENNAP, L. 2010. Linley Report on Dual-Core Snapdragon. Microprocessor Report (July). http: //www.qualcomm.com/documents/files/ rapport-linley-sur-snapdragon-biprocesseur\ ---.pdf. H ARTMAN , N. W., AND L IM , A. 2008. Examining neutral formats for visualization and data exchange. In Proceedings of The 2008 IAJC-IJME International Conference.
K APAHNKE , P., L IEDTKE , P., N ESBIGALL , S., WARWAS , S., AND K LUSCH , M. 2010. ISReal: An Open Platform for Semantic-Based 3D Simulations in the 3D Internet. In The Semantic Web - ISWC 2010: 9th International Semantic Web Conference, Shanghai, China, Revised Selected Papers, Part II. 161– 176. K ARRENBERG , R., RUBINSTEIN , D., S LUSALLEK , P., AND H ACK , S. 2010. Anysl: Efficient and portable shading for ray tracing. In Proceedings of the Conference on High Performance Graphics. K ATA L ABS, 2011. Kataspace. http://www.sirikata.com/ blog/?p=184.
H ARTMAN , N. W. 2009. Evaluating lightweight 3D graphics formats for product visualization and data exchange. Journal of Applied Science & Engineering Technology (JASET).
K HRONOS, 2007. OpenGL ES 2.0. http://www.khronos. org/opengles/.
108
K HRONOS, 2011. WebGL Specification Version 1.0. https:// www.khronos.org/registry/webgl/specs/1.0/.
SC4 V ISUALIZATION A D H OC G ROUP, 2009. Report on Visualisation Candidate Format Assessment, SC4 57th Plenary Meeting Parksville, BC, Canada. http://ng.tc184-sc4.org/index.cfm?PID= 80&BID=9&FileID=60019&FID=55271.
L ANG , A., AND KOBILNYK , D. 2009. Visualizing atomic orbitals using second life. Journal of Virtual Worlds Research 2, 1. L OHNHARDT, B., H EPPNER , S., D ICKMANN , F., K ASPAR , M., Q UADE , M., S KROWNY, D., K EPPER , N., K REFTING , D., S TEINKE , T., AND S AX , U. 2010. Evaluation of visualization approaches in a biomedical grid environment. e-Science Workshops, IEEE International Conference on 0, 80–85.
S CHMUTZ , A. 2010. Impact of high performance computing. In Economics and Technologies for Inter-Carrier Services, 1st Workshop, Economics and Technologies for Inter-Carrier Services, 71–77. S HU , G., AVIS , N. J., AND R ANA , O. F. 2008. Bringing semantics to visualization services. Advances in Engineering Software 39, 6, 514–520.
L OWET, D., AND G OERGEN , D. 2009. Co-browsing dynamic web pages. In Proceedings of the 18th international conference on World wide web, ACM, New York, NY, USA, WWW ’09, 941–950.
S ONS , K., K LEIN , F., RUBINSTEIN , D., B YELOZYOROV, S., AND S LUSALLEK , P. 2010. XML3D: Interactive 3D graphics for the web. In Proceedings of the 15th International Conference on Web 3D Technology, ACM, New York, NY, USA, Web3D ’10, 175–184.
M AGLO , A., L EE , H., L AVOU E´ , G., M OUTON , C., H UDELOT, C., AND D UPONT, F. 2010. Remote scientific visualization of progressive 3D meshes with X3D. In Proceedings of the 15th International Conference on Web 3D Technology, ACM, New York, NY, USA, Web3D ’10, 109–116.
TAIVALSAARI , A. 2009. Mashware: the future of web applications. Tech. rep., Mountain View, CA, USA. http://labs.oracle.com/techrep/2009/ smli_tr-2009-181.pdf.
M ICROSOFT, 2002. Windows XP Tablet Edition. http://www.microsoft.com/windowsxp/using/ tabletpc/default.mspx.
T ECH V IZ, 2010. TechViz XL and Fusion. techviz.net.
M ICROSOFT, 2011. The RemoteFX ships products today. http://blogs.technet.com/ b/windowsserver/archive/2011/02/22/ industry-support-surrounding-remotefx.aspx.
http://www.
T REBILCO , D., 2005. GLIntercept v0.5. VC OLLAB, 2010. Marechi, May. http://marechi.com/.
NAVE , I., DAVID , H., S HANI , A., T ZRUYA , Y., L AIKARI , A., E ISERT, P., AND F ECHTELER , P. 2008. Games@large graphics streaming architecture. In Consumer Electronics, 2008. ISCE 2008. IEEE International Symposium on, 1 –4.
W3C, 2009. CSS 3D Transforms Module Level 3. http://www. w3.org/TR/css3-3d-transforms/.
N IEBLING , F., KOPECKI , A., AND B ECKER , M. 2010. Collaborative steering and post-processing of simulations on hpc resources: everyone, anyti anywhere. In Proceedings of the 15th International Conference on Web 3D Technology, ACM, New York, NY, USA, Web3D ’10, 101–108.
W3C, 2011. Efficient XML Interchange (EXI). http://www. w3.org/TR/exi/.
O KAMOTO , Y., O ISHI , T., AND I KEUCHI , K. 2009. Image-based network rendering system for large sized meshes. In Computer Vision Workshops (ICCV Workshops), 2009 IEEE 12th International Conference on, 931 –938.
WAITE , S., AND U RBACH , J., 2010. Thought Leader Interview with Jules Urbach, Founder & CEO OTOY. http:// www.research2zero.com/Resources/Documents/ R2%20Thought%20Leader%20Interview%20OTOY% 20Sept%202010.pdf.
W3C, 2010. Media Capture API. http://dev.w3.org/ 2009/dap/camera/Overview-API.
W3C, 2011. WebSockets API. http://dev.w3.org/html5/ websockets/.
O N L IVE, 2011. OnLive. http://www.onlive.com/. O PEN S IMULATOR, 2011. //opensimulator.org.
OpenSimulator.
WANG , K., L AVOU , G., D ENIS , F., AND BASKURT , A. 2010. Advanced Techniques in Multimedia Watermarking: Image, Video and Audio Applications. IGI Global, Apr., ch. Blind watermarking of three-dimensional meshes: Review, recent advances and future opportunities, 200–227.
http:
R ICHARDSON , T., S TAFFORD -F RASER , Q., W OOD , K., AND H OPPER , A. 1998. Virtual network computing. Internet Computing, IEEE 2, 1 (01), 33 –38.
W EB 3D C ONSORTIUM, 2008. ISO/IEC 19775-1.2:2008, Extensible 3D (X3D). http://www.web3d.org/x3d/ specifications/.
R IVERBED, 2011. Delivering local-like performance for remotefx over the wan. http://blog.riverbed.com/2011/02/delivering-locallike-performance-for-remotefx.html.
W IKIPEDIA, 2011. Comparison of Remote Desktop Software. http://en.wikipedia.org/wiki/Comparison_ of_remote_desktop_software.
ROSENMAN , M., S MITH , G., M AHER , M., D ING , L., AND M ARCHANT, D. 2007. Multidisciplinary collaborative design in virtual environments. Automation in Construction 16, 1, 37 – 44. CAAD Futures, 2005.
¨ ¨ W OSSNER , U., S CHULZE -D OBOLD , J., WALZ , S., AND L ANG , U. 2002. Evaluation of a Collaborative Volume Rendering Application in a Distributed Virtual Environment. In Proceedings of the 8th Eurographics Workshop on Virtual Environments (EGVE), 113–122.
ROZENN B OUVILLE B ERTHELOT, J EROME ROYAN , T. D., AND A RNALDI , B. 2008. Enabling Interoperability between 3D formats through a generic architecture. In International Conference on Artificial Reality and Telexistence 2010, University of South Australia, Adelaide, AU.
109
110