Shrinivas Pundlik, Matteo Tomasi, Gang Luo ... collision point, and TTC, can give us the degree of ... we estimate sparse optical flow by tracking feature points.
2013 IEEE Conference on Computer Vision and Pattern Recognition Workshops
Collision Detection for Visually Impaired from a Body-Mounted Camera Shrinivas Pundlik, Matteo Tomasi, Gang Luo Schepens Eye Research Institute, Mass. Eye and Ear Harvard Medical School, Boston, MA {shrinivas_pundlik, matteo_tomasi, gang_luo}@meei.harvard.edu
mounted camera and a gyroscope that can predict and issue warnings about impending collisions while walking under normal circumstances. As a conventional mobility aid, long canes have been used by blind people for more than a thousand years. The spatial information about the obstacles can be readily acquired by the canes. These are extensively used among both visually impaired and blind people, and are considered reliable, affordable and convenient. To be acceptable for targeted users, electronic mobility assistance devices should either work more effectively than the long canes, or supplement canes by detecting high level obstacles and those beyond reach of canes. A large number of electronic mobility enhancement approaches for the patients rely on the concept of obstacle detection, instead of collision detection. Using sonar [4], laser range finders [5], or stereo cameras [6, 7], many of these existing approaches detect the distances to the scene objects, and convey this information to the patients via auditory or tactile cues. Such an approach can overwhelm the users with excessive information. Furthermore, not all nearby objects in the scene are actually obstacles. Indeed, objects which should be considered are those posing a collision threat based on the trajectory of the patients. Long canes tend to have limited range and cannot effectively deal with dynamic obstacles. Hence, detecting collisions rather than obstacles can be more useful for walking as it takes into account the dynamic nature of the problem. Collision detection from a single camera also finds applications in areas related to autonomous navigation of robotic platforms [8], or collision warning in intelligent vehicles [9, 10]. Typically, such approaches rely on calculating the time-to-collision, or time-to-contact (TTC) to an object in the world. TTC based collision detection approaches tend to be efficient and easier to implement as compared to stereo camera or range sensor based solutions. Time to collision can be obtained directly from video data; for example, by computing the object scale change in the image [11], based on image spatial and temporal derivatives [12, 13], or by scale invariant feature matching [14]. While sharing some common principles with robotic or vehicular platforms, the problem of
Abstract A real-time collision detection system using a bodymounted camera is developed for visually impaired and blind people. The system computes sparse optical flow in the acquired videos, compensates for camera self-rotation using external gyro-sensor, and estimates collision risk in local image regions based on the motion estimates. Experimental results for a variety of scenarios involving static and dynamic obstacles are shown in terms of timeto-collision and obstacle localization in test videos. The proposed approach is successful in estimating collision risk for head-on obstacles as well as obstacles that are close to the walking paths of the user. An end-to-end collision warning system based on inputs from a video camera as well as a gyro-sensor has been implemented on a generic laptop and on an embedded OMAP-3 compatible platform. The proposed embedded system represents a valuable contribution toward the development of a portable vision aid for visually impaired and blind patients.
1. Introduction With recent advances in mobile computing technologies, mobile devices are increasingly being used for running diverse applications intended for the visually impaired, such as way-finding [1], or text-to-speech converters [2]. One of the potential application areas of mobile technology for visually impaired is related to mobility enhancement aids (or Electronic Travel Aids) [3]. Many of the existing navigation and way-finding tools provide high level navigation information required to travel from one point to another. Despite their utility as a global navigation tool, they seldom provide information about immediate vicinity of the user which is often variable and unpredictable. The main goal of mobility enhancement aids is to allow visually impaired and blind people to walk in real world environment without bumping into the surrounding objects. We present an approach for detecting collisions from a single, body978-0-7695-4990-3/13 $26.00 © 2013 IEEE DOI 10.1109/CVPRW.2013.11
41
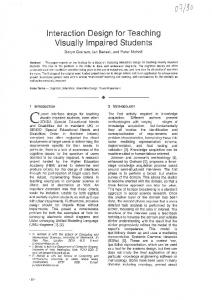
(c) translational motion (b) rotational component (a) tracked features Figure 1: Motion estimation in the acquired images. (a) Overall motion after tracking feature points between two frames of a sequence. (b) The rotational component of the motion obtained from gyro-sensor data. (c) The translational component of the motion after subtracting the rotational motion in (b) from the overall motion in (a).
collision detection from body-mounted camera presents some of its unique challenges ranging from noisy input data to operational constraints due to unpredictable movements. Implicit in the entire process of collision detection from a single camera, is the assumption that the obstacle detection and localization in the scene can be done accurately. Inaccurate obstacle localization can lead to highly erroneous TTC values, which consequently affects the collision prediction performance. Needless to say, explicit scene segmentation and obstacle detection can become extremely challenging in case of a wearable camera system. While collision detection from a single camera is challenging, humans are quite adept at judging collisions, even when they are not using stereo vision [15]. It has been suggested that both the ratio of object expansion and its translational motion are important in collision judgment by human visual system [16]. Rate of expansion of an object is related to the idea of TTC. Faster the object expands over time, smaller the TTC and vice versa. The translational motion of the object is associated with the collision point on the camera plane. Combining both, the collision point, and TTC, can give us the degree of collision risk at the given moment. Another key idea used here is that the TTC and collision point values can be obtained locally based on image motion. This local computation, which tends to be more robust as compared to a top-down approach, can be aggregated into global estimates of collision risk for a given frame. Furthermore, in our approach neither explicit object segmentation, nor precise shape or area computation is required. This allows us to handle a variety of complex scenarios commonly observed in the real world. Even though our approach requires motion estimates, it can handle noisy images with motion blur and rapid camera movements. In order to deal with the movements of the camera attached to a walking person, we correct the effects of camera rotation using an external gyroscopic sensor.
Owing to the above mentioned insights, we can perform real-time collision detection in different environments using a webcam, gyro-sensor, and a laptop. Our approach is also been optimized for an embedded implementation for OMAP-3 compatible platforms (hardware similar to many popular mobile devices). Experimental results are presented to evaluate the collision detection approach as well as its embedded implementation in various scenarios.
2. Collision Detection Approach At a high level, the basic steps involved in the collision detection algorithm are: motion estimation (including the steps for correcting the camera self-rotation), and determination of collision risk for each frame, which involves computation of local expansion and lateral motion.
2.1. Motion Estimation Motion estimation in the acquired video stream is the first step of our algorithm. For simplicity and efficiency, we estimate sparse optical flow by tracking feature points between consecutive frames [17]. Typically, videos obtained from a moving body-mounted camera are unstable in nature, as the camera undergoes a series of rotations and translations in the 3D world. Its 2D projection on the image (the observed image motion) consists of rotational and translational components. Image motion produced by camera translation is more important from collision detection perspective, since it contains the information regarding object expansion and lateral motion that is used for determining the collision risk. Recovering the translational motion component from the overall motion can make the collision risk computation more robust. With known camera rotation parameters, the rotational flow can be separated from the overall optical flow field, leaving only the motion due to camera translation to be used for further processing. Camera selfrotation can be corrected primarily in two ways: purely
42
based on image information such as Mono-SLAM [18], or using external motion sensors [19]. We use a gyroscopic sensor attached to the camera to measure the angular velocities along its three principal axes. The angular velocity samples corresponding to a pair of consecutive frames are integrated (over a period of time between the two frame captures) to obtain camera angular displacement. From the camera rotation angles, the rotational motion component can be obtained via homography [20] and the motion due to camera translation can thus be recovered. Figure 1 shows an example where sparse optical flow is computed between two frames captured by a moving camera and the rotational and the translational components are obtained from it.
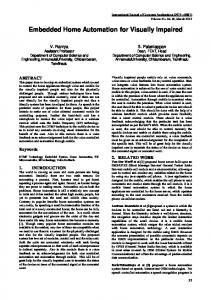
(b) (a) Figure 2: (a) Local expansion computation example. The points in green have positive local expansion values. (b) Lateral translational motion computation. The yellow colored points show lower lateral motion as compared to the blue points.
larger spatial regions in the image. This turns out to be a much faster, but just as effective approach as compared to segmentation of the image region or feature point clustering. The main reason for adopting such an approach is that for our application, highly accurate obstacle localization in the image is not an absolute necessity. For the visually impaired, information regarding the coarse direction of the potential collision threats can be valuable for successfully avoiding the obstacle. Hence, an approximate localization of the collision risks in the image can suffice, given that TTC and collision point estimates are reasonably accurate. In order to obtain the collision risk for a frame, aggregated collision point values in the image regions are evaluated, and the region with high collision point is identified. TTC for the given frame is the average of the local TTC values contained in the spatial region. If the computed collision point and the TTC for the given frame are higher than their preset thresholds (user defined and tunable), then the algorithm outputs positive collision risk for the given frame.
2.2. Collision Risk Estimation Once the motion estimation has been carried out, the next step is to estimate collision risk using local computations. In our approach, two quantities are used to determine the collision risk: TTC (temporal aspect), and collision point (the spatial aspect). In order to perform local computations using the image motion, a local neighborhood is established based on Delaunay triangulation of the tracked point locations. Let pi be the ith feature point detected in the first frame that is tracked to a point qi in the next frame. Overall, there are N tracked feature points for a given pair of frames (i = 0, 1,…, N-1). For every tracked feature point pair (pi, qi), we now have a set of feature points that are their immediate neighbors in the corresponding frames, given by D(pi, qi). As mentioned in [21, 22], the local expansion value for the neighborhood of the ith feature point is given by
ei =
¦(q
− q k − pi − p k
i p k , q k ∈D ( pi , qi )
¦
pi − p k
)
3. System Implementation
.
Using inputs from a video camera and a gyro-sensor, we have implemented the collision detection algorithm on two separate platforms: (i) a generic laptop, and (ii) a Texas Instrument digital media processor DM3730 with OMAP 3 compatible architecture. The laptop based system uses OpenCV library for image acquisition and feature tracking functions. The gyroscope data acquisition must be performed at least at the rate equal to the camera frame rate, but in practice we acquire gyro-sensor data at a much higher rate (200Hz) to improve the accuracy of the angular velocity integration process. In order to take full advantage of the high sensor data rate, angular velocities are acquired in parallel to the image acquisition thread. It should be noted that we integrate the angular velocities only between two successive frames in order to improve the accuracy of angular estimation. Synchronization of the camera with the gyro-sensor can be performed offline by acquiring the
p k , q k ∈D ( p i , q i )
When ei is positive, this means that the local feature point neighborhood for the ith feature point is expanding, otherwise it is shrinking (Figure 2-(a)). Time to collision, computed locally, is inversely related to the local expansion (1/ei). Lateral translational motion for each feature point is the average motion of the entire neighborhood (Figure 2-(b)). Collision point can then be computed locally based on the ratio of scale change and the lateral translational motion. Once the TTC and collision point are computed at local level, they are combined to obtain global collision risk estimation for the given frame. One way to aggregate the information is to cluster the feature points into groups belonging to different objects in the world. However, clustering methods tend to be computationally expensive. We resort to an alternative strategy of aggregating the collision point and TTC values computed locally over
43
data from both sensors in parallel. This determines the delay or offset between the camera and the sensor which tends to be constant for a particular system, and can be accounted for by buffering the image frames. Collision risk is estimated for each acquired frame, and temporal smoothing of the estimates over 3 frames is performed in order to eliminate false alarms. The embedded system runs on DM3730, consisting of 1 GHz ARM Cortex A8 processor and an 800-MHz TMS320C64x+ DSP [23]. Processing in the embedded system proceeds in somewhat similar manner as the laptop based system with some key differences owing to hardware constrains. Image and sensor data acquisition is done in the ARM processor, and the acquired images and the corresponding angular rotation values are sent to the DSP via ARM-DSP shared memory for further processing. Motion estimation is performed in the DSP using VLIB [24] and IMGLIB [25] libraries by Texas Instruments. The output trajectories of the feature points tracked in the DSP using VLIB library are not as accurate as those done on laptop with OpenCV because the DSP performs lower precision fixed point computation. We smooth the output of the feature tracking by performing median filtering on the raw motion vectors in a local neighborhood to obtain smooth motion. Rest of the computation for obtaining collision risk in the DSP is similar to the laptop based computation. Estimates computed in the DSP are sent back to the ARM for performing output processing.
(a) (b) Figure 3: (a) Obstacle course layout along with some snapshots captured while walking through the course. (b) Collision detection results for one of the subjects during a trial. Each image with a circle overlaid on it shows the localization result corresponding to each obstacle.
are positioned along the camera axis. This is an important consideration because obstacles may locate at an offset with respect to the body center, based on the width of the person wearing the camera. Based on the body size of an average person, a safety margin of a little over 1’ was set on each side of the walking trajectory. Hence, objects 1, 2, 3, 5, and 7 were deemed to pose a tangible collision risk. One of the sequences was chosen for tuning the algorithm parameters. Combining the rest of the sequences, there were a total of 25 true obstacles, out of which the algorithm detected 24 obstacles. A risk of collision was detected if a potential obstacle was correctly localized in more than 5 frames in a temporal window of 1 sec. For the given detection rate of 96%, the false alarm rate was 0.8%. False alarm rate was computed by counting the number of frames in all the sequences for which collision warning was given but with a wrong localization or timing. Figure 3-(b) shows collision warning results for one of the trials. Collision warnings are shown as red circles overlaid on the spatial map of the obstacle course along the center line, and the world distances have been mapped to the total time of the trial on the y axis. The collision risk increases as the subject approaches the obstacle. For each potential obstacle, the image region generating the highest collision warnings over a period of 2s when the camera is closest to the obstacle are denoted by circles overlaid on the input image. The figure demonstrates the ability of the algorithm to detect and localize a true collision threat.
4. Experimental Results We present experimental evaluation of our collision detection approach using a controlled obstacle course, followed by the results for sequences captured under more unconstrained scenarios, with moving body-mounted camera. Finally, we show the collision warning results in the case of embedded implementation.
4.1. Obstacle Course Experiment Figure 3-(a) shows the layout of the obstacle course, which consisted of seven stationary obstacles in a room. Two pedestrians, carrying a laptop connected to a camera and a gyroscope walked along a trajectory that was approximately a straight line. For obstacles blocking their walking path, they tried to avoid at the very last moment, and then rejoined the designated center path. Each person repeated the trial three times and the video was recorded in the laptop. One of the main goals of this experiment was to show the ability of our approach to detect the collision risk while walking naturally (with a significant amount of image shaking) in a cluttered environment. When one moves around in a cluttered environment, not all obstacles
44
Sequence 1 Stationary obstaclecollision TTC = 1.99s
TTC = 1.45s
TTC = 0.63s
TTC = 1.62s
Sequence 2 Stationary obstacle no collision TTC -
TTC -
TTC -
TTC -
TTC = 1.97s
TTC = 0.77s
TTC =1.73s
TTC = 0.52s
TTC = 2.33s
TTC = 1.75s
TTC =0.59s
TTC = 1.87s
Sequence 3 Multiple moving obstacles collision
Sequence 4 Nighttime sequence collision
Figure 4: Results of the collision detection algorithm on various real world sequences captured from a camera attached to a moving person. The red circle with a blue center represents the localization of the highest potential collision risk (obtained from the collision point score), and the size of the circle represents the severity of the risk (based on the TTC value). The corresponding time to collision values are shown below the frame where collision risk is detected.
sequence is a minor variation of the first, where the person walks past the hand sanitizer. In this sequence there is no risk of collision. The third sequence shows two potential moving obstacles that pose collision risk. Person with the camera walks very close to two other pedestrians. As seen in the figure, collision risk is detected for both the pedestrians. The last row of Figure 4 shows some frames from an outdoor sequence shot at night (using a low light CCD camera), where the algorithm is successful in estimating the collision risk for a stationary object in spite of high amount of image noise. Videos of the collision detection results for the sequences shown in Figure 4 are available at http://www.youtube.com/watch?v=bIo_11K0hHk. Even though we do not have accurate ground truth TTC values for the sequences shown in Figure 4, it can be seen that the algorithm is successful in processing collision risk for a variety of scenarios. Table I shows details of collision detection statistics for those four test sequences.
4.2. Walking in Natural Environment Figure 4 shows the results of our collision detection approach for a variety of scenarios involving stationary and moving obstacles in different environments. The red circle indicates the localization of the highest potential collision risk, while the size of the circle depicts the risk level (bigger the circle, higher the risk). The radius of the circle is inversely scaled by the minimum time to collision value obtained for that frame (shown below every image in Figure 4). The first row shows a case where a person walks toward a stationary obstacle (hand sanitizer station) in order to simulate a collision, while passing along a hallway surrounded by various objects. The true collision risk in this sequence is the stationary obstacle and it progressively increases as the pedestrian approaches it. The TTC reduces at the very end because the approaching speed of the camera reduces considerably. The second
45
(a) Sequence 1
(c) Sequence 3 (b) Sequence 2 (d) Sequence 4 Figure 5: (Top Row) Plots showing frequency of collision warnings (y-axis) accumulated over a temporal window of 1s for the length of the test sequences. (Bottom Row) TTC values (y-axis) over the length of the sequences. Red points indicate incorrect collision risk detections.
In these sequences, the collision risk is present only for a small duration of the entire sequence. Same parameters were used for processing all the sequences. Figure 5 shows the performance of the algorithm over the entire length of each sequence. The top row shows the frequency of collision detection accumulated over a temporal window of 30 frames. In case of sequence 1 and 4, the collision risk with respect to a single obstacle is visible in the plot, whereas in the case of sequence 3, two peaks are visible indicating the presence of two different obstacles. As compared to other three cases, sequence 2 does not show any tangible collision risk. Bottom row of Figure 5 shows the corresponding TTC estimates produced by the algorithm. The downward trend in the TTC values as well as their increased density on the plot is visible as the camera approaches the obstacles. This is because TTC estimation can be performed more reliably as the camera approaches the obstacle. The algorithm was run using the following parameters: maximum number of feature points = 300, feature selection quality threshold = 0.005, feature window size = 3x3, minimum distance between features = 4 pixels, number of pyramid levels = 1 (pyramidal Lucas-Kanade was not used), and TTC threshold = 3s. The algorithm runs at 20 fps for QVGA images on a laptop with 2.4 GHz Intel core 2 duo processor, and 2 GB of memory using an unoptimized C++ code.
demonstrate our prototype for both static and moving camera in Figure 6. The left panel of the figure is generated from a static camera and a person approaching it with a head-on trajectory. On the right, the camera is moved toward stationary objects. Collision risk is shown as red circle, similar to Figure 4. The embedded collision detection system is successful in predicting collisions by processing QVGA images at the rate of 20 fps. Since the system was designed with an intention of using it as a mobility aid for the visually impaired, we generate an auditory signal whenever the collision risk is higher than a pre-established threshold. The signal consists of a beep that is repeated every frame for which the system detect a collision threat. The temporal frequency of the audio beeps becomes faster as an obstacle approaches and collision risk becomes higher, giving the user a strong warning about impending collision.
Figure 6: Collision estimations provided by the portable embedded prototype. Red circles identify the colliding objects for a static camera scenario, where a person is approaching the camera plane with a head-on trajectory (Left), and moving camera in a collision trajectory with surrounding objects (Right).
TABLE I : COLLISION DETECTION STATISTICS FOR THE TEST SEQUENCES IN Figure 4. Seq. 1 Seq. 2 Seq. 3 Seq. 4 Total frames 392 430 310 320 Correct risk localization 58 57 27 False alarm rate 2.05% 2.56% Earliest warning given 2.45s 2.98s 2.33s
5. Conclusion
4.3. Embedded System for Collision Detection
We have presented a collision detection approach for a body-mounted system that uses a single camera. The proposed approach is based on the motion information in
As described in Section 3, we have also implemented our approach on an OMAP-3 compliant platform. Here we
46
[10] E. Raphael, R. Kiefer, P. Reisman, and G. Hayon. Development of a camera-based forward collision alert System, SAE International, 2011. [11] G. Alenya, A. Negre, and J. L. Crowley. A comparison of three methods for measure of time to contact, IEEE/RSJ Intl. Conf. on Intelligent Robots and Systems, 2009. [12] F. G. Meyer. Time-to-collision from first order models of the motion field. IEEE Trans. on Robotics and Automation, 10(6), 792-798, 1994. [13] B. K. P. Horn, Y. Fang and I. Masaki. Hierarchical framework for direct gradient-based time-to-contact estimation. Intelligent Vehicles Symposium, 2009. [14] A. Negre, C. Braillon, J. L. Crowley, and C. Laugier. Real time time to collision from variation of intrinsic scale. Intl. Symp. on Experimental Robotics. 2006. [15] J. Yan, B. Lorv, H. Li, and H. Sun. Visual processing of the impending collision of a looming object: Time to collision revisited, Journal of Vision, 11(12):7, 1–25, 2011. [16] G. Luo, R. Woods and E. Peli. Collision judgment when using an augmented vision head mounted display device. Investigative Ophthalmology and Visual Science, 50, 45094515, 2009. [17] J. Y. Bouguet. Pyramidal implementation of the lucaskanade feature tracker, Intel Corporation, 2000. [18] A. Davison, N. Molton, I. Reid, and O. Stasse. MonoSLAM: Real-time single camera SLAM, PAMI, 29(6), 2007. [19] F. Woelk, S. Gehrig, and R. Koch. A monocular image based intersection assistant, Intelligent Vehicles, 286 - 291, 2004. [20] R. Hartley and A. Zisserman, Multiple View Geometry, Cambridge University Press, 2000. [21] S. Pundlik, E. Peli and G. Luo. Time to collision and collision risk estimation from local scale and motion, International Symposium of Visual Computing, Springer: Lecture Notes in Computer Science, 6938, 728-737, 2011. [22] S. Pundlik and G. Luo. Collision risk estimation from an uncalibrated moving camera using feature point tracking and clustering. IEEE Conf. on Fuzzy Systems and Knowledge Discovery, 728-737, 2012. [23] Texas Instruments OMAP™ Mobile Processors, http://www.ti.com/general/docs/wtbu/wtbugencontent.tspte mplateId=6123&navigationId=11988&contentId=4638. [24] Texas Instruments, Video Analytics & Vision Library (VLIB), http://www.ti.com/vlibrequest. [25] Texas Instruments, The Image and Video processing Library (IMGLIB), http://www.ti.com/tool/sprc264.
the scene to obtain spatial and temporal components of collision risk. An external gyroscopic sensor is used to compute the camera rotation which is corrected over time to increase robustness of collision detection approach. Our approach does not rely on complex object detection or scene segmentation methods, and can provide collision warnings in real time. The robustness and flexibility of the approach has been shown for a variety of scenarios that involve stationary and moving obstacles, as well as low light and high-noise conditions (i.e. at nighttime). We have also implemented the collision detection approach on an embedded system with similar hardware configuration as that of a mobile device. Due to a small form factor and low power consumption, it can be potentially used as an electronic travel aid that provides collision warnings to the visually impaired and blind people via auditory cues. Future work involves refining collision warnings temporally for better risk estimation, and using positional tracking for better approach evaluation.
Acknowledgements This work was supported by the U. S. Department of Defense grant DM090201.
References [1] B. Tjan, P. Beckmann, R. Roy, N. Giudice, and G. Legge. Digital sign system for indoor wayfinding for the visually impaired, CVPR - Workshops, 30, 2005. [2] A. Nazemi, C. Ortega-Sanchez, and I. Murray. Digital talking book player for the visually impaired using FPGAs, Intl. Conf. on Reconfigurable Computing and FPGAs (ReConFig), 493-496, 2011. [3] D. Dakopoulos and N. Bourbakis. Wearable obstacle avoidance electronic travel aids for blind: a survey. IEEE Transactions on Systems, Man, and Cybernetics, Part C: Applications and Reviews, 40 (1), 25-35, 2010. [4] S. Cardin, D. Thalmann, and F. Vexo. A wearable system for mobility improvement of visually impaired people. Visual Computing, 23(2), 109–118, 2007. [5] D. Yuan and R. Manduchi. Dynamic environment exploration using a virtual white cane, CVPR, (1), 243-249, 2005. [6] K. Lin, T. Lau, C. Cheuk, and Y. Liu. A wearable stereo vision system for visually impaired, IEEE Intl. Conf. on Mechatronics and Automation, 1423-1428, 2012. [7] V. Pradeep, G. Medioni, and J. Weiland. Robot vision for the visually impaired, Computer Vision and Pattern Recognition Workshops (CVPRW), 15-22, 2010. [8] C. McCarthy and N. Barnes. A Unified Strategy for Landing and Docking Using Spherical Flow Divergence, IEEE PAMI, 34(5), 1024-1031, 2012. [9] A. Berthelot, A. Tamke, T. Dang, and G. Breuel. A novel approach for the probabilistic computation of Time-ToCollision, IEEE Intelligent Vehicles Symposium, 2012.
47


![A REFERENCE GUIDE FOR THE BLIND AND VISUALLY- IMPAIRED [PDF]](https://m.moam.info/img/260x300/a-reference-guide-for-the-blind-and-visually-impai_648774c8098a9e71478b4691.jpg)