Linköping University Post Print ... ists like radiologists to a broad range of users of popular public ... paper, especially if you read a black and white print-out!
Linköping University Post Print
Color Emotions for Image Classification and Retrieval
Martin Solli and Reiner Lenz
N.B.: When citing this work, cite the original article.
Original Publication: Martin Solli and Reiner Lenz, Color Emotions for Image Classification and Retrieval, 2008, Proc. IS&Ts 4th European Conference on Colour in Graphics, Imaging, and Vision, CGIV 2008, 367-371. Copyright: Society for Imaging Science and Technology (IS&T) http://www.imaging.org/ Postprint available at: Linköping University Electronic Press http://urn.kb.se/resolve?urn=urn:nbn:se:liu:diva-42582
Color Emotions for Image Classification and Retrieval Martin Solli and Reiner Lenz ¨ Dept. of Science and Technology (ITN), Linkoping University, Sweden
Abstract Many content-based image retrieval systems are not taking into account high level semantic information. In this paper we describe our attempts to include color-based emotion-related properties of images in the search. We show that using color emotion metrics in content-based image retrieval leads to interesting methods for image retrieval and classification based on semantic concepts. The color emotion metric used is derived from psychophysical experiments and uses three scales: activity, weight and heat. It was originally designed for single-color combinations and later extended to include pairs of colors. We show that a modified approach for statistical analysis of color emotions in images, involving transformations of ordinary RGBhistograms, provides a useful tool for image classification and retrieval. The methods used are both very fast in feature extraction, and descriptor vectors are very short. This is essential in our application where we intend to use it for searching huge image databases containing millions or billions of images.
Introduction Image retrieval systems are examples where computer vision and image processing techniques are used to build systems that are used by a wide variety of users ranging from specialists like radiologists to a broad range of users of popular public search engines like Google. However, most of the popular search engines, like Google, are mainly text or keyword based. Others are using features from traditional image processing, and some are specialized to specific tasks like face recognition. Some of these systems are also combining a wide variety of techniques like computer vision, speech recognition and understanding and automatic translation to assist in searching huge video databases (see [1, 2] for some recent developments). Most of these systems are however using objects as their prime descriptors of image content. A typical query could thus be the problem to find all images showing a car or a given person or a scene with a mountain. Popular queries may result in a large number of hits that are impossible for the user to evaluate. New methods that can narrow down the number of hits, or grade the images found, are therefore highly desirable. In this paper we propose to use emotion-related properties of images for that purpose. The natural starting point for such a new type of search criteria is to use color as a bearer of emotional information. The classification methods used focus on positioning images on different scales related to color emotion words. Retrieval is then using color emotion histograms. These are distributions of vectors in the space spanned by the emotion scales. Similarity measurements between histograms are used to obtain images with similar emotional appeal as the query image. Initial experiments with a small database of 5000 images show that color emotion properties are well suited for semantic image classification and retrieval. Methods presented in this paper are utilized in a publicly available image retrieval system1 . We recommend readers to interact with the system while reading this paper, especially if you read a black and white print-out! 1 http://media-vibrance.itn.liu.se/imemo/
CGIV 2008 and MCS’08 Final Program and Proceedings
The paper is organized as follows: In the next section we summarize some of the research on color emotion and semantic image retrieval related to the investigations reported in this paper. In section Color Emotions we present the color emotion metric, which will be used for image retrieval in section Color Emotions for Images. Search results are presented in Results, followed by Conclusions.
Background The topic of this paper is related to two different research areas, color emotions and semantic image retrieval. Color emotions are emotional feelings evoked by either single colors or color combinations. In a series of papers [3, 4, 5] Ou et. al. investigated the relationship between color emotion and color preference. Color emotion models for single-colors and two colorcombinations are derived from psychophysical experiments. In this paper we will use those models as our starting point for the construction of a color emotion-based image retrieval system. In a similar study of human’s emotional responses on colors Gao and Xin [6] identify three indexes they call activity, potency and definition to describe color emotion. One important question is whether color emotions are influenced by different regional or cultural backgrounds. In an extensive study by Gao et. al. [7] it was concluded that the influence of cultural background on color emotions is very limited. Similar results were earlier found in cross-regional comparisons by Xin et. al. [8, 9]. Related to the problem of color emotion is the concept of color harmony. Harmonic color combinations are colors that are said to generate a pleasant effect when seen in neighboring areas. This has been used in computer graphics [10] to beautify images. For our application, fast search methods for very large image databases, the computational cost is too high and the descriptors are too complex to be applicable. To our knowledge no earlier attempts are made to use color emotion metrics for image retrieval. However, some research has been made on retrieval systems using semantic information in color images. Wang and Yu [11] propose an emotional semantic query model based on image color semantic descriptors. By segmentation and clustering, color semantics can be extracted for image regions, leading to a description of image color semantics including a regional and global semantic description. The user is able to query images with emotional semantic words, like ”sad” and ”warm”, and also with more complex sentences. In a paper by Hong and Choi [12] a search scheme they call FMV Indexing is presented. It allows the user to retrieve images based on highlevel semantic concepts, such as ”cool”, ”soft”, ”romantic” etc. Emotion concepts are derived from color values in the HSI color space. Cho and Lee [13] developed an image retrieval system based on human preference and emotion by using an interactive genetic algorithm.
Color Emotions Color emotions can be described as emotional feelings evoked by single colors or color combinations, typically ex-
367
activity = −2.1 + 0.06× "
µ
× (L∗ − 50)2 + (a∗ − 3)2 +
¶ b∗ − 17 2
#1
2
1.4 (1)
weight = −1.8 + 0.04(100 − L∗ ) + 0.45 cos(h − 100◦ ) (2) ∗ 1.07
heat = −0.5 + 0.02(C ) µ ∗¶ b h = arctan ∗ a p C ∗ = a∗ 2 + b ∗ 2
◦
cos(h − 50 )
(3) (4) (5)
L∗ , a∗ and b∗ are CIELAB coordinates, h is CIELAB hue angle and C∗ is CIELAB chroma. For readers not familiar with the CIELAB color space, a detailed description of CIE color spaces can be found in [14]. Ou et. al. conclude that the three factors agree well with studies done by others, for instance Kobayashi [15] and Sato et. al. [16]. Presented color emotion model was not developed for multi-colored images of potentially very complex structure. It is therefore easy to construct images were it will fail. We will, however demonstrate that the results obtained show that these techniques provide useful statistical characterizations for content based image retrieval.
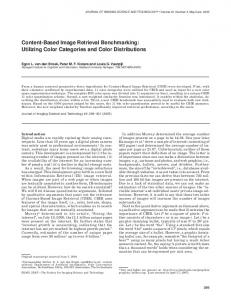
Color Emotions for Images Since the intended usage is retrieval or classification in very large image databases, two special requirements are present. Apart from fast feature extraction, derived features needs to be saved in compact descriptor vectors. Using RGB-histograms for measuring statistical properties of color images is very common in content based image retrieval. We make use of this and propose a method that will transform ordinary RGB-histograms of images to emotion descriptors. Typically the histograms consist of 512 entries with eight quantization levels (bins) per color channel. We collect RGB-histograms for all images in the database and save them in a matrix H of size N × 512 (rows × columns), where N is the number of images in the database. For each bin in the RGB-histogram we calculate the corresponding color emotion vector, using the equations in section Color Emotions. These 512 three-dimensional vectors are collected in the color emotion matrix E of size 512 × 3 (three emotion values for each bin). In Figure 1 the locations of the 512 RGB-bins are shown in the three dimensional space spanned by the three emotion factors. We can observe that although some colors have very different RGB-values they generate similar emotions. Since
368
2.5
< cool - HEAT - warm >
pressed with semantic words, such as ”warm”, ”soft”, ”active”, etc. Color emotions together with color meaning, color harmony, color memory etc., belongs to the cognitive aspects of color. Psychophysical experiments are frequently used for emotional classification of colors or for creating color emotion models that can be used for predicting color emotions. This paper investigates the possible usage of a color emotion model in image retrieval. In a series of papers [3, 4, 5], Ou et. al. investigated the relationship between color emotion and color preference. Color emotion models for single-colors and two color-combinations are derived from psychophysical experiments. Observers were asked to assess single colors on 10 color emotion scales. Then they show that factor analysis can reduce the number of color emotions scales to only three categories, or color emotion factors: activity, weight and heat.
2 1.5 1 0.5 0 0. 5 1 1. 5 2
4 2 0 2
< heavy - WEIGHT - light >
0
2
2
4
6
< passive - ACTIVITY - active >
Figure 1. Location of the bins of the RGB-histogram in the emotion space.
results obtained in this paper will be implemented in a public search engine, we have no control of the users viewing conditions, and are consequently forced to make some assumptions. In all calculations we assume images are saved in the commonly used sRGB color space, and we use the standard illumination D50 when transforming RGB values to CIELAB values.
Retrieval by Emotion Words Multiplying the histogram matrix H with the color emotion matrix E we obtain a matrix C C = H ·E
(6)
of size N × 3. The n-th row in the histogram matrix H describes the probability distribution of the RGB vectors in image n. We denote this row by hn and then we see that the n-th row (denoted by cn ) in the matrix C is obtain by the scalar product cn = hn · E. The vector hn is a probability distribution and cn is thus an expectation vector describing the expected value of the color emotion vectors of the pixels in image number n in the database. This vector contains thus the mean score for each of the emotion factors: activity, weight and heat. In Figure 2, 30 images are plotted according to their emotion coordinates in the three-dimensional emotion space. This figure shows that the emotion coordinates together images of similar emotional impact and we can therefore use the emotion coordinates as search interface. A query is constructed by selecting a position on one, two or three emotion scales (activity, weight and heat). For a given query vector of emotion scores we retrieve the images whose emotion vectors are nearest neighbors of the query vector in the L2 norm.
Retrieval by Query Image Instead of creating a query by selecting values on three emotion scales, the user can submit a query image to obtain images from the database with similar emotional appearance. Since Figure 1 demonstrates that the RGB space is unevenly spaced in emotion space, we try to avoid the problems encountered by using more than a single emotion coordinate. We use a kd-tree decomposition to obtain a more balanced decomposition of the 512 coordinates in the emotion space given by the 512-bins RGB histogram. We split emotion space perpendicular to one of the axes (activity, weight or heat). Cycling through the axes, splitting each new region by the median, the result will be a distribution with equal number of entries in each region, generally called a balanced tree with equal number of entries in each leaf. We continue splitting until we get 64 leaves, each containing 8 entries.
©2008 Society for Imaging Science and Technology
< heavy - WEIGHT - light >
< warm - HEAT - cool >
< warm - HEAT - cool > < passive - ACTIVITY - active >
< light - WEIGHT - heavy >
< passive - ACTIVITY - active >
Figure 2. Three different views of 30 images plotted according to their emotion coordinates in the three-dimensional emotion space.
Color Emotion 2
First split
(7)
Results A test database was created, containing 5000 images. These are randomly selected from a much larger image database used in another project. The test database contains different image categories, both photos and drawings. The first search mode, retrieval by emotion words, is illustrated in Figure 5. A search interface is used, where the query vector is specified with the help of 1-3 sliders, corresponding to different emotions. The second search mode, retrieval by query image, is illustrated in Figure 6. Objective evaluations (like measuring Precision and Recall) are difficult to design since there is no ground truth. Instead, we encourage readers to make a subjective judgment by interacting with the publicly available demo search engine2 .
Conclusions The findings of this paper show that using color emotions metrics in content-based image retrieval results in new and interesting methods for image retrieval and classification. The color emotion metric, derived from psychophysical experiments, is based on three scales: activity, weight and heat. It was originally designed for single-color combinations, but is also capable of
Color Emotion 1
Color Emotion 1
Second split
Third split Color Emotion 2
we obtain a matrix R, where each row is a 64 bins color emotion histogram, describing the distribution of emotion vectors in the space spanned by the three emotion scales. The L2 norm is used for calculating similarity between histograms in the database and the emotion histogram derived for the query image.
Color Emotion 2
R = H ·T
Initial data Color Emotion 2
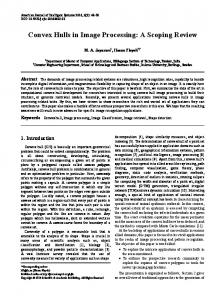
This is the color emotion histogram with 64 bins. In other words, 8 different bins from the original RGB histogram will be included in each bin in the emotion histogram. The splitting procedure is illustrated in Figure 3, and the result from splitting the 512 bins RGB histogram can be seen in Figure 4. Each color represents a leaf, which corresponds to a bin in the color emotion histogram. Knowing which color emotion value belongs to which leaf, or bin in the color emotion histogram, we can create a matrix T transforming 512 bins RGB-histograms to 64 bins color emotion histograms. T will have the size 512 × 64 (rows × columns), where each column, denoted tn , will generate bin number n in the emotion histogram. Each column tn contain zeros except for the eight positions that will be included in bin n in the emotion histogram. After multiplying the histogram matrix H with T
Color Emotion 1 Figure 3.
Color Emotion 1
A simple illustration of the decomposition of histogram bins.
For viewing purpose, only two axes (color emotions) are included in this illustration. In the upper left image the initial data, this time 16 dots (bins), are displayed. In the upper right image we perform the first decomposition by splitting the data perpendicular to the Color Emotion 1 axis. In bottom left image we perform the second decomposition by splitting each new data region perpendicular to the Color Emotion 2 axis. Then we continue cycling through the axes and split regions until we get the preferred amount of leaves. This example ends with eight leaves, each containing 2 bins, as shown in the bottom right image.
2 http://media-vibrance.itn.liu.se/imemo/
CGIV 2008 and MCS’08 Final Program and Proceedings
369
< warm - HEAT - cool >
2.5 2 1.5 1 0.5 0 0. 5 1 1. 5 2
4 2 0 2
< heavy - WEIGHT - light >
2
0
2
4
6
< active - ACTIVITY - passive >
Figure 4. Visualization of the color emotion histogram. Same points as in Figure 1, but groups of 8 are coded in different colors. Each group represents a bin in the color emotion histogram.
predicting color emotions for color pairs by averaging the coloremotion scores of individual colors in each pair. Experiments demonstrate that the same approach can be used for images. The color emotion of a whole picture is derived as the sum or average of all color emotions from its pixels. A modified approach for statistical analysis of color emotion in images, involving transformations on ordinary RGB histograms, proves to be powerful enough to provide a useful tool for image retrieval. The method is both very fast in feature extraction, and the resulting descriptors are very small, which is essential since we are interested in retrieval from very large image databases containing millions or billions of images. Two retrieval methods were presented: one based on the selection and weighting of color emotion words and one using color emotion histograms. These are distributions of vectors in the space spanned by the emotion scales. Similarity measurements between histograms are used to obtain images with similar emotional appeal as the query image. Experiments with a small database containing 5000 images show that color emotion properties of images are well suited for semantic image retrieval.
Cross-Cultural Color Emotion. COLOR research and application. 32 (2007) 223–229 [8] J.H. Xin, K.M. Cheng, G. Taylor, T. Sato, and A. Hansuebsai, Crossregional comparison of colour emotions Part I: Quantitative analysis. COLOR research and application. 29 (2004) 451–457 [9] J.H. Xin, K.M. Cheng, G. Taylor, T. Sato, and A. Hansuebsai, Crossregional comparison of colour emotions Part II: Qualitative analysis. COLOR research and application. 29 (2004) 458–466 [10] D. Cohen-Or, O. Sorkine, R. Gal, T. Leyvand, and Y. Xu, Color harmonization. SIGGRAPH ’06: ACM SIGGRAPH 2006 Papers, ACM Press. 25 (2006) 624–630 [11] W.N. Wang, and Y.L. Yu, Image emotional semantic query based on color semantic description. 2005 International Conference on Machine Learning and Cybernetics, ICMLC 2005. (2005) 4571–4576 [12] S.Y. Hong, and H.Y. Choi, Color Image Semantic Information Retrieval System using Human Sensation and Emotion. IACIS, VII. (2006) 140–145 [13] S.B. Cho, and J.Y. Lee, A human-oriented image retrieval system using interactive genetic algorithm. IEEE Trans. SMC-A. 32 (2002) 452–458 [14] M.D. Fairchild, Color Appearance Models. Wiley-IS&T. (2005) [15] S. Kobayashi, The aim and method of the Color Image Scale. COLOR research and application. (1981) 93–107 [16] T. Sato, K. Kajiwara, H. Hoshino, and T. Nakamura, Quantitative evaluation and categorising of human emotion induced by colour. Advances in Colour Science and Technology. 3 (2000) 53–59
Author Biography Martin Solli received a Master of Science in Media Technology and Engineering from Link¨oping University, Sweden in 2005, where he currently is pursuing a Ph.D. degree at the Department of Science and Technology. His research includes Content Based Image Retrieval with focus on color signal processing, and multispectral imaging. Reiner Lenz is associate professor at the Department of Science and Technology, Link¨oping University, Sweden. He received an diploma degree in mathematics from the Georg August Universit¨at, G¨ottingen, Germany and a PhD degree in Electrical Engineering from Link¨oping University, Sweden. He received an honorable mention for the Pattern Recognition Society Award and is associated editor for Pattern Recognition and the IEEE-Transactions on Image Processing.
References [1] H. Sundaram, M. Naphade, J. Smith, and Y. Rui (ed.), Image and Video Retrieval, LNCS. 4071 (2006) [2] M.S. Lew, N. Sebe, C. Djeraba, and R. Jain, Content-based multimedia information retrieval: State of the art and challenges. ACM Transactions on Multimedia Computing, Communications, and Applications, ACM Press. 2 (2006) 1–19 [3] L.C. Ou, M.R. Luo, A. Woodcock, and A. Wright, A study of colour emotion and colour preference. Part I: Colour emotions for single colours. COLOR research and application. 29 (2004) 232–240 [4] L.C. Ou, M.R. Luo, A. Woodcock, and A. Wright, A study of colour emotion and colour preference. Part II: Colour emotions for twocolour combinations. COLOR research and application. 29 (2004) 292–298 [5] L.C. Ou, M.R. Luo, A. Woodcock, and A. Wright, A study of colour emotion and colour preference. Part III: Colour preference modeling. COLOR research and application. 29 (2004) 381–389 [6] X.P. Gao, and J.H. Xin, Investigation of human’s emotional responses on colors. COLOR research and application. 31 (2006) 411– 417 [7] X.P. Gao, J.H. Xin, T. Sato, A. Hansuebsai, M. Scalzo, K. Kajiwara, S. Guan, J. Valldeperas, M. Lis Jos´e, and M. Billger, Analysis of
370
©2008 Society for Imaging Science and Technology
active
passive
active
passive
heavy
light
heavy
light
warm
cool
warm
cool
active
passive
heavy
light
warm
cool
active
passive
heavy
light
warm
cool
active
passive
heavy
light
warm
cool
active
passive
heavy
light
warm
cool
active
passive
heavy
light
warm
cool
Figure 5. Search using emotion words. The sliders show the values of the emotion words, the images are the five best matches for each query.
Query image
Five best matches
Figure 6. Retrieval using color emotion histograms.
CGIV 2008 and MCS’08 Final Program and Proceedings
371