DISTANCE MEASURES FOR COLOR IMAGE RETRIEVAL D. Androutsost, K. N . Plataniotist and A . N . Venetsanopoulost
t Digital Signal & Image Processing Lab Department of Electrical & Computer Engineering University of Toronto 10 King’s College Road, Toronto, Ontario, M5S 3G4, CANADA http://www.dsp. toronto.edu {zeus,anv}@dsp.toronto.edu SRyerson Polytechnic University, Department of Math, Physics & Computer Science 350 Victoria Street, Toronto, Ontario, M5B 2K3, CANADA kplat
[email protected] feature which is used to index database images [4]. This is not surprising since visual recognition and human recall are highly dependant to color. However, the majority of retrieval techniques implement color histograms for image retrieval using color. These histogram-based techniques provide good results, however, issues such as histogram dimensionality, and the lack of good perceptually-based similarity measures call for new methods. Furthermore, the granularity which histogram techniques provide is not essential for efficient retrieval since it is our perception of color that is of utmost importance and, as humans, we cannot discern the difference between very close color values. In this paper we study various vector distance measures which we implement in our image database system for image retrieval by color. We use color segmentation to extract regions of prominent color and use representative vectors from these extracted regions in the image indices. Distance measures are then used in the query process to determine image similarity. Section 2 describes our database system and the indexing process. Section 3 discusses the distance measures implemented and Section 4 presents some results. Finally, Section 5 concludes the paper with a final discussion.
ABSTRACT In this paper we address the issue of image database retrieval based on color using various vector distance metrics. Our system is based on color segmentation where only a few representative color vectors are extracted from each image and used as image indices. These vectors are then used with vector distance measures to determine similarity between a query color and a database image. We test numerous popular vector distance measures in our system and find that directional measures provide the most accurate and perceptually relevant retrievals. 1. INTRODUCTION
Efficient access to digital data has become an issue of utmost importance recently. In particular, the amount of digital image and video data available is staggering and the challenging issues of cataloging and retrieval has gained increasing importance. Without a doubt, efficient access to relevant data directly determines its value. As digital acquisition and storage grow, a number of industrial fields, such as medical imagery, graphic arts, textile and paint, satellite imagery, criminology and film, require efficient access to their data. ContentBased Image Retrieval (CBIR) is a relatively new research area which is dedicated to the image retrieval problem [I] and a number of image database system have been developed [2, 31. A key aspect of image databases is the creation of robust and efficient indices which are used for retrieval. Color remains the most important low-level
2. COLOR INDEXING
To build indices into our image database we take into consideration factors such as human color perception and recall. For example, as humans it is very difficult, if not impossible, for us to visually discern the difference between two very close ( R ,G, B ) values, e.g., (255,48,32) and (254,48,32). Furthermore, if we were 770
0-8186-8821-1/98$10.00 0 1998 IEEE
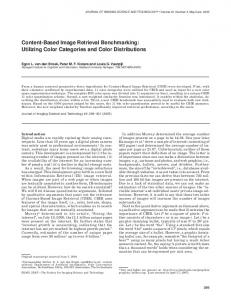
to describe the color content of an image, we would use terms such as red, dark yellow or deep green, not RGB values. Essentially, we build a low level model of the image in question in our mind and compare candidate images to this model. The color granularity provided by histogram indexing is, in most cases, not necessary, especially when the final observer is a human. 2.1. HSV Segmentation Our method of color indexing implements segmentation to extract regions within the image which contain perceptually similar color. We do this by thresholding the HSV histogra.ms of the image. Specifically, it is the hue histogram which contains most of the color information. The saituration and value are examined and used to determine which regions of the image are achromatic. We have found, in the literature and experimentally [5, 61, that colors with value< 25 can be classified as black and that colors with saturation< 20 and value> 60 can be classified as white. The remaining pixels all fall in the chromatic region of the HSV cone, as shown in Figure 1. We build the hue histogram of these remaining pixels and threshold the resulting peaks t80 segment the image into n regions. Finally, we calculate the average color of each of VAL
Green
Yellow
Figure 2: Typical image and its HUE histogram.
color vectors. In addition, we also have at our disposal spatial color information which can also be indexed. The above segmentation technique was performed on 2000 24-bit natural images of 512 x 512 resolution and each n representative vector for each image, were used to build each index. Figure 1: HSV cone depicting BLACK and WHITE regions.
3. DIST.ANCE MEASURES
the n regions and use that RGB value as each regions representative vector. Figure 2 shows a typical image and its corresponding hue histogram. Figure 3 shows the segmented result after histogram thresholding. As can be seen, the result is an accurate low-level representation of the color content in the image using only n
To perform the actual image retrieval we investigated a number of vector distance measures to discover which gave the most accurate and perceptually correct result: 1. The generalized Minkowski metric ( L M norm):
771
Since, similar colors have almost parallel orientations, significantly different colors point in different overall directions in the RGB color space. Thus, the angular distance which quantifies the orientation difference between two color signals is a meaningful measure of their similarity.
5 . We have also developed a new distance measure which combines the angle between two vectors and their magnitude difference. When two vectors under consideration are collinear, only magnitude difference is used to quantify intensity differences:
Figure 3: Segmented image.
(cI($ -$)I P
dM(i,j)=
angle
1 -
M
M
,
magnitude
Since we deal with RGB vectors, we are constrained to one quadrant of the Cartesian space. Thus, the normalization factor of $ in the angle portion is attributed to the fact that the maximum angle which can possibly be attained is .; Also, the d m normalization factor, in the magnitude part of (6), is due to the fact that the maximum difference vector which can exist is (255,255,255) and its magnitude is d w .
(l)
k=l
where p is the dimension of the vector & and xf is the kth element of & . Three special cases of the LM metric are of particular interest, namely, L = 1,2,00. The Canberra distance defined as follows:
This measure has the added advantage that the magnitude and angle portions can be assigned weights to stress one over the other. where p is the dimension of the vector Zi and xf is the kth element of & . The Canberra metric applies only to non-negative multivariate data, which is the case when color vectors described in the RGB reference system are considered.
4. RESULTS
The query was performed by providing a query color from a color picker and the system applied the given distance measure to each n representative vectors of each database image. In addition we chose to look for images which contain over 50% of the query color. The results were then numerically sorted and the best 23 images were displayed along with the query color. Quantitative performance was evaluated by calculating the retrieval rate, defined as [7]:
Another distance measure applicable only to vectors with non-negative components, such as color signals is the Czekanowski coeficient, defined as follows:
The angular distance between two vectors can be used to quantify similarity:
where Ni is the total images in a given query set Q, (i.e., all images in the database which match the query),
772
and Nj are the number of images which appear in the top Ni retrieval positions which are part of Q. The set Q was obtained by asking a number of volunteers to manually search through our 2000 image database and list the images which were considered to contain at least 50% of a given query color with RGB values of 130,164,53. Table 1 lists the retrieval rates for the above mentioned distance measures. Clearly, it can be seen that the angular-based measures perform much better in terms of retrieval rate. For qualitative analTable 1: Retrieval rate for 7 different vector distance measures
Figure 4: Retrieval result using L1 norm. Top left image is the query color. Decreasing similarity from left t o right, top to bottom.
measure L1
-Lm
Canberra czelcimowslci angle combo
ysis, figures 4-10 depict the top 23 retrieval results for the 7 discussed measures. In addition, the query color is included in the top-left corner of each figure. As indicated from Table 1, the Czekanowski measure gives the poorest result, where the majority of retrieved images are visually erroneous. The L-norms prcivide improved results (Figs. 4-6). The L1 and La, in particular, provide similar retrieval results, especially in the first 6 rankings. The Canberra measure (Fig. 7, provided good ranking for the first 6 positions but then included many erroneous images in tlhe remaining results. The angular distance-based measures (Figs. 9-10, perceptually provided the best retrieval results of the investigated measures. All the retrieved images, with the exception of 5, exhibited a high color content similar t o the query color.
Figure 5: Retrieval result using Lz norm. Top left image is the query color. Decreasing similarity from left t o right, top to bottom. angle-based distance measures provide perceptually accurate results with a high retrieval rate. 6. REFERENCES
[l] V.N. Gudivada and V.V. Raghavan, “Contentbased image retrieval systems,” Computer 28, September 1995.
5. CONCLUSIONS [2] W. Niblack, et. al., “The QBIC project: Querying images by content using color, texture and shape,” Storage and Retrieval for Image and Video Databases, M.H. Loew, ed., Proc. SPIE 1908,1993.
In this paper we have investigated various vector distance measures for use in color image retrieval. In our system, we color segment each database image and generate representative BtGB vectors for each of the n colors extracted from each image. These n vectors are then used as database: indices for each color image. We test a number of well-known distance measures using these indices and a query color and we have found that
[3] J.R. Smith and Shih-Fu Chang, “VisualSEEK: a fully automated content-based image query system,” ACM Multimedia Conference, November 1996.
773
Figure 6: Retrieval result using L , norm. Top left image is the query color. ~ ~ similarity~ from left to right, top to bottom.
using distance. ~Figure 8: ~Retrieval result ~ ~ Czekanowski i ~ Top left image is the query color. Decreasing similarity from left t o right, top to bottom.
Fi gure 7: Retrieval result using Canberra distance. Top left image is the query color. Decreasing similarity from left to right, top to bottom.
Figure 9: Retrieval result using angular distance. Top left image is the query color. Decreasing similarity from left t o right, top to bottom.
M. Stricker and M. Orengo, “Similarity of color images,” Storage and Retrieval for Image and Video Databases III, Proc. SPIE 2420,pp. 381-392, 1995. Y. Gong, M. Sakauchi, “Detection of regions matching specified chromatic features,” Computer Vision and Image Understanding, 61(2), March, 1995. N. Herodotou, K.N. Plataniotis, A.N. Venetsanopoulos, “A Content-Based Storage and Retrieval Scheme for Image and Video Databases”, SPIE, Visual Communications and Image Processing, Proc SPIE3309, pp. 697-708 San Jose, January, 1998.
H. Zhang, Y. Gong, S.W. Smoliar, “Image retrieval based on color features: an evaluation study,” Digita1 Image Storage and Archiving Systems, proc SPIE 2606, pp. 212-220, 1995.
Figure 10: Retrieval result using the new combination distance. Top left image is the query color. Decreasing similarity from left to right, top t o bottom.
774
g