plying color normalization (Shades of Gray [17]). This inter .... Output examples for Melanoma lesions: Original Image and ground truth labels (left); Output (right).
COLOR IDENTIFICATION IN DERMOSCOPY IMAGES USING GAUSSIAN MIXTURE MODELS Catarina Barata1
M´ario A. T. Figueiredo2
M. Emre Celebi3
Jorge S. Marques1
1
ISR, Instituto Superio T´ecnico, Portugal IT, Instituto Superio T´ecnico, Portugal 3 Louisiana State University in Shreveport, USA 2
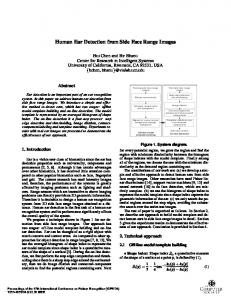
ABSTRACT Development of Computer Aided Diagnosis systems that mimic the performance of dermatologists when diagnosing dermoscopy images is a challenging task. Despite the relevance of color in the diagnosis of melanomas, few of the proposed systems exploit this characteristic directly. In this paper we propose a new methodology for color identification in dermoscopy images. Our approach is to learn a statistical model for each color using Gaussian mixtures. The results show that the proposed method performs well, with an average Spearman correlation of 0.7981, with respect to a human expert. Index Terms— Melanoma, Dermoscopy image analysis, color detection, Gaussian mixtures models 1. INTRODUCTION For the past decade there has been an increasing interest in the development of Computer Aided Diagnosis (CAD) systems for the analysis of dermoscopy images (see Fig.1) [1, 2, 3, 4]. The main purpose of these systems is the diagnosis of skin cancer, in particular melanoma. Most of the systems described in literature use common pattern recognition approaches to diagnose the lesions. They extract a great number of common features that characterize the shape, color and texture of the lesion and use them to train a classifier. Despite their interesting results, the main issue with this kind of system is that it does not mimic the analysis performed by a dermatologist. This makes them difficult to be accepted by the medical community, who prefers systems that try to reproduce their established and validated methodologies. To deal with this issue, a recent trend in CAD systems is to develop different processing blocks that mimic the medical procedures and detect relevant structures, such as pigment networks [5] or streaks [6]. In this paper, we propose an algorithm for the detection of colors in dermoscopy images, which is a feature considered by dermatologists when diagnosing dermoscopy images. This work was partially funded with grant SFRH/ BD/84658/2012 and by the FCT project PEst-OE/EEI/LA0009/2013.
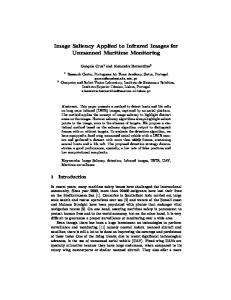
Fig. 1. Examples of dermoscopy images. The so called ABCD rule [7] accounts for the number of colors while the 7-point checklist [8] considers two color structures associated with melanoma. Furthermore, dermatologists claim that there are colors that are more common in melanomas than in benign lesions: black, blue-gray, white and red, showing that color detection and quantification in dermoscopy images is of great significance. However, there are few studies that focus on this problem. The most common type of color based CAD systems are those that aim at detecting blue-whitish veil and use this single characteristic to classify the lesion as melanoma or benign [9, 10, 11]. A different idea is used in [12] and [13]; instead of detecting a single color structure, their methods are inspired by the ABCD rule and the Menzies’ method [14], respectively, and tries to quantify the number of colors. Nonetheless, the detection of colors in dermoscopy images is still an open problem. The methodology proposed in this paper consists of computing a statistical model of 5 significant colors (black, bluegray, white, dark and light brown) using Gaussian mixtures [15]. This is done using a training set of segmented images provided by an expert. Then, the learned mixtures are used to asses the colors of a larger set of images. As far as we know, this is the first time this kind of approach is applied to dermoscopy images. The training and testing procedures are described in Sections 2-4. The color assessment results are reported in Section 5, while Section 6 concludes the paper and gives some remarks on future work. 2. SYSTEM OVERVIEW The proposed color description and detection system comprises two different stages (see Fig. 2). First, a Gaussian mixture model is learned for each of the colors using the algo-
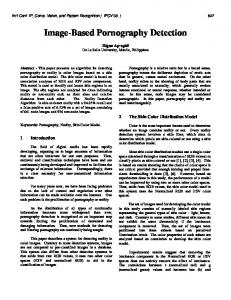
Fig. 3. Examples of color region segmentations. Fig. 2. System Overview. rithm proposed by Figueiredo and Jain [15]. Thus, the learned color model comprises five different mixtures, one describing each color considered in the ABCD rule (black, dark brown, light brown, blue-gray and white) [7]. Dermatologists also consider red as a color that can be found in dermoscopy images. However, we have not modeled it due to lack of training data. A detailed description of the color modeling stage is presented in Section 3. After learning the color models, these models are used to detect the presence of each color in new images. This task is performed by splitting the lesion into M×M square patches and computing their probability of membership to each of the mixtures. Finally, the number of colors in the image is quantified. Color assignment and quantification processes are described in Section 4. Prior to the aforementioned two steps the images are preprocessed. First, we remove hair and bubbles artifacts using the algorithm described in [5] and compute a binary segmentation mask. To avoid errors related to incorrect segmentations this task is performed manually. Then, gamma correction (γ = 2.2) is applied to convert the images to the standard RGB (sRGB) format [16]. The following step consists of applying color normalization (Shades of Gray [17]). This intermediate step is performed in order to deal with color variability caused by different light sources. Finally, the corrected images are transformed into the HSV and CIE La*b* color spaces, we have selected these two spaces because both correlate well with human color perception, which is not true for the RGB space. 3. LEARNING COLOR MODELS This section explains the methodology used to learn the five Gaussian mixtures that describe the colors. 3.1. Training Set The training set used consists of 27 dermoscopy images. For each image, the different color regions were manually seg-
mented and labeled by an expert dermatologist (see an example in Figure 3). In the end, there are 17 examples of both dark brown and light brown, 5 examples of blue-gray, and 3 examples of both black and white. A set of round patches, each with a radius of 5 pixels, was then randomly selected in region. Since there are considerably more examples of dark and light brown than of the remaining colors, the number of patches extracted from each of the corresponding regions was smaller. Therefore, we selected 250 patches from each light and dark brown regions, 350 patches from each blue-gray region and 500 patches from each white and black regions. The final step computes a feature vector to characterize each patch, which is its mean color. 3.2. Learning Color Mixture Models In this work we adopt a statistical model for the colors based on Gaussian mixtures. Since there is a different number of examples of each of the five colors, i.e., the data are unbalanced, a separate mixture is computed for each color. Thus, the final color palette comprises five different Gaussian mixtures, each with the following probability density function p(y|c, θc ) =
kc X
c c αm p(y|c, θm ) ,
(1)
m=1
where c = 1, 2, ..., 5 denotes each of the five colors, kc c is the number of components of the color mixture, α1c ...αkc are the Pk c c c mixing probabilities (αm ≥ 0 and m=1 αm = 1) and θm is the set of parameters that defines the m-th component of the mixture. In our work, y is a d-dimensional feature vector associated to a training or test patch and � � d (2π)− 2 1 c −1 p(y|θm )= p exp − (y − µcm )T Rm (y − µcm ) , c | 2 |Rm (2) c c c where θm = (µcm , Rm , αm ). Thus, the parameters to be estimated when learning a mixture are the mean and covariance c of each component (µcm , Rm ) and the corresponding mixing c probabilities αm .
The traditional approach to estimate these parameters is the expectation-maximization (EM) algorithm. However, it is not easy to select the best number of components of the mixtures using this algorithm. To deal with this issue Figueiredo and Jain [15] proposed an approach to learn mixture models, using a variant of the EM algorithm that implements the minimum message length (MML) criterion as the cost function, in order to automatically find the best number of components of a mixture. The procedure tests all the component numbers in {kmin , kmin + 1, ..., kmax − 1, kmax } using the componentwise EM (CEM) for mixtures [18]. After achieving convergence with a certain k, they set the component with smaller α bm to zero and rerun CEM until convergence. This task is performed while k ≥ kmin and in the end, the estimated parameters as well as the number of components are those which minimize the MML criterion. For a detailed description, see [15]. 4. COLOR ASSIGNMENT AND QUANTIFICATION This section describes the methodology used to identify the colors of a skin lesion. We adopt a hierarchical decision scheme, involving two steps, namely patch labeling and lesion labeling. We start by sampling the lesion into small patches of size 12 × 12 using a regular grid. Then, we compute a feature vector to characterize each patch, using the mean color. To assign a color label to each of the patches, we compute their posterior probability of belonging to each of the color models as follows p(y|c, θbc )p(c) , (3) p(c|y) = b p(y|θ) bc , α where θbc = (b µc , R bc ), θb = (θb1 , ..., θb5 ) and p(c) = 1/5 is set to be equal for all colors. Then, we sort the degrees of membership and denote the color with the highest and second highest values as c1 and c2 , respectively. Now, one of three actions takes place 1. If p(c1 |y) ≥ δ and p(c1 |y) − p(c2 |y) > �, where δ and � are empirically determined thresholds, the patch is labeled according to color c1 . 2. If p(c1 |y) ≥ δ and p(c1 |y) − p(c2 |y) ≤ �, the patch receives a label which expresses doubt between c1 and c2 . 3. If p(c1 |y) < δ , the patch is rejected. The final step consists of deciding whether a color is present or absent in a lesion. This task is performed using five empirically determined area ratio thresholds. Thus, each color region is considered only if its area ratio is above a specific threshold. The defined thresholds are 15% of the lesion’s area for light brown, 5% for dark brown, 4% for blue-gray and 2% for black and white. It is import to stress
that to compute the area ratios we only use the patches that do not have doubt labels. 5. EXPERIMENTAL SETUP AND RESULTS 5.1. Experimental Setup A total of 130 images selected from the PH2 database [19] were used in this work. From this dataset, 27 images were selected for training the color mixture models and the remaining images were used for testing. The test set comprises three different types of skin lesions: 38 common nevi, 38 atypical nevi (skin lesions which require follow up) and 27 melanomas. These three classes were selected due to their different color properties. The images are in RGB format and have an average size of 575×765. An experienced dermatologist was asked to identify the colors present in each image. In the case of the training images, the dermatologist was also asked to segment the regions corresponding to each color and to avoid overlapping different segmentations. The procedure used to train and evaluate the proposed system was the following. First, the five color models were learned using three different configurations of feature vectors: HSV only, La*b* only and the combination of these two color spaces. Each time, the mixture learning algorithm was initialized with kmax = 6 and kmin = 1. The initial values of the mixture components were computed as in [15]. Source code for the learning algorithm is available at http://www.lx.it.pt/ mtf/. In each case, the final mixture has two to four components, depending on the color. To evaluate the performance of the algorithm, its output for a set of unseen images is compared with the labels provided by the dermatologist. Each color correctly identified in an image is considered a correct detection (CD), a missed color is a detection failures (DF), and a detected color that has no corresponding label is a false alarms (FA). Global concordance between the expert and the system was computed for each color using Spearman’s rank correlation coefficient P 6 d2i ρ=1− (4) n(n2 − 1) where di is the difference between the ranks of the expert label and the computer label, and n is the number of test images. 5.2. Results and Discussion Tables 1 and 2 show the color detection results for the HSV and La*b* spaces, respectively. For these two color spaces, the number of CDs exceeds the proportion of both FAs and DFs, which is very good. The HSV color space seems to lead to an overall better performance than La*b* since the ρ values are all significantly large and more alike (mean ρ = 0.7534 against mean ρ = 0.7257). Even so, La*b* seems to be more appropriate to
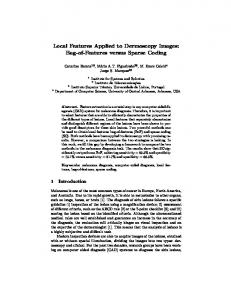
Fig. 4. Output examples for Melanoma lesions: Original Image and ground truth labels (left); Output (right). Table 1. Color detection results using HSV.
Blue Gray Dark Brown Light Brown Black White
CD 1 18 33 0 0
Nevi FA DF 3 0 3 3 2 1 7 0 4 0
CD 4 33 22 8 0
Atypical FA DF 8 0 2 1 2 3 11 1 5 0
Melanoma CD FA DF 19 5 2 21 4 3 14 1 6 20 6 0 6 13 1
Table 3. Color detection results using HSV+ La*b*. ρ 0.7763 0.7675 0.7851 0.7107 0.7274
Table 2. Color detection results using La*b*.
Blue Gray Dark Brown Light Brown Black White
CD 0 17 33 0 0
Nevi FA DF 1 1 9 4 1 1 1 0 2 0
CD 4 31 25 7 0
Atypical FA DF 7 0 2 3 3 0 5 2 6 0
Melanoma CD FA DF 20 5 1 17 3 7 14 1 6 11 3 9 3 14 4
ρ 0.8102 0.5922 0.8258 0.7234 0.6768
describe the blue gray, black, and light brown colors, because higher values of ρ are obtained with this space. It is interesting to observe that the number of detections of back, white, and blue gray is larger in atypical lesions and melanoma than in nevi. This agrees with what can be found in medical the literature, where it is stated that these colors are more common in atypical nevi and melanoma [20]. Combining the two spaces in the same feature vector seems to be the best configuration, taking into account all the ρ values (see Table 3) and the mean ρ value of 0.7981. This fusion of color spaces seems to significantly reduce the number of FAs. However, in the case of blue gray, the fusion leads to a decrease in the number of CDs, and consequent
Blue Gray Dark Brown Light Brown Black White
CD 1 21 34 0 0
Nevi FA DF 0 0 0 0 1 0 1 0 1 0
CD 4 30 24 7 0
Atypical FA DF 7 0 2 4 4 1 3 2 4 0
Melanoma CD FA DF 15 5 6 24 3 0 16 1 4 12 3 8 4 10 3
ρ 0.7559 0.8691 0.8399 0.7675 0.7582
increase in DFs. Fig. 4 show some examples of the colors detected in melanoma lesions using this hybrid configuration of features. A thorough inspection of the doubt labels obtained for all images showed that there are four labels which are more common than the others: the blue gray-black doubt, the blue gray-dark brown, the dark brown-black, and the dark brown-light brown. 6. CONCLUSIONS AND FUTURE WORK We proposed a new method for the detection of colors in dermoscopy images, using Gaussian mixtures. Our experimental results shown that the best results are achieved by combining the information of the HSV and La*b* color spaces. Our results are promising, with 192 CDs, 45 FAs, 28 DFs, and an average Spearman correlation of 0.7981, with respect to an expert dermatologist. The proposed strategy has potential and can be applied to other tasks, such as the segmentation of dermoscopy images, using statistical model describing the color of the skin.
7. REFERENCES [1] M E. Celebi, H. Kingravi, B. Uddin, H. Iyatomi, Y. Aslandogan, W. Stoecker, and R. Moss, “A methodological approach to the classification of dermoscopy images,” Computerized Medical Imaging and Graphics, vol. 31, pp. 362–373, 2007. [2] R.J. Stanley, W.V. Stoecker, and R.H. Moss, “A relative color approach to color discrimination for malignant melanoma detection in dermoscopy images,” Skin Research Technology, vol. 13, pp. 67–72, 2007. [3] H. Iyatomi, H. Oka, M E. Celebi, M. Hashimoto, M. Hagiwara, M. Tanaka, and K. Ogawa, “An improved internet-based melanoma screening system with dermatologist-like tumor area extraction algorithm,” Computerized Medical Imaging and Graphics, vol. 32, no. 7, pp. 566–579, 2008. [4] Q. Abbas, Emre C. M, I. F. Garcia, and W. Ahmad, “Melanoma recognition framework based on expert definition of abcd for dermoscopic images,” Skin Research and Technology, vol. 19, pp. e93–e102, 2013. [5] C. Barata, J S. Marques, and J Rozeira, “A system for the detection of pigment network in dermoscopy images using directional filters,” IEEE transactions on biomedical engineering, vol. 10, pp. 2744–2754, 2012. [6] M Sadeghi, T Lee, H Lui, D McLean, and S Atkins, “Detection and analysis of irregular streaks in dermoscopic images of skin lesions,” vol. 32, pp. 849–861, 2013. [7] W. Stolz, A. Riemann, and A B. Cognetta, “ABCD rule of dermatoscopy: a new practical method for early recognition of malignant melanoma,” European Journal of Dermatology, vol. 4, pp. 521–527, 1994. [8] G. Argenziano, G. Fabbrocini, P. Carli, V. De Giorgi, E. Sammarco, and El. Delfino, “Epiluminescence microscopy for the diagnosis of doubtful melanocytic skin lesions. comparison of the ABCD rule of dermatoscopy and a new 7-point checklist based on pattern analysis,” Archives of Dermatology, vol. 134, pp. 1563–1570, 1998. [9] M E. Celebi, H. Iyatomi, W. V. Stoecker, R. H. Moss, H. S. Rabinovitz, G. Argenziano, and H. P. Soyer, “Automatic detection of blue-white veil and related structures in dermoscopy images,” Computerized Medical Imaging and Graphics, vol. 32, pp. 670–677, 2008. [10] G. Di Leo, G. Fabbrocini, A. Paolillo, O. Rescigno, and P. Sommella, “Towards an automatic diagnosis system for skin lesions: estimation of blue-whitish veil and regression structures,” in Systems, Signals and Devices,
2009. SSD’09. 6th International Multi-Conference on. IEEE, 2009, pp. 1–6. [11] A. Madooei, M. S. Drew, M. Sadeghi, and M. S. Atkins, “Automatic detection of blue-white veil by discrete colour matching in dermoscopy images,” in Medical Image Computing and Computer-Assisted Intervention– MICCAI 2013, pp. 453–460. Springer, 2013. [12] S. Seidenari, G. Pellacani, and C. Grana, “Computer description of colours in dermoscopic melanocytic lesion images reproducing clinical assessment,” British Journal of Dermatology, vol. 149, no. 3, pp. 523–529, 2003. [13] A R. S. Marcal, T. Mendonca, C. S. P. Silva, M. A. Pereira, and Rozeira J., “Evaluation of the menzies method potential for automatic dermoscopic image analysis,” in Computational Modelling of Objects Represented in Images - CompImage 2012, 2012, pp. 103– 108. [14] S.W. Menzies, C. Ingvar, K.A. Crotty, and W H. McCarthy, “Frequency and morphologic characteristics of invasive melanomas lacking specific surface microscopic features,” Archives of Dermatology, vol. 132, pp. 1178–1182, 1996. [15] M. A. T. Figueiredo and A. K. Jain, “Unsupervised learning of finite mixture models,” IEEE Transactions on Pattern Analysis and Machine Intelligence, vol. 24, no. 3, pp. 381–396, 2002. [16] Charles Poynton, Digital video and HD: Algorithms and Interfaces, Morgan Kaufmann, 2012. [17] G. Finlayson and E. Trezzi, “Shades of gray and colour constancy,” in IS&T/SID 12th Color Imaging Conference, 2004, pp. 37–41. [18] G. Celeux, S. Chr´etien, F. Forbes, and A. Mkhadri, “A component-wise em algorithm for mixtures,” Journal of Computational and Graphical Statistics, vol. 10, 2001. [19] T. Mendonca, P. M Ferreira, J. S Marques, A RS Marcal, and J. Rozeira, “Ph 2-a dermoscopic image database for research and benchmarking,” in 35th EMBC. IEEE, 2013, pp. 5437–5440. [20] G. Argenziano, H P. Soyer, V. De Giorgi, D. Piccolo, P. Carli, M. Delfino, A. Ferrari, V. Hofmann-Wellenhog, D. Massi, G. Mazzocchetti, M. Scalvenzi, and I H. Wolf, “Interactive atlas of dermoscopy,” 2000.