The sinusoids act as a grid, providing a coordinate ... cies could also act as landmarks with respect to which ..... digital signature for image authentication. Proc.
Embedding Invisible Information in Color Images � David J. Fleet
David J. Heeger
Department of Computing Science Queen's University Kingston, Canada K7L 3N6
Department of Psychology Stanford University Palo Alto, CA 94305
Abstract
We describe a method for embedding information in color images. A model of human color vision is used to ensure that the embedded signal is invisible. Sinusoidal signals are embedded so that they can be detected (decoded) without use of the original image. The sinusoids act as a grid, providing a coordinate frame on the image. We use the grid to automatically scale and align (deskew) images that have been printed and then scanned.
Introduction
This paper concerns the embedding of information in images. The goal is to perturb images in ways that are invisible to humans but not to computers. Applications include watermarking [1, 5, 6], the embedding of image calibration information, or high-bandwidth digital messages [2]. Although these applications have di�ering requirements, in each case there is a trade-o� between the amplitude of the embedded signal and its perceptibility. As the power of the embedded signal increases there is greater image degradation, but the decoding becomes easier. This paper describes the embedding of amplitudemodulated sinusoidal signals in color images. The embedded information is su�ciently robust that it can be reliably extracted after being printed and scanned on commonplace equipment. To control the perceptibility of the embedded signal, or to ensure that it is below threshold, we use a quantitative model of human visual discriminability. The sinusoids act as a grid, providing an image coordinate frame. Once the decoder has extracted the frequencies of the embedded sinusoids it computes the mapping from the original image to the scanned image. It then automatically aligns and scales the scanned image with the original. As a result, one does not have to align the image perfectly on the scanner, � This paper was presented at IEEE International Conference on Image Processing, Santa Barbara, October 1997, Vol. I, pp. 532{535
L BW M
λ
Linear RG Transform (3 ✕ 3) YB
S
ω
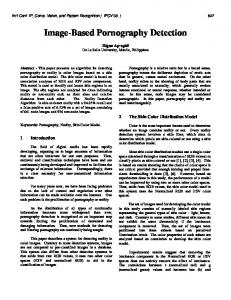
Figure 1: In human color processing, the input is encoded as 3 cone responses at each image position. These are transformed into an opponent-color representation with 3 bands, namely, black-white (BW), red-green (RG), and yellow-blue (YB). They are lowpass ltered with di�erent frequency cuto�s. nor scale/rotate the page after scanning. The frequencies could also act as landmarks with respect to which other embedded information could be located.
Human Color Processing: S-CIELAB
CIELAB is a well-known standard for measuring color reproduction errors. It was based on psychophysical studies of color discriminability with large uniform color patches [7, 8]. More recent studies have shown that color appearance also depends on the local structure of the image. Measurements of color appearance with ne-scale patterns (eg. color square-wave gratings of di�erent spatial frequencies) di�er from those with large uniform color patches. To explain these results, Poirson and Wandell [3, 4] proposed a patterncolor separable model for early human color processing (see Fig. 1). In this model the initial color signals (the cone absorptions) are rst transformed into an opponent-color representation with three bands (spatial images), referred to as luminance, red-green (RG), and yellow-blue (YB). Each band is then smoothed with a lowpass lter, where the RG and YB bands have lower frequency cuto�s. S-CIELAB is an extension of CIELAB to account for the dependence of color appearance on spatial
Signal Embedding
In our application we embed a sum of sinusoidal signals, S (x; y), into the yellow-blue (YB) color band of the opponent-color representation (see Fig. 1). We choose high frequencies where human sensitivity is low and most images contain relatively little power. The signal, S (x; y), is embedded in an iterative manner as shown in Fig. 2. S-CIELAB is used in each iteration to attenuate the signal amplitude wherever the di�erence between the original image and the test image (the original plus the embedded signal) is signi cant, ie where �E (x; y) > 1. At each iteration, if there are a su�cient number of image locations where �E (x; y) > 1, then �E (x; y) is converted into an image of attenuation factors a(x; y): a(x; y) = (2 = (2 + max[0; �E (x; y) ? 1]))2 (1) The image of attenuation factors, a(x; y), is blurred and then multiplied with the signal that was embedded in the previous iteration, yielding the embedded
Image with Grid
+
Original Image
Original Sinusoidal Grid
+
structure. To measure color di�erences between two images, S-CIELAB transforms each image into an opponent-color representation and applies lowpass lters to each of the 3 bands. The results are then transformed into CIE XYZ-tristimulus coordinates, from which the conventional CIELAB formula is used to measure the color di�erence at each pixel [7, 8]. These color di�erences are denoted by �E , where values greater than 1 imply that the color di�erences are detectable by humans. Values less than 1 imply that they are not discriminable. S-CIELAB requires some calibration parameters. It requires the mapping between the digital representation of the color image and the spectral re ectance of the image when printed or displayed. Thus, we need a detailed model of the printer or display device and the spectral distribution of the illuminant. At present, our model simply assumes that the image is displayed on a CRT monitor with a conventional set of RGB phosphors. S-CIELAB also requires that we specify a white point. For images printed on white paper this would normally be the re ectance of the paper alone, under a standard illuminant. With digital images, we de ne the white point to be the highest luminance in the image (the pixel with the largest Y component in CIE XYZ-tristimulus coordinates). In practice, color di�erences with �E < 3 are not readily apparent. However, with incomplete knowledge of the proper calibration parameters, it is important to keep the �E values small (e.g. � 1) to be conservative. The user could, however, change this threshold to accept more or less degradation.
Attenuation Image
S-CIELAB Measure of Color Differences
Figure 2: In each iteration of the embedding process (dashed arrows), a signal is added, afterwhich SCIELAB is used to indicate where color di�erences are detectable. At these locations the embedded signal is attenuated before being added again. signal for the next iteration. This process runs until 99.5% of the pixels have �E (x; y) � 1, which usually takes 3 to 5 iterations. The nal embedded signal is
Y n
G(x; y) =
i=1
!
a (x; y) S (x; y) i
(2)
where n is the number of iterations, S (x; y) is the sum of sinusoids, and a (x; y) is the blurred attenuation image at iteration i. The amplitude of the embedded signal can only decrease at each iteration, which ensures convergence so that �E (x; y) � 1 almost everywhere. Equation (1), which converts �E values into attenuation factors, was chosen empirically to obtain a reasonable rate of convergence. The blurring of a(x; y) is important because SCIELAB measures color di�erences in local neighborhoods, due to the spatial blurring in each opponentcolor band. We blur a(x; y) using the same lowpass lter that S-CIELAB uses for the YB band. The blurring also keeps the bandwidth of the embedded signal relatively small. This keeps its frequency content away from low frequencies to which humans are very sensitive. Smaller bandwidths also keep the power of the sinusoids more concentrated and easier to detect. To demonstrate the method we embedded 4 sinusoids into the image shown in Fig.4 (left). Figure 3 shows the amplitude-modulated grid and the YB band with the embedded signal after iterations 1 and 2. The sinusoids had orientations of �45� and wavelengths of 3.8 and 2.7 pixels. Figure 4 shows the original and the resultant images. We calibrated S-CIELAB so that the embedded signal would be invisible when viewed from 10 inches (at which the frequencies are 7 and 10 cycles/degree). In fact, the process is su�ciently robust that the embedded signal remains invisible even when viewed more closely. i
BW Scanned Image (RGB)
Opponent Color Transform
RG YB
FFT
Peak Detection and Warp Estimation
Figure 5: The decoder transforms the image into the
opponent-color representation, and computes the amplitude spectrum of the YB band. Its peaks are enhanced and detected, from which the mapping between the scanned image and the original is computed.
Figure 3: Results of embedding after iterations 1 and
2. (top) Amplitude-modulated grid. (bottom) YB band with embedded signal.
Figure 4: Original hats image (left) and a version with the embedded sinusoids (right). The grid should be invisible when viewed from 10in or more. See CDROM proceedings for color images.
Signal Decoding
The decoder extracts the frequencies that correspond to the embedded sinusoids. To do this without the original image relies on several factors: First, the sinusoids have high frequencies where most images have little power in the YB band. Second, there are geometric relations between the frequencies that will not likely occur by chance. We assume that geometric distortions caused by printing/scanning are nearly conformal (rotation and uniform scaling), and can be modeled well as a linear mapping. This allows us to use our knowledge of the geometric relations among the embedded sinusoids to facilitate their detection. Following Fig. 5, the scanned image is transformed into the opponent-color space, and the amplitude spectrum of the YB band, A(! ; ! ), is computed. Figure 6(top-left) shows the log spectrum of the YB band of Fig. 4 (right). Notice the peak power concentrations of the four embedded sinusoids. To enhance the peaks, we divide A(! ; ! ) by a blurred version of itself. Fig. 6 (top-right) shows the detected peaks. Figure 6 (bottom) shows peaks detected from a scanned version of Fig. 7 (top). This spectrum di�ers from that in Fig. 6 (top-right). First, the peaks corresponding to the embedded sinusoids occur at di�erent x
x
y
y
Figure 6: (top-left) Log amplitude spectrum (origin at image center) of the YB band of the image with the grid in Fig. 4. (top-right) Enhanced spectrum, thresholded to show the peaks detected. (bottom) Peaks detected from scanned image in Fig. 8. frequencies and orientations because the resolutions of the printer and scanner were di�erent and because the page was not oriented perfectly on the scanner. Second, note that new spectral peaks have appeared, caused by scanner/printer artifacts and the oriented boundaries of the scanned image. The decoder rst extracts all energy peaks as candidate frequencies. From the set of candidates we examine all combinations of four, discarding those immediately that violate our a priori geometric constraints on the embedded frequencies. This pruning quickly removes the unlikely candidates. Of the sets of four that remain, we nd the one that yields the best (leastsquares sense) linear mapping between the locations of the scanned peaks and the original peaks.
that the embedded sinusoids are well within the frequency range to which humans are normally quite sensitive with luminance (black-white) patterns. However, human sensitivity at these frequencies in color bands is much lower, and this is why we embed the signal in the YB band. One advantage of this is that the embedded signals can be detected at relatively low sampling rates (e.g., in preview mode on the scanner).
Conclusion
We describe a way to embed sinusoidal signals in color images. We use a model of human color vision to make them invisible, yet they can be detected and extracted by a decoder without using the original image. The sinusoial signals act as a grid, providing a coordinate frame on the image. We can extract the sinusoids from a scanned version of the image, and thereby compute the mapping from the original image to the scanned image. With this we automatically scale and orient the scanned version with the original.
Acknowledgements:
We thank B. Wandell and X. Zhang for their implementation of S-CIELAB, T. Cass for motivating the embedding problem and the use of human color models, and Xerox PARC and NSERC Canada for supporting this work.
References
Figure 7: (top) Fig. 4 (right) was scanned at 300dpi.
(bottom) Warped version of the scanned image computed by the decoder. The mapping was roughly conformal with a rotation of 11� and a scale factor of 2. Print resolution was 300dpi. Image size was 192 � 128.
The decoder outputs the 4 frequencies and the linear mapping between the scanned and original images. Fig. 7 (top) shows a scanned portion of Fig. 4 (right) that contains the embedded grid. It was scanned at 300dpi on an HP ScanJet IIc, and one can see that the image quality is poor. The page orientation was about 11� and the scanned image is a factor of 2 larger because the images in Fig. 4 were originally printed at twice their nominal size. Despite the poor image quality, the decoder extracted the frequencies and the linear mapping. We warped the scanned image using this mapping, the result of which is in Fig. 7 (bottom). We have tested this process on several images, showing that the amplitude of the embedded signal is su�cient to be detected by desktop scanners. Note
[1] I Cox, J Kilian, T Leighton, & T Shamoon. Secure spread spectrum watermarking for image, audio and video. Proc. IEEE ICIP, pp. 243{246, 1996. [2] D Hecht. Embedded data glyph technology for hardcopy digital documents. Proc. SPIE, vol. 2171, pp. 341{352, San Diego, 1994. [3] A Poirson & B Wandell. The appearance of colored patterns: pattern-color separability. J. Opt. Soc. Am. A, 10:2458{2471, 1993. [4] A Poirson & B Wandell. Pattern-color separable pathways predict sensitivity to simple colored patterns. Vision Res., 36:515{526, 1996. [5] M Schneider & S Chang. A robust content based digital signature for image authentication. Proc. IEEE ICIP, pp. 227{230, 1996. [6] M Swanson, B Zhu, & A Tew k. Transparent robust image watermarking. Proc. IEEE ICIP, pp. 211{214, 1996. [7] B Wandell. Foundations of Vision. Sinauer, Sunderland, MA, 1995. [8] G Wyszecki & W Stiles. Color Science. Wiley, New York, NY, 1982. [9] X Zhang & B Wandell. A spatial extension of cielab for digital color image reproduction. Proc. Soc. Inform. Display 96 Digest, pp. 731{734, San Diego, 1996.