A new deformable shape-based method for color region ... stages: over-segmentation using a traditional color region .... a region color compatibility term, 2.
Boston University Computer Science Technical Report 97-019, November, 1997.
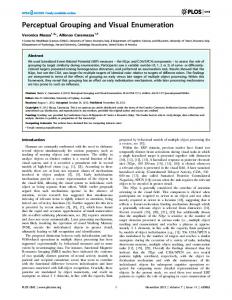
Color Region Grouping and Shape Recognition with Deformable Models Lifeng Liu and Stan Sclaroff Computer Science Department Boston University Boston, MA 02215 Abstract
forces that “pull” on the snake model. An “internal inflation” force can be used to expand a snake past spurious edges towards real edges of the structure, making the model less sensitive to initial conditions [5]. The snake formulation can be extended to include a term that enforces homogeneous properties over the region during region growing [4, 10, 12, 20]. This hybrid approach offers the advantages of both region-based and physics-based modeling techniques, and tends to be more robust with respect to model initialization and noisy data. However, it requires hand-placement of the initial model, or a user-specified seed point on the interior of the region. One proposed solution is to scatter many region seeds at random over the image, followed with segmentation guided via Bayes/MDL criteria [27]. Other approaches use special-purpose deformable templates [11, 15, 25, 26]. For instance, Yuille et al. [26] employ deformable templates to model facial features, such as eyes. The template-based approach allows for inclusion of object-specific knowledge in the model. This further constrains segmentation, resulting in enhanced robustness to occlusion and noise. Furthermore, the recovered template parameters can be used for shape recognition. Unfortunately, these methods require the careful construction and parameterization of templates. Deformable templates can be derived semiautomatically, via statistical analysis of shape training data [7, 16]. The estimated probability density function (PDF) for the shape deformation parameters can be used in ML-estimation of segmentation and in Bayesian recognition methods. Unfortunately, accurate estimation of the PDF depends on well-chosen initial model placement and careful labeling of features during training.
A new deformable shape-based method for color region segmentation is described. The method includes two stages: over-segmentation using a traditional color region segmentation algorithm, followed by deformable modelbased region merging via grouping and hypothesis selection. During the second stage, region merging and object identification are executed simultaneously. A statistical shape model is used to estimate the likelihood of region groupings and model hypotheses. The prior distribution on deformation parameters is precomputed using principal component analysis over a training set of region groupings. Once trained, the system autonomously segments deformed shapes from the background, while not merging them with similarly colored adjacent objects. Furthermore, the recovered parametric shape model can be used directly in object recognition and comparison. Experiments in segmentation and image retrieval are reported.
1 Introduction Segmentation using traditional low-level image processing techniques, such as region growing, edge detection, and mathematical morphology operations, requires a considerable amount of interactive guidance in order to get satisfactory results. Furthermore, automating these model-free approaches is difficult because of shape complexity, shadows, and variability within and across individual objects. In addition, noise and other image artifacts can cause incorrect regions or boundary discontinuities in objects recovered from these methods. A model based segmentation scheme, used in concert with image preprocessing, can overcome many of these limitations. The use of models in segmentation is not a panacea, however. Due to shape deformation and variation within object classes, a simple rigid model-based approach will fail in general. This realization has led to the use of deformable shape models in image segmentation.
1.1
1.2 New Approach To address these problems, we propose an approach that includes two stages: over-segmentation using a traditional color region segmentation algorithm, followed by deformable model-based evaluation of various region grouping hypotheses. During the second stage, a statistical shape model is used to enforce prior information on the likely deformations for a particular object. The shape model is trained once as a precomputation, using region segmentations provided in a training set.
Related Work
Previous work in this area is based on the deformable model paradigm of active contours or snakes [5, 13, 17, 21]. Snakes incorporate prior knowledge about a contour's smoothness and resistance to deformation. A regularized estimate of a contour is obtained by defining image edge 1
Once trained, the system autonomously segments colored objects from the background, while not merging them with similarly colored adjacent objects. In essence, region merging and object identification are done in tandem. As a result, the recovered model description can be used directly in object recognition and comparison. This approach has been tested in a shape-based image retrieval application.
(a)
Input Image Over−segmentation
Notable edge detection
(b) Candidate region 1
...
Candidate region n
(c)
Edge map
Figure 2: Example input and precomputations: (a) input color image, (b) initial over segmentation, (c) edge map
Select a group of regions from the candidate regions
A group of adjacent candidate regions
Deformable shape model
Match the model with this group of regions, and compute the cost of merging
(a)
No
(b)
Done testing all possible groups? Yes Select group with best merging cost and merge regions in this group if cost is less than threshold Repeat until no group has merging cost less than threshold.
(c)
Selected Groupings, Shape Descriptions
Figure 3: Example final segmentation result: (a) selected region groupings, (b) resulting model-guided region merging, (c) recovered parametric shape models.
Figure 1: System flow chart.
various over-segmentation factors, detecting region boundaries over the various scales, and then generating a map that integrates boundary strengths over scale [6]. The system then tests various combinations of candidate region groupings. In theory, the system should exhaustively test all possible combinations of the candidate regions, and select the best ones for merging; however, the computational complexity of such exhaustive testing is exponential, and the problem of finding the best group is NP complete. To make the problem tractable, region adjacency and the edge map constraints are used to prune the possible region grouping hypotheses. For each grouping hypothesis, we recover the model alignment and deformations needed to match the grouping. Downhill-simplex method is used to find the minimum cost configuration of the model. Our cost measure includes: 1.) a region color compatibility term, 2.) a region/model area overlap term, and 3.) a deformation term. The deformation term enforces a priori constraints on the amounts and types of deformations allowed for a particular deformable
2 System Overview In our system, a deformable model is used to guide grouping of color regions. A system flow chart is shown in Fig. 1. We will now give a brief overview of the segmentation process as it is applied to find banana shapes in the example color image in Fig. 2(a). First, the input color image is over-segmented via standard region-merging algorithms [2, 6]. The regions found by the over-segmentation module are shown in Fig. 2(b). The output of this module also includes a standard region adjacency graph. Using this over-segmentation, candidate regions for interesting objects are determined based on their color features. Next an edge map is computed for the input image, as shown in Fig. 2(c). The edge map is used to constrain consideration of possible grouping hypotheses later in region merging. Notable edges and their strengths can be detected via standard image processing methods. Alternatively, the map can be computed by segmenting the input image at 2
formation parameters. The strain energy is thus expressed in the template's deformation parameter space:
shape class (here bananas). We then compare the merging cost of different grouping hypotheses, selecting the hypothesis with minimum model cost. If the cost is less than a threshold, then the regions are merged. Any hypotheses that include these merged regions are then eliminated from further consideration. If any umerged grouping hypotheses remain, then we select the one with the minimum cost and repeat the procedure. If the cost exceeds the threshold or the hypothesis list is empty, then the procedure stops. The “best” region grouping hypotheses selected by the system for our example are shown in Fig. 3(a). These model-guided groupings are then merged in the color image segmentation, as shown in Fig. 3(b). Each selected grouping hypothesis has a recovered shape model associated with it, as shown in Fig. 3(c). The statistical shape model allows us to estimate the likelihood that the region grouping belongs to a particular shape class. Thus, the model parameters can be used directly in recognition. Experiments in using this approach will be described in Sec. 6.
Estrain = a~T K~a; a = �a + ~a;
a is a vector describing parametric displacement where ~ from some “rest” or expected state � a. 3.1 Statistical Model There is a well understood link between physicallymotivated deformable models and statistical estimation [24]. Splines were perhaps some of the first “physicallybased” models employed in statistical estimation [14]; they are particularly well-suited to modeling data sampled from a Markov Random Field (MRF), with Gaussian noise added [8]. The same principles hold true for regularization [3, 24], where the energies of a physical model can be related directly with measurement and prior probabilities used in Bayesian estimation [23]. Assume that the distribution on shape parameters for a particular shape category can be modeled as a multidimensional, unimodal Gaussian distribution. The distribution can be characterized by the mean � a and covariance �. The likelihood of a pattern a is given by:
3 Deformable Model Formulation In our formulation, shape is specified in terms of generic warping functions applied to template shapes. To deform the template, we define an N -dimensional vector of warping parameters, a, that describe a generic deformation:
x0 = f (x; a);
(2) (3)
�
�
exp ; 12 ~aT �;1~a : P (aj ) = (2�)N=2j�j1=2
(1)
where x is a point in the template before warping, and x 0 is the point afterwards. Perhaps the simplest warping functions to be used in Eq. 1 are those of a 2D affine model or an eight parameter projective model. Unfortunately, such functions can only approximate the rigid motion of a 3D planar patch. More suitable functions for modeling general non-rigid deformation include: higher-order polynomials, orthogonal basis functions, or finite element modal deformation functions [18]. To demonstrate the approach, we have implemented a system that uses linear and quadratic polynomials to model stretching, shearing, bending, and tapering. One advantage of the active models paradigm is that prior assumptions on contour smoothness and bending can be exploited to gain a regularized estimate of the true shape. To gain a regularized solution we minimize the strain energy incurred while deforming the model to fit the data. This results in robustness to noisy edge data and missing data. In the snakes formulation, smoothness and bending operators are defined over the control points of the model to obtain a stiffness matrix. In a parameterized template formulation, we instead define a stiffness matrix over the de-
(4)
The sufficient statistic for characterizing the likelihood is the Mahalanobis distance:
Edeform = ~aT �;1~a;
(5)
showing the connection between the strain energy equation of Eq. 3 and the Gaussian model. The covariance matrix can be obtained via a statistical analysis over a set of training shapes as will be explained in Sec. 5.
3.2 Eigen-Analysis The energy equations can be decoupled via an eigenvector transform. In the case of the stiffness matrix formulation, this approach is known as modal analysis [18], and in the case of the covariance matrix formulation, this is known as principal components analysis (PCA) [7]. In PCA, the covariance matrix is diagonalized by solving the eigenvalue problem:
� = �T ��;
(6)
where � is the eigenvector matrix and � is the corresponding diagonal matrix of eigenvalues. 3
The likelihood function can now be rewritten in terms of the eigenvalues and eigenvectors of the covariance matrix, yielding decoupled equations: h
2i
exp ; 21 Ni=1 b� P (aj ) = ; Q (2�)N=2 Ni=1 �1i =2 P
Notable region boundaries and their strengths can be detected via filtering with a Laplacian of Gaussian.Alternatively, the map can be computed by segmenting the input image at various over-segmentation factors, detecting region boundaries over the various scales, and then generating a map that integrates boundary strength over scale [6].
i i
(7)
where b = �T ~ a are the new variables obtained by the change of coordinates in a PCA. Similarly, the strain energy is transformed into a decoupled sum:
Edeform =
N X i=1
b2i : �i
4.1 Candidate Region Groupings To prime the region grouping process, candidate “interesting” regions are selected based on color characteristics; e.g., mean color, color histograms [22], or normalized color measures [9]. In our current system, each deformable template shape has an associated mean color. Mean region color is used to determine if the region may be part of any deformable shape models in the database (within some tolerance). This results lists of regions that may be candidates for fitting with particular shapes. The system then tests various combinations of candidate region groupings for each model. In theory, the system should exhaustively test all possible combinations of the candidate regions, and select the best ones for merging; however, the computational complexity of such exhaustive testing is exponential, and the problem of finding the best group is NP complete. To make the problem tractable, we need to introduce further constraints on search. In our system, there are two major constraints in the selection of candidate groupings. The first constraint is a spatial constraint: every region in a grouping hypothesis should be adjacent to another region in the same group. The second constraint is a region boundary compatibility constraint: if the boundary between two region is “strong,” then they cannot be combined in the same group. The boundary compatibility between two regions is precomputed as follows. An edge strength accumulator s edge is initialized to zero. For each of n pixels at the boundary between the two regions, the corresponding edge strengths at these pixels are added to the accumulator sedge . If sedge =n exceeds a threshold, then the pair of images are marked as incompatible, and cannot be combined into the same group. This constraint can also be embodied by deleting edges in the adjacency graph. Using these two constraints, we can reduce the number of grouping hypotheses that need to be tested. If need be, this number can be further reduced by considering only those groupings that include at least one region with relatively big area.
(8)
Template deformation is thereby regularized through the use of penalty terms �i in the statistical shape model. The eigenvectors correspond to the principal axes of the sub-vector space, and the eigenvalues are the corresponding principal variances. Although all eigenvectors are required to represent the distribution exactly, only a small number of vectors is generally needed to encode samples in the distribution within a specified tolerance. In practice, the first M eigenvectors are used, such that M is chosen to represent the variance in the dataset within some error threshold. The deformation parameter vector is thus apa + �b. proximated in the truncated basis: a � � It should be noted that the PCA parameter decoupling allows efficient and robust solution to the alignment problem. Furthermore, by discarding high frequency modes the amount of computation required can be reduced without significantly altering recovery accuracy. Finally, discarding the highest-frequency modes can also make recovery more robust to noise [18].
4 Segmentation and Model Fitting The deformable model will now be used to guide grouping and merging of color regions. The process begins with over-segmentation using a traditional color region segmentation algorithm [2, 6]. There are two goals of the initial over-segmentation procedure: to avoid the effects of background and clutter in the subsequent stages, and to guarantee that region from adjacent objects are not merged. Background and clutter regions will be culled later using a model-driven approach. Next, a region boundary map is computed for the input image. The is map records the edge strength at each pixel, and is used to constrain the consideration of candidate region groupings later in the segmentation process. Combining boundary information with region information also improves the accuracy and robustness of the algorithm.
4.2 Region Merging Cost Function Given a list of candidate region grouping hypotheses, we need to select the most likely ones. The statistical shape model is deformed to match each grouping hypothesis in 4
such a way as to minimize a cost function:
E = Ecolor + �Earea + Edeform ;
grouping hypothesis can be reused for another, thereby speeding convergence. In order to further accelerate matching, a multipleresolution is employed. The over-segmented image is first sub-sampled at various scales (without blurring). Each grouping hypothesis is first matched with the shape model in the lowest resolution image. The model fit at that resolution is then used as input at the next level of resolution, etc. In our experience, this approach significantly speeds convergence while also avoiding local minima.
(9)
where � and are scalars that control the relative importance of the three terms: Ecolor is a region color compatibility term, Earea is a region/model area overlap term, and Edeform is the deformation energy from Eq. 8. The region color compatibility is simply the sum of the < r; g; b > variance for the pixel colors within the grouping. The region/model area overlap term takes the form:
S S Earea = G 2 m ; Sc
4.4 Region Hypothesis Selection (10)
Once all hypotheses have been fitted with shape models, we then compare the merging cost of different grouping hypotheses, selecting the hypothesis with minimum model cost. If the cost is less than a threshold, then the regions are merged. Any hypotheses that include these merged regions are then eliminated from further consideration. If any unmerged grouping hypotheses remain, then we select the one with the minimum cost and repeat the procedure. If the cost exceeds the threshold or the hypothesis list is empty, then the procedure stops.
where SG is the area of the region grouping hypothesis, S m is the area of the deformed model, and S c is the common area between the regions and deformed model. By using the degree of overlap in our cost measure, we can avoid measuring distances between region boundaries and corresponding model control points. Hence we can avoid the problem of finding direct correspondence between landmark points, which is not easy in the presence of large deformations.
5 Model Training 4.3
Model Fitting Procedure
Assume that we are given a template model defined by the operator. In our current system, the template is defined by the operator as a polygonal model. During model training, the system is first presented with a collection of color images. These images are first over-segmented as described in the previous section. In the first images, the operator is asked to mark candidate regions in the same object. The system then merges the regions and uses downhillsimplex method to minimize the cost function in Eq. 9, thereby matching the template to the training regions. In the first training images, the shape term is ignored ( = 0 in Eq. 9). It is possible to extend this approach so that the system gets more independent as training progresses. As more training data is processed, the parameter can be increased and used to semi-automate training of the system. The system can be allowed to take a “first guess” at the correct region grouping and present it to the operator for approval. After a few training images, the system also has some idea of the “color of interest.” This information is used to winnow regions considered for marking by the operator in subsequent training images. This approach is in stark contrast with the PCA method described in [7], where objects are represented as sets of labeled points. When different feature points are present in different views, or if there are different sampling densities in different views, then the shape matrix for the two views will differ even if the object's pose and shape are identi-
Shape matching is defined in terms of minimizing a nonlinear cost function. If the gradient method is used to search for the optimal solution, the step size is difficult to choose. In addition, the effects of the shape parameters are not independent. We have no guarantee that a traditional gradient-based minimization method will converge to the global minimum location, unless we are given an initial placement of the model that is close to the minimum already. This “initial pose problem” is a known weakness of many deformable model recovery schemes. Approaches to solving this have been suggested: graduated non-convexity [3], multi-grid approaches [24], and nonlinear programming methods [1]. In our system, we employ the downhill-simplex method [19] because it requires only function evaluations, not derivatives. Downhill-simplex method must be started not just with a single point, but with N + 1 points defining a initial simplex (where N is the number of variables in the function). For a new group of candidate regions, from the area of the group and its centroid, we can estimate the scale factor and translation parameters, then we sample N + 1 rotation parameters uniformly over the range [0; 2� ], and compute the initial templates of varying orientation. The downhillsimplex algorithm is then used to adjust the parameters until convergence is obtained. Some grouping hypotheses have considerable common regions. In such cases, the matching parameters for one 5
(a) (a) (b) (b)
(c) (c)
Figure 4: Example of segmenting a synthetic image using an affine-deformable rectangle model: (a) original image, (b) oversegmentated image before model-guided merging, (c) selected model-guided color region merging.
(d)
(e)
Figure 5: Some grouping hypotheses tested in segmenting a synthetic image of Fig. 4: each region grouping hypothesis is shown in green, with the corresponding model fit shown in red. Hypotheses (a,b,c) were tested but not selected by the system, while (d,e) were the winning hypotheses.
cal. In addition, this method cannot incorporate information about feature connectivity or distinctiveness; data are treated as clouds of identical points. Most importantly, this approach cannot handle large deformations unless feature correspondences are given. These problems are averted by the region merging approach combined with the downhill simplex method for deformable model fitting.
ing a simple banana shape model that was trained using 40 example images of bananas at varying orientations and scales. These training images were not contained in our test image data set.
6 Examples To demonstrate the approach, we have implemented a system that uses linear and quadratic polynomials to model stretching, shearing, bending, and tapering. The system was implemented on an SGI Indy R5K workstation. All performance statistics are reported for unoptimized code. The first example is intended to show how the grouping hypothesis selection process works. The input image shown in Fig. 4(a) has two similarly-colored adjacent quadrilaterals with ellipses painted on each. The color within each of the image region varies. After the initial over-segmentation, the image is labeled with five regions as shown in Fig. 4(b). The system then built a list of various region grouping hypotheses to be tested. Each grouping hypothesis was tested against a deformable quadrilateral model that was trained for affine projections of rectangular planar faces. The resulting model-guided merging of the segmented image is shown in Fig. 4. Total time for over-segmentation, hypothesis generation, fitting, and merge selection was under one minute. Fig. 5 shows a number of region grouping hypotheses and resulting deformable model fit. The region groupings are shown in green, while recovered models are shown in red. The best region groupings were selected via the fitting cost function, as was described in Sec. 4. As shown in the figure, hypotheses (a,b,c) were tested but not selected by the system, while (d,e) were the two winning hypotheses. In the next example, we test the system in an image retrieval application. We demonstrate the approach us-
All images in the test data set were then segmented using the trained model as described in Sec. 4. The recovered model deformation parameters for the selected region grouping hypotheses were stored for each image. If the image had multiple yellow objects, then the system stored a list of model descriptions for that image. These descriptions were found as a precomputation, and took approximately between 30 seconds and three minutes per image on and SGI R5K Indy workstation. Once descriptions are precomputed, shape-based queries can be answered in interactive time. An example search with our system is shown in Fig. 6. The user selected the image shown in Fig. 6(0). The system retrieved images that had similar shapes, here shown in rank order (1-17). The most similar shapes are other bent bananas of similar aspect ratio. Yellow squash shapes were ranked less similar. The corresponding region grouping is shown below each of the original images in the figure. Note that the system correctly grouped regions despite shadows, lighting conditions, and deformation. Especially notable are cases where multiple yellow shapes are abutting each other (Fig. 6(3,7,12,14)). Due to the use of model-based region merging, our system is able to avoid merging similarly colored, adjacent but separate objects. The approach is also adept at avoiding merging objects with their similarly-colored shadows. 6
(0)
(1)
(2)
(3)
(4)
(5)
(6)
(7)
(8)
(9)
(10)
(11)
(12)
(13)
(14)
(15)
(16)
(17)
Figure 6: Image retrieval example. The user selected an example image (0). The original color image and corresponding precomputed region grouping are shown. The system retrieved shapes found in the database and displayed them in rank similarity order (1-17). The segmented shape is shown below each original database image. If an image contained more than one yellow shape, it is shown more than once in the retrieval (once per shape). Note that the most similar shapes are other bent bananas of similar aspect ratio. Yellow squash shapes were ranked less similar.
7 Discussion
algorithm can detect the whole object correctly, at the same time, avoid merging objects with background and shadow, or merging adjacent multiple objects. Each selected grouping hypothesis has a recovered shape model associated with it; thus, the model parameters can be used directly in recognition as was demonstrated in the shape-based image retrieval example. In previous approaches to deformable model-based segmentation, initial model placement is either given by the operator, or by exhaustively testing the model in all orientations, scales, and deformations centered at every pixel in the image. A region-based approach significantly reduces the need to test all model positions.
Retrieval by shape is considered to be one of the most difficult aspects of content-based image database search. A major part of the problem is that many techniques assume that shapes have already been detected and segmented from background. This limits the utility of such techniques for applications in which automatic indexing is required. Our approach offers a way around this problem. Perhaps the major limitation of our current method is that it cannot handle large occlusions. Our next goal is to combine the mixture model into our system, so with allowing overlapping, our system will be able to deal with occlusion. Issues of computational complexity were addressed through the use of various constraints as was described in Sec. 4, and the use of multi-scale segmentation. However, the worst-case complexity is still daunting in cluttered imagery and needs to be improved. Based on the statistical shape model, our segmentation
References [1] A. Amini, T. Weymouth, and R. Jain. Using dynamic programming for solving variational problems in vision. PAMI, 12(9), 1990. [2] J. Beveridge, J. Griffith, R. Kohler, A. Hanson, and E. Rise-
7
man. Segmenting images using localized histograms and region merging. IJCV, 2(3), 1989.
[24] D. Terzopoulos. Regularization of inverse visual problems involving discontinuities. PAMI, 8(4), 1986.
[3] A. Blake and A. Zisserman. Visual Reconstruction. M.I.T. Press, 1987.
[25] D. Terzopoulos. On matching deformable models to images: Direct and iterative solutions. In OSA Technical Digest Series vol. 2, 1987.
[4] A. Chakraborty, L. Staib, and J. Duncan. Deformable boundary finding influenced by region homogeneity. In CVPR, 1994.
[26] A. Yuille, D. Cohen, and P. Hallinan. Feature extraction from faces using deformable templates. IJCV, 8(2), 1992. [27] S. Zhu and A. Yuille. Region competition: Unifying snakes, region growing, and bayes/mdl for multiband image segmentation. PAMI, 18(9), 1996.
[5] L.D. Cohen. On active contour models and balloons. CVGIP:IU, 53(2), 1991. [6] D. Comaniciu and P. Meer. Robust analysis of feature spaces: Color image segmentation. In CVPR, 1997. [7] T. Cootes, A. Hill, C. Taylor, and J. Haslam. Use of active shape models for locating structure in medical images. I&VC, 12(6), 1994. [8] S. Geman and D. Geman. Stochastic relaxation, Gibbs distribution, and Bayesian restoration of images. PAMI, 6(11),1984. [9] G. Healey. Segmenting images using normalized color. IEEE T. on Sys., Man, and Cyb., 22, 1992. [10] J. Ivins and J. Porrill. Active-region models for segmenting textures and colors. I&VC, 13(5), 1995. [11] A. Jain, Y. Zhong, and S. Lakshmanan. Object matching using deformable templates. PAMI, 18(3), 1996. [12] T. Jones and D. Metaxas. Segmentation using deformable models with affinity-based localization. CVRMed, 1997. [13] M. Kass, A. Witkin, and D. Terzopoulos. Snakes: Active contour models. IJCV, 1(4), 1988. [14] G. Kimeldorf and G. Wahba. A correspondence between Bayesian estimation and on stochastic processes and smoothing by splines. Annals of Math. Stat., 41(2), 1970. [15] K. Mardia, W. Qian, D. Shah, and K. Desouza. Deformable template recognition of multiple occluded objects. PAMI, 19(9), 1997. [16] J. Martin, A. Pentland, and R. Kikinis. Shape analysis of brain structures using physical and experimental modes. In CVPR, 1994. [17] T. McInerney and D. Terzopoulos. Topologically adaptable snakes. In ICCV, 1995. [18] A. Pentland. Automatic extraction of deformable part models. IJCV, 4(2), 1990. [19] W. Press, B. Flannery, S. Teukolsky, and W. Vetterling. Numerical Recipes in C. Cambridge U. Press, 1988. [20] R. Ronfard. Region-based strategies for active contour models. IJCV, 13(2), 1994. [21] L. Staib and J. Duncan. Boundary finding with parametrically deformable models. PAMI, 14(11), 1992. [22] M. Swain and D. Ballard. Color indexing. IJCV, 7(1), 1991. [23] R. Szeliski. Bayesian Modeling of Uncertainty in Low-Level Vision. Kluwer Academic, 1989.
8