*Department of Computer Science. Polytechnic University of the Philippines. Manila, Philippines. ** Gokongwei College of Engineering. De La Salle University.
2013 International Conference of Information and Communication Technology (ICoICT)
Object Recognition and Detection by Shape and Color Pattern Recognition Utilizing Artificial Neural Networks Jerome Paul N. Cruz*, Ma. Lourdes Dimaala*, Laurene Gaile L. Francisco*, Erica Joanna S. Franco*, Argel A. Bandala**, Elmer P. Dadios** *Department of Computer Science Polytechnic University of the Philippines Manila, Philippines
** Gokongwei College of Engineering De La Salle University Manila, Philippines
Abstract — A robust and accurate object recognition tool is presented in this paper. The paper introduced the use of Artificial Neural Networks in evaluating a frame shot of the target image. The system utilizes three major steps in object recognition, namely image processing, ANN processing and interpretation. In image processing stage a frame shot or an image go through a process of extracting numerical values of object’s shape and object’s color. These values are then fed to the Artificial Neural Network stage, wherein the recognition of the object is done. Since the output of the ANN stage is in numerical form the third process is indispensable for human understanding. This stage simply converts a given value to its equivalent linguistic term. All three components are integrated in an interface for ease of use. Upon the conclusion of the system’s development, experimentation and testing procedures are initiated. The study proved that the optimum lighting condition opted for the system is at 674 lumens with an accuracy of 99.99996072%. Another finding that the paper presented is that the optimum distance for recognition is at 40cm with an accuracy of 99.99996072%. Lastly the system contains a very high tolerance in the variations in the objects position or orientation, with the optimum accuracy at upward position with 99.99940181% accuracy rate. Keywords- object recognition; artificial neural networks; vision system; (ANN, pattern recognition, object detection)
Numerous attempts are done to realize object recognition such as in [3] that used the principle of visual vocabulary. Another approach in [4] is introduced, wherein fuzzy logic is used to detect an object based on its color. Finally in [5] a combination of artificial neural networks and fuzzy logic is utilized to evaluate an object based on a visual and audio information.
H
I.
INTRODUCTION
umans recognize a multitude of objects and images with little effort, despite the fact that the image of the objects may vary in different viewpoints, sizes or even when they are rotated. For instance, when a human sees a hand regardless whether it’s open or not, he still recognizes it as a hand. Object recognition has been man’s daily lifestyle. The more often a person sees an object the more he gets familiar with it [1]. In object recognition, it was known that the human brain processes visual information in semantic space mainly, that is, extracting the semantically meaningful features such as line-segments, boundaries, shape and so on [1]. As for computers, it is a challenge than what humans regard as the simple process of recognition [2].
978-1-4673-4992-5/13/$31.00 ©2013 IEEE
140
In this study, the researchers developed a system which explored the possibility of creating a vision system that recognizes an object regardless of its viewpoint and illumination through artificial neural networks. Furthermore the study can serve as the stepping stone to more sophisticated object detection systems enabling them to consider Artificial Neural Networks. II.
ARCHITECTURE OF THE SYSTEM
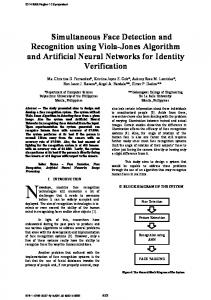
Figure 1 shows the block diagram of the designed system. As can be seen there are three main blocks used in the system. The image processing block deals with extracting numerical characteristics of an object from a frame of the input video information. The neural network block is in charge of dispensation of the numeric characteristics from the image processing block. Lastly, the interpretation of data block translates the numeric output of the neural network block to its equivalent linguistic meaning.
Figure 1. The General Block Diagram of the System
2013 International Conference of Information and Communication Technology (ICoICT)
A. IMAGE PROCESSING BLOCK Figure 2 shows a sample grabbed frame from an input video stream. As shown, the image is placed under a uniformly white background. The image is then processed to extract numerical values. The first step is to transform the original image into its equivalent grayscale image then to a binary image shown in figure 3.
row or a column not included in the image would generate a sum of zero since the background is white.
Figure 4. Binary Equivalent of the Input Image A similar image in figure 3 with color characteristics can be produced using the same boundaries calculated from the equations 1a and 1b. Figure 4 illustrates the said image.
∑
∑
∑
,
∑
,
Figure 2. Image Snapshot from Input Stream
Figure 3. Binary Equivalent of the Input Image As showed in figure 3 the image is cropped to fit the size of the object from top to bottom and left to right. Since the position of the object is arbitrary which depends on the placement of the user, the system must determine where the object is. This is commonly known as object detection. This was realized when dynamic cropping process was implemented.
The first output of this block is calculated by equation 2. The distribution of colors within the are the cropped image is characterized. , , , same values derived from equation 1a and 1b. , is the cropped image matrix from the boundaries generated from equation 1a and 1b. The second output of this block is given by equation 3. The identity of each pixel against the overall distribution of color in the image is identified.
,
,
Figure 5. Resized Binary Image
The boundaries of cropping to obtain figure 3 is calculated by equations 1a and 1b. These equations are applied to the binary image drawn from the raw image. , is the original image matrix. is the sum of the pixel values of each rows. is the sum of is the top the pixel values of each columns. boundary of the image to be cropped and the first is the bottom boundary vertical pixel of the object. of the image to be cropped and the last vertical pixel. is the left most boundary of the image to be cropped is the right most and the first horizontal pixel. boundary of the image to be cropped and the last horizontal pixel. Generally, equations 1a and 1b calculates the sum of each rows of the image pixel matrix and the sum of each column of the image pixel matrix. Thus, a
978-1-4673-4992-5/13/$31.00 ©2013 IEEE
141
Furthermore, figure 3 is resized into a 25x25 image matrix resulting into an image shown in figure 5. Each row and each column of the said image is summed resulting into 50 distinguished numbers. These will be the set of output of the image processing block that will characterize the shape of the target image and characterized in equations 4a and 4b.
,
,
2013 International Conference of Information and Communication Technology (ICoICT)
B. ARTIFICIAL NEURAL NETWORKS BLOCK
∑
∑
∑ ∑
∑ ∑
…
5
6
Where: b is the bias of a neuron w is the weight of a neuroon , input vector of ith exam mple is the desired (target) response r of ith example N is the sample size
… …
A Neural Figure 6. Architecture of the Artificial Network work used in this The artificial neural netw study utilizes the feed forward archhitecture. As can be seen in figure 6 the flow of inform mation is from the neurons in the left towards the neuurons on the right. There are 52 input neurons 20 hiddeen neurons and five output neurons. The 52 input neurons aree composed of two neurons for color characteristics of o the image to be detected namely and . Furtherm more the remaining 50 neurons is subdivided into two 25 of which is for to and the horizontal shape characteristiccs vertical shape characteristics to . n which are There are five output neurons defined to generate binary numbers. Each combination of binary numbers will represent a certain object. The assignment of binary output in eachh input is associated during the training stage. Each neuron has a construuction characterized by figure 7. The neuron is compposed of a weight, which is a numerical element multtiplied to the input numerical value, a bias which is addded to the product of the input and the weight. The sum m will be evaluated in an activation function that will generate an output numerical value.
Figure 7. Neuron Archiitecture
978-1-4673-4992-5/13/$31.00 ©2013 IEEE
∑
142
The value of thhe weight and bias varies in every neuron. The processs of determining the value of weight and bias is calleed learning or training. The algorithm used for learniing is called back propagation algorithm. In this learninng method, a desired output or target is given with a coorresponding set of inputs. In the architecture of the arrtificial neural networks, back propagation algorithm reequires 52 input elements and five output or target elem ments per set. The calculation of bias is given in equuation 5 while the weight is defined in equation 6.
OCK C. INTERPRETATION BLO
The output off the neural network is in i the training stage. Table 1 numeric form assigned in shows a tabulation of o eight objects and its corresponding output value from the artificial neural network. In the event thatt a bit is less than 1 or greater than zero the interpretatiion block rounds up or down the output value to attainn a value in table 1 closest to the output of the artificiall neural network. Table1. Association n of Output Values to its Equivaalent Object Binary Output 00001 00010 00011 00100 00101 00110 00111 01000
Equivalent Object Writing instrument Coin Headband Key Razor Tweezers Flash drive Whistle
2013 International Conference of Information and Communication Technology (ICoICT)
III.
GRAPHICAL USER INTERFACE
The researchers developedd a graphical user interface which is capable to accom mmodate all of the processing and calculation for objeect recognition and also caters ease of use in the useer’s viewpoint. The graphical user interface is designedd and implemented in C# language. Calculations and a some specific processes are done in Matlab. Thhe study integrated these two languages to producce a tool which accommodates all of these objectivees. Figure 8 presents the desiggn of the interface. As can be seen there are three optiions available. First is the “connect button”, this option enables the user to operate or turn on the display winndow by evaluating which camera is available. The user can also choose t options in the what camera to use by altering the “camera devices” option. The seccond option is the “disconnect” button, this is used for terminating an existing camera connection. Lastly, the analyze option is used to trigger the recognition prrocesses in the view window.
and 906 lumens an avverage of 99.99% accuracy emerged for all distancess. Lastly, for light intensity of 1098 lumens, the highest accuracy rate was given by m with an accuracy rate of the distance of 40 cm 99.96284%. On the otheer hand in this light intensity the lowest accuracy raate was recorded at 50cm distance with an accuracyy rate of 97.93216%. It can be seen that the lesser thee light the accuracy of the recognition is lesser beccause ample light intensity is not achieved. However, too much light may cause glair. Thus, the object may reflect too much light c resulting to loss of color characteristics.
Figure 9. Experimentt Results Accuracy against Lightt Intensity
Figure 8. The Graphical User Interfaced of the System IV.
E EXPERIMENT RESULTS
The system’s performancee is evaluated with several experimental setups that will test certain parameters which are consideredd to be vital in producing accurate recognition. There are three meter tested is the parameters tested. The first param intensity of illumination in the objject to be detected. Another parameter is the distance of o the object to the camera. Lastly is the orientation or rotation of the object. The experiments for eveery parameters are composed of a setup drawing 2000 experiment data from 200 trials. mance of the system Figure 9 shows the perform when varying the light intensity in the object. As can be seen three distances are used whiile varying the light intensity on a given object. For a lesser value of light intensity at 318 lumens the highest accuracy rate is found at 30cm distance which yieeld an accuracy of 99.90847% and the lowest accuracyy rate is at distance 50cm. For light intensities 451 luumens, 674 lumens
978-1-4673-4992-5/13/$31.00 ©2013 IEEE
143
Figure 10 exhibbits the experiment result in varying the distance of thhe target image to the camera. There are three distancces used in this experiment: 30cm, 40cm, and 50cm. As can be seen, all of these distances yield an aveerage accuracy of 99.99% however the least accuraate distance is 30cm with an accuracy of 99.9997%. When W the distance is increased at 40cm, the accuracyy increased to 99.99989%. Further, increase in distaance at 50 cm decreased the accuracy at 99.99995%. These results can foretell that w decrease the accuracy of having a closer camera would recognition rate but allocating too much distance would also result in decrease in accuracy of recognition rate.
Figure 10. Experimentt Results Accuracy against Distancce of Object
2013 International Conference of Information and Communication Technology (ICoICT)
Finally figure 11 shows the experiment results of varying the orientation of the object against the accuracy of recognition rate. As can be seen in all angles tested, the average recognition rate is above 99.95% with the highest accuracy rate at zero degrees or upright position of the object being evaluated. Also, the orientation of the object has no significant effect on the recognition process. It is because the orientation characteristics of the image are included in the learning or training stage in the study.
Figure 11. Experiment Results Accuracy against Orientation of the Object V.
CONCLUSIONS
Upon accomplishing experimentations, the paper presents the following generalizations. The system’s performance varies with the lighting condition with a recommended lighting range of 318 lumens with 99.71139% accuracy to 1089 lumens with 97.93216% accuracy. The optimum lighting condition is at 674 lumens with an accuracy of 99.99996072%. The distance of the camera has a substantial contribution to the recognition of an image which ranges from a minimum of 30cm with a registered accuracy of 99.99892032% and a maximum of 50 cm with a registered accuracy of 99.99987787%. The optimum distance for recognition is found to be at 40cm with an accuracy of 99.99996072%. Lastly the system contains a very high tolerance in the variations in the objects position or orientation, with the optimum accuracy at upward position with 99.99940181% accuracy rate. REFERENCES [1] Bo Zhang, "Computer Vision vs. Human Vision," in 9th IEEE International Conference on Cognitive Informatics (ICCI), 2010, p. 3. [2] Nicolas Pinto, David D. Cox, and James J. DiCarlo, "Why is Real-World Visual Object Recognition Hard?," PLoS Computatioinal Biology, pp. 151-156, January 2008. [3] Su Yu-Chi et al., "A 52 mW Full HD 160-Degree Object Viewpoint Recognition SoC With Visual Vocabulary Processor for Wearable Vision Applications," IEEE Journal of Solid-State Circuits, vol. XLVII, no. 4, pp. 797 - 809 , 2012. [4] Napoleon H Reyes and Elmer P Dadios, "A Fuzzy
978-1-4673-4992-5/13/$31.00 ©2013 IEEE
144
Approach in Color Object Detection," in IEEE International Conference on Industrial Technology IEEE ICIT , Bangkok, 2002, pp. 232 - 237. [5] Shahnaz Shahbazova, Manfred Grauer, and Musa Suleymanov, "The Development of an Algorithmic Model for Object Recognition From Visual and Sound Information – Based on Neuro-Fuzzy Logic," in Annual Meeting of the North American Fuzzy Information Processing Society (NAFIPS), El Paso, Texas, 2011, pp. 1 - 6.