standard machine learning techniques tend to be overwhelmed by the large classes. This paper rebalances skewed datasets by compressing the majority class.
Combine Vector Quantization and Support Vector Machine for Imbalanced Datasets Ting Yu, John Debenham, Tony Jan and Simeon Simoff Institute for Information and Communication Technologies Faculty of Information Technology, University of Technology, Sydney, PO Box 123, Broadway, NSW 2007, Australia Capital Markets Cooperative Research Centre, Australia {yuting, debenham, jant, simeon}@it.uts.edu.au
Abstract. In cases of extremely imbalanced dataset with high dimensions, standard machine learning techniques tend to be overwhelmed by the large classes. This paper rebalances skewed datasets by compressing the majority class. This approach combines Vector Quantization and Support Vector Machine and constructs a new approach, VQ-SVM, to rebalance datasets without significant information loss. Some issues, e.g. distortion and support vectors, have been discussed to address the trade-off between the information loss and undersampling. Experiments compare VQ-SVM and standard SVM on some imbalanced datasets with varied imbalance ratios, and results show that the performance of VQ-SVM is superior to SVM, especially in case of extremely imbalanced large datasets.
1
Introduction
The class imbalance problem typically occurs when, in classification problem, there are many more instances of some classes than other. In cases of extremely imbalanced (skewed) dataset with high dimensions, standard classifier tends to be overwhelmed by the large classes and ignore the small ones. Therefore, machine learning becomes an extremely difficult task, and performances of normal machine learning techniques decline dramatically. In practical applications, the ratio of the small to the large classes can be drastic such as 1 to 100, or 1 to 1000 [1] . The recent Sigkdd explorations published a special issue on learning from imbalanced data sets [1], which summarized some well-known methods for dealing with problems with the imbalanced data: at the data level, undersampling and oversampling; at the algorithms level, one-class learning (cost-sensitive learning) and boasting etc.
2
Ting Yu, John Debenham, Tony Jan and Simeon Simoff
Random undersampling can potentially remove certain important examples, and random oversampling can lead to overfitting. In addition, oversampling can introduce an additional computational task if the data set is already fairly large but imbalance. A few researches of combining data compression techniques and machine learning have been done: Jiaqi Wang el at [2] combines K-means clustering and SVM to speed up the real-time learning; Smola el at [3] discussed the combination between VQ and SVM in their book. At the algorithms level, for SVMs, cost-sensitive learning [5, 6, 7] aims to incorporate into the SVMs the prior knowledge of the risk factors of false positives and false negatives. Gang Wu el at [8] implemented KBA, Kernel Boundary Alignment to imbalanced datasets. Rehan Akbani el at [4] implemented SMOTE, a derivative of Support Vector Machine, to imbalanced datasets and discussed the drawbacks of random undersampling. Being different from the random undersampling, VQ compresses datasets by clustering them instead of simply eliminating instances.
2. Support Vector Machine Support Vector Machine and other kernel methods were maturated and implemented broadly in 1990s, after Vapnik [9]. Support Vector Machine transforms (approximates) the nonlinear problem within a lower dimension space (input space) into a linear problem within a higher dimension space (feature space). Within this linear feature space, SVM could be treated as a linear learning machine, which finds a maximum margin hyper-plane to separate the given data with some tolerance (slack variables) to the noise. Vapnik-Chervonenkis (VC) dimension restricts the degree of approximations (generalization). Decision Function of support vector classification (pattern reorganization): m
m
i =1
i =1
f ( x) = sgn( ∑ y i α i Φ ( x), Φ( x i ) + b) = sgn( ∑ y i α i k ( x, x i ) + b)
(1)
and the following quadratic program: m
max W (α ) = ∑ α i − 12 α ∈R i =1
m
∑ α i α j y i y j k ( xi , x j )
i , j =1
(2)
m
subject to α i ≥ 0 for all I=1, …, m, and ∑ α i y i = 0 i =1
3. Vector Quantization Vector quantization (VQ) is a lossy data compression method based on the principle of block coding. According to Shannon’s theory of data compression, lossy data compression, better known as rate-distortion theory, the decompressed data does not have to be exactly the same as the original data. Instead, some amount of
Combine Vector Quantization and Support Vector Machine for Imbalanced Datasets
3
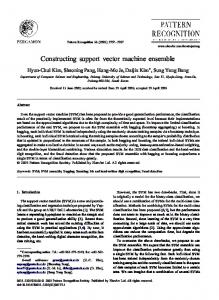
distortion, D, is tolerated. Moreover the lossless compression is no distortion, i.e. D=0. In 1980, Linde, Buzo, and Gray (LBG) [10] proposed a VQ design algorithm based on a training sequence. The use of a training sequence bypasses the need for multi-dimensional integration required by previous VQ methods. A VQ that is designed using this algorithm are referred to in the literature as an LBG-VQ, which can be stated as follows. Given a vector source with its statistical properties known, given a distortion measure, and given the number of codevectors, find a codebook (the set of all red stars) and a partition (the set of blue lines) which result in the smallest average distortion [11].
Fig. 1. A simple example of two-dimensional LBG-VQ [11]
Suppose a training sequence consisting of M vectors: T = { x1, x 2 ,..., x M } , and N codevectors C = {c1 ,c 2 ,...,c N } , then the whole region is partitioned by the codevectors into a set of sub-regions, so-called “Voronoi Region”, P = {S1 , S 2 ,..., S N } . Vectors within a region S n are represented by their codevector Q( x m ) = c n if xm ∈ S n , and the average distortion can be given by: D ave =
1 M ∑ || x m − Q(x m ) || Mk m =1
which measures the information loss. Thus, the design problem can be stated as: to find C and P such that D is minimized. If C ad P are a solution to the above minimization problem, then is must satisfy two criteria: Nearest Neighbour Condition, S n = {x :|| x − c n || 2 ≤|| x − c n' || 2 ∀n' = 1,2,..N } , and Centroid Condition: ∑ xm∈S n xm , n=1, 2, .., N. cn = ∑ x ∈S 1 m
n
The LBG VQ design algorithm is an iterative algorithm, which alternatively solves the above two optimality criteria. The algorithm requires an initial codebook. This initial codebook is obtained by the splitting method. In this method, an initial
4
Ting Yu, John Debenham, Tony Jan and Simeon Simoff
codevector is set as the average of the entire training sequence. This codevector is then split into two. The iterative algorithm is run with these two vectors as the initial codebook. The final two codevectors are splitted into four and the process is repeated until the desired number of codevectors is obtained [11].
4. VQ-SVM to Rebalance Dataset VQ-SVM combines Vector Quantization and Support Vector Machine for dealing with extreme imbalance datasets, in which standard Support Vector Machine losses its accuracy dramatically. Here Vector Quantization could be treated as another way for incorporating domain knowledge into Support Vector Machine. In this case, the domain knowledge is the imbalance ratio and distribution of the majority group. Similar research can be found at authors’ other papers [12, 13]. Pseudo-code of the algorithm VQ-SVM: /* Step 1: Set parameters of VQ-SVM */ Float g; //the kernel parameter g Int number_of_undersampling; // the number of code-vectors /* LBG-VQ compresses the majority group and reduces the number of instances down to the given number, and then the new group and the minority group are combined to construct a balanced training dataset */ Balanced_Majority = LBGvq(Majority, number_of_undersampling); New_training_data = combine(Balanced_Majority, Minority); /* SVM based on the new balanced data*/ Model = SVM (New_training_data, g); Under-sampling the frequency of the majority class, e.g. random undersampling, has its drawbacks and results in information loss. Support Vector Machine selects a subset of instances along the hyper-plane, so-called support vectors, and used them as the set of xi within the decision function (1). These support vectors lie within the margin, and their α i s are non-zero, 0 < α i < C . That is: as the hyperplane is completely determined by the instances closest to it, the solution should no depend on the other examples [3]. The random undersampling inevitably reduces the number of support vectors, and thus potentially losses information with these removed support vectors. According to the theory of data compression, vector quantization is superior to random undersampling in term of the information loss, but both of them suffer from another risk of information loss within the majority group: Vector Quantization replaces some original SVs by their corresponding codevectors, which become new SVs and push the optimal hyperplane away from the original one trained by imbalanced data (cf. figure 2). Rehan Akbani el at [4] and Gang Wu el at [8] found that in case of imbalanced dataset, SVM always pushes the hyperplane towards
Combine Vector Quantization and Support Vector Machine for Imbalanced Datasets
5
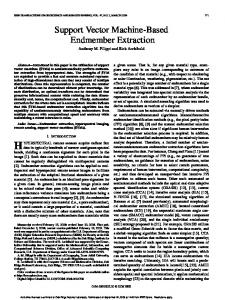
minority group, which causes that the learning machine is overwhelmed by the majority group and minority group losses its information completely. Original SVs New Hyperplane
Original Hyperplane Majority class
Minority class
Fig. 2. VQ replaces the observations (yellow points) of majority group by codevectors (red points), the number of which is more equal to the number of observations (grey points) of the minority group. However, the imbalanced maximum margin hyperplane (dashed line) is pushed towards a new position (solid line), which is much closer to the majority group.
Throughout reducing the number of SVs of the majority group, VQ-SVM pulls the biased hyperplane away from the minority group. That is more close to the underlying “real” boundary. VQ-SVM sacrifices the information held by the majority group to retrieval the information contained by the minority group. This is very important in many real life practices, which focus on the minority group. On the other hand, the compression ratio is tuned by the VQ-SVM to minimize the information loss of majority group. Therefore the optimal model is a trade-off between the compression rate and improved data balance, classification accuracy (i.e. g-means).
5. Experiments For this evaluation, we used four UCI datasets. Those UCI datasets we experimented with are abalone (abalone19), yeast (yeast5) glass (g7), and letter (letter26). The number in the parentheses indicates the target class we chose. Table 1 shows the characteristics of these six datasets organized according to their negativepositive training-instance ratios. The top dataset (abalone 19) is the most imbalanced (the ratio is about 1:130). The four datasets mostly consist of continuous data instead of categorical data. Table 1. Four UCI datasets with different compression rates: in the letter (26) dataset, the results of two compression rates demonstrate the effect of “overcompression”. Through the initial exploration, the minority class is not linearly
6
Ting Yu, John Debenham, Tony Jan and Simeon Simoff
separated, and that is said, the minority class randomly scatters within the majority class. Dataset Positive Negative Insts Imbalance Insts after underInsts Ratio sampling Abalone (19) 32 4145 1:129.54 32 Yeast (5) 47 1437 1:30.5 64 Letter (26) 734 19266 1:26.28 299 (1024) 550(2048) Glass (7) 29 185 1:6.3 32 Because it is expected that undersampling at high rates generate a trade-off between improved data balance and loss of important information, we examined whether different compression rate could lead to a further enhancement of results. The machine learning community use two metrics the sensitivity and the specificity, when evaluating the performance of various tests. Sensitivity can be defined as the accuracy on the positive instances: True Positives /(True Positives + False Positives), while specificity can be defined as the accuracy on the negative instances: True Negatives / (True Negatives + False Positives) [4]. Kubat et al [14] suggest the g-means, g = acc + acc − , which combines specificity and sensitivity. In our experiments, the g-means replaces the standard accuracy rate, which losses its functions in imbalanced datasets. Table 2. Test Result SVM VQ-SVM Dataset Se Sp G-means Se Sp G-means Abalone (19) 0 1 0 1 0.88356 0.93998 Yeast (5) 0 1 0 0.9 0.7561 0.8249 Letter (26) 0.3537 1 0.5948 1 0.1871 0.4326 0.7007 0.9995 0.8368 Glass (7) 0.6667 1 0.8165 0.6667 1 0.8165 These experiments use LibSVM C code [15] to test the performance of c-SVM with RBF of the gamma values from 0.5 to 2. VQ-SVM consists of the Support Vector Classification by the Spider Machine Learning toolbox [16] and the Vector Quantization by the DCPR Matlab toolbox [17]. The results of experiments show that the g-means of VQ-SVM are rather better or equal to ones of standard SVM. In detail, the specificities of SVM are better than VQ-SVM, but SVM predicts all of instances as negative. Thus the specificities of standard SVM do not make any sense. In the dataset, Letter (26), while VQ-SVM compresses the number of negative instances to an extremely low level, a new imbalanced dataset is produced, and the predictive results of this dataset show that the positive group overwhelms the learning machine. In case that the imbalance ratio is not high and rather small dataset (e.g. Glass (7) 1:6.3 and 185 instances), the impact of VQ is not significant, e.g. almost equal value of g-means between SVM and VQ-SVM.
Combine Vector Quantization and Support Vector Machine for Imbalanced Datasets
7
6. Conclusion The results of experiments have proved the theoretic part: SVM is highly sensitive to the balance ratio between the numbers of the vectors of classes, and majority group often overwhelms the learning machine. In case of the large amount of training data with imbalance classes, oversampling increases the number of minority class, but at the same time introduces more computation costs, especially with respect to SVM. Instead of a step of the data pre-process, within the VQ-SVM, VQ optimises directly the predictor performance in case of imbalanced datasets. The previous results show the significant improvement in case of binary classification. In the further works, more precious controls and methods are necessary to be investigated. Especially the compression to only support vectors instead of all of vectors may enhance the controllability of the algorithm of VQ-SVM and manage the information loss caused by compression.
Acknowledge: The work has been supported by Capital Markets CRC, and the authors would like to thank Prof Donald Stokes for his support and datasets.
Reference: 1. Chawla, N.V., N. Japkowics, and A. Kolcz, Editorial: special issue on learning from imbalanced data sets. SIGKDD Explorations, 2004. 6(1). 2. Wang, J., X. Wu, and C. Zhang, Support vector machines based on K-means clustering for real-time business intelligence systems. International Journal of Business Intelligence and Data Mining, 2005. 1(1). 3. Scholkopf, B. and A.J. Smola, Learning with Kernels, Support Vector Machines, Regularization, Optimization, and Beyond. 2002: MIT Press. 4. Akbani, R., S. Kwek, and N. Japkowicz. Applying Support Vector Machines to Imbalanced Datasets. in Proceedings of the 15th European Conference on Machine Learning (ECML). 2004. 5. Veropoulos, K., C. Campbell, and N. Cristianini. Controlling the Sensitivity of Support Vector Machines. in the International Joint Conference on Artificial Intelligence (IJCAI99), Workshop ML3. 1999. Stockholm, Sweden. 6. Karakoulas, G. and J. Shawe-Taylor. Optimizing classifiers for imbalanced training sets. in Advances in neural information processing systems. 1998: MIT Press, Cambridge, MA, USA. 7. Lin, Y., Y. Lee, and G. Wahba, Support Vector Machines for Classification in Nonstandard Situations. Machine Learning, 2002. 46(1-3): p. 191 - 202. 8. Wu, G. and E.Y. Chang, KBA: kernel boundary alignment considering imbalanced data distribution. IEEE Transactions on Knowledge and Data Engineering, 2005. 17(6): p. 786 795. 9. Vapnik, V., The Nature of Statistical Learning Theory. 1995, New York: Springer-Verlag. 10. Linde, Y., A. Buzo, and R.M. Gray, An Algorithm for Vector Quantizer Design. IEEE Transactions on Communications, pp., 1980: p. 702--710.
8
Ting Yu, John Debenham, Tony Jan and Simeon Simoff
11. Gersho, A. and R.M. Gray, Vector Quantization And Signal Compression. 1992: Kluwer Academic Publishers. 12. Yu, T., T. Jan, J. Debenham, and S. Simoff. Incorporating Prior Domain Knowledge in Machine Learning: A Review. in AISTA 2004: International Conference on Advances in Intelligence Systems - Theory and Applications in cooperation with IEEE Computer Society. 2004. Luxembourg. 13. Yu, T., T. Jan, J. Debenham, and S. Simoff. Incorporate Domain Knowledge into Support Vector Machine to Classify Price Impacts of Unexpected News. in The 4th Australasian Conference on Data Mining. 2005. Sydney, Australia. 14. Kubat, M. and S. Matwin. Addressing the Curse of Imbalanced Data Sets: One-Sided Sampling. in Proceedings of the Fourteenth International Conference on Machine Learning. 1997. 15. Chang, C.-C. and C.-J. Lin, LIBSVM: a Library for Support Vecter Machine. 2004, Department of Computer Sicence and Information Engineering, National Taiwan University. 16. Weston, J., A. Elisseeff, G. BakIr, and F. Sinz, SPIDER: object-orientated machine learning library. 2005. 17. Jang, J.-S.R., DCPR MATLAB Toolbox. 2005.