EUROGRAPHICS 2004 / M.-P. Cani and M. Slater (Guest Editors)
Volume 23 (2004), Number 3
Combined Correlated and Importance Sampling in Direct Light Source Computation and Environment Mapping László Szécsi, Mateu Sbert, László Szirmay-Kalos Department of Control Engineering and Information Technology, Budapest University of Technology, Hungary Institute of Informatics and Applications, University of Girona, Spain Emails:
[email protected],
[email protected],
[email protected]
Abstract This paper presents a general variance reduction method that is a quasi-optimal combination of correlated and importance sampling. The weights of the combination are selected automatically in order to keep the merits of both importance and correlated sampling. The proposed sampling method is used for efficient direct light source computation of large area sources and for the calculation of the reflected illumination of environment maps. Importance sampling would be good in these cases if the sources are hidden, while correlated sampling is efficient if the sources are fully visible. The proposed method automatically detects the particular case and provides results that inherit the advantages of both techniques.
1. Introduction Rendering requires the identification of those light paths that connect the light sources to the eye via reflections and refractions, and then the computation of the sum of their contribution. This summation becomes a high-dimensional integral, thus high-dimensional quadratures are essential elements of image synthesis algorithms. In order to avoid the dimensional explosion of classical quadrature rules, MonteCarlo or quasi-Monte Carlo integration can be applied. 1.1. Monte-Carlo integration and importance sampling The fundamental idea of Monte-Carlo quadrature is to convert the integral to an expected value, which is then estimated by the average of random samples: Z
Z
f (z) dz =
I= V
V
· E
f (z) · p(z) dz = p(z)
¸ f (z) 1 M f (zi ) ≈ ·∑ , p(z) M i=1 p(zi )
(1)
where z = [z1 , . . . , zd ] is the integration variable, p(z) is a probability density in d-dimensional integration domain V , and the zi points are selected according to this probability c The Eurographics Association and Blackwell Publishing 2004. Published by Blackwell ° Publishing, 9600 Garsington Road, Oxford OX4 2DQ, UK and 350 Main Street, Malden, MA 02148, USA.
density. In order to reduce the variance (i.e. the error) of the random estimate, the probability density should mimic the integrand. Thus in Monte-Carlo integration it is worth applying probability distributions that are large where the integrand is large and small where the integrand is negligible. This variance reduction technique is called importance sampling [15]. Samples can be generated according to a given probability density p by transforming uniformly distributed samples with the inverse of the cumulative distribution function. The cumulative distribution function is the integral of the probability density function. Note that this process imposes severe requirements on the used probability density. It must be analytically integrable and its indefinite integral function should be invertible. This is possible only if the probability density is algebraically rather simple, which makes it impossible to accurately mimic the integrand in practical problems. In a particularly difficult scenario the domain contains regions where the integrand is large but the probability density — due to its failure to mimic the integrand — is small. The ratio of the integrand and the density can thus be very large, which results in a huge fluctuation when it is included into the integral quadrature.
Szécsi, Sbert, Szirmay-Kalos / Correlated and Importance Sampling in Direct Light Source Computation and Environment Mapping
1.2. Correlated sampling
2. Multiple correlated sampling
Correlated sampling [15, 7] (also called main part separation or control variates) is another variance reduction technique, which imposes less severe constraints on the extra functions of the Monte-Carlo estimate. Suppose function g(z), called the main part, approximates the original integrand and its integral can be analytically computed:
We have discussed two variance reduction techniques, importance sampling and correlated sampling. The question is which one is better in a particular situation. The answer depends on how well g approximates and p mimics integrand f . Since in computer graphics problems the original integrand f is usually not available algebraically (for example, due to shadowing), and can only be point sampled, we cannot get the answer without starting the computation.
Z
J=
g(z) dz. V
Compared to importance sampling this requirement is easier to meet, because importance sampling requires not only the indefinite integral function (i.e. the integral with varying upper limit) of the probability density mimicking the integrand, but also the inverse of this indefinite integral function (i.e. the inverse of the cumulative distribution function) in order to transform random samples. To estimate the integral of f , correlated sampling subtracts approximating function g from the integrand and simultaneously adds it as well: Z
I=
Z
f (z) − g(z) dz + V
Z
g(z) dz = V
f (z) − g(z) dz + J.
1 M f (zi ) − g(zi ) I≈ ·∑ + J. M i=1 p(zi ) g
g
= I
+ J
z
¶ µ g(z) f (z) . +λ· J − p(z) p(z)
V
The first term is estimated by standard Monte-Carlo quadrature:
f
On the other hand, we can do it better than selecting one sampling scheme from the two and use it. Instead, the two sampling schemes are combined in a way that the advantages are preserved. Recall that the primary estimator of importance sampling is f (z)/p(z), while the primary estimator of correlated sampling is ( f (z) − g(z))/p(z) + J. Let us introduce a combined sample that weights the results of correlated sampling by λ and of importance sampling by 1 − λ. The primary estimator of this combined technique is: µ ¶ f (z) f (z) − g(z) Iˆ = (1 − λ) · +λ· +J = p(z) p(z)
f-g z
z
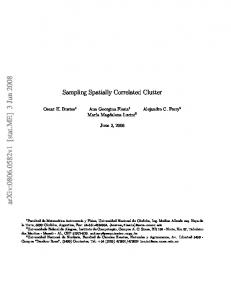
Figure 1: Correlated sampling If g can absorb the larger variations of f , then | f − g| is small, thus ( f − g)/p may have smaller variance than f /p (figure 1). Unlike importance sampling, correlated sampling received little attention in computer graphics. One reason is that it is usually difficult to find the main part in analytical form, and thus should also be a subject for approximation [8, 16, 10, 2, 12]. On the other hand, the product form of typical integrands showing up in rendering seems to be more appropriate for importance sampling. In this paper we propose a combined approach that can automatically adapt to the properties of the given problem and thus can keep the advantages of both importance and correlated sampling. The considered application areas, area light source sampling and environment mapping, on the other hand, allow an easy analytic approximation of the integrand, which is the basic requirement of correlated sampling.
Note that this combination is different from the one used in multiple importance sampling [18]. Here, instead of combining the samples obtained by different techniques, we have just a single sampling process controlled by a unique probability density p, but two estimators are computed from each random sample, which are combined together. It means that in the proposed method correlated sampling uses the same density as importance sampling. The expected value of this combined estimator will be correct if λ is constant or a random variable that is statistically independent of random sample z: · ¸ · µ ¶¸ ˆ = E f (z) + E λ · J − g(z) E[I] = p(z) p(z) · ¸ g(z) I + E [λ] · E J − = I. p(z) h since E
g(z) p(z)
i
(2)
R
= g(z) dz = J for any p(z) if p(z) is nonV
zero where g(z) is not zero, and the expected value of the product of two independent random variables equal to the product of their expected values. In order to find an optimal combination, weight λ is found ˆ The variance is a to minimize the variance of estimator I. quadratic function of λ: "µ µ ¶ ¶2 # h i f (z) g(z) 2 + −I σ (λ) = E (Iˆ − I) = E . λ· J − p(z) p(z) 2
c The Eurographics Association and Blackwell Publishing 2004. °
Szécsi, Sbert, Szirmay-Kalos / Correlated and Importance Sampling in Direct Light Source Computation and Environment Mapping
Value λ if found to minimize the quadratic function of the variance: h³ ´ ³ ´i g(z) f (z) E J − p(z) · I − p(z) ·³ λ= . (3) ´ ¸ g(z) 2 E J − p(z) Note that the optimal weight depends on the correlation of f /p and g/p. If these random variables are uncorrelated then λ is zero, i.e. we should use classical importance sampling instead of correlated sampling. This is intuitive since the independence of these random variables means that main part g is unable to mimic the variation of f . However, when there is a strong correlation, then we are better of giving higher weights to correlated sampling. When J is close to I, i.e. not only the correlation is high but also the sizes of the functions are similar, then only correlated sampling is worth applying.
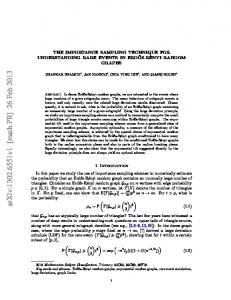
point ~x, fr is the BRDF, v is the visibility function which is 1 if the two points are mutually visible and zero otherwise, and G is the geometric factor: G(~x,~y) =
In the geometric factor θ~x , θ~y are the angles between the surface normals and the direction connecting ~x and ~y.
y
When λ is estimated from the same random samples as the integral quadrature, it will not be independent of the individual samples. It means that the assumption of independence of equation 2 does not hold, thus the expected value of Iˆ may be different from I. As the number of samples increases, the dependence on one particular sample converges to zero, i.e. the estimator is still consistent (asymptotically unbiased). On the other hand, we shall propose a method to decrease even the initial bias after introducing the application of the discussed general combination technique. In the following two sections we examine two problems where this method can be successfully applied, direct light source computation and environment mapping.
v=1
occluder ω r
L(x, ω)
e L(y, ωy x)
θx x
Figure 2: Direct light source computation This integral is evaluated by the proposed multiple correlated sampling. Using the notations of the previous sections, the integrand for point ~x and direction ω is: f~x,ω (~y) = Le (~y, ω~y→~x ) · fr (ω~y→~x ,~x, ω) · v(~x,~y) · G(~x,~y). In order to allow the application of correlated sampling, let us find an approximation of the integrand, which is analytically integrable. Doing so, the emission of the light source points towards~x and the BRDF at~x from the direction of light source points are approximated by constant values: Le (~y,~ω~y→~x ) ≈ L˜ e (~x),
fr (ω~y→~x ,~x, ω) ≈ f˜r (~x, ω).
Note that these approximations can be quite accurate if the light source is neither very specular nor very big, and when the surface is not very shiny. In main part g, the emission and the BRDF are replaced by these approximations and the visibility function is assumed to be 1: g~x,ω (~y) = L˜ e (~x) · f˜r (~x, ω) · G(~x,~y). The integral of the main part is:
3. Direct light source computation with correlated sampling Suppose we need the reflected radiance Lr at point ~x and in direction ω due to the illumination of an area light source. According to the rendering equation, the radiance can be obtained as the following integral [14]: Z
Lr (~x, ω) =
Le (~y, ω~y→~x )· fr (ω~y→~x ,~x, ω)·v(~x,~y)·G(~x,~y) d~y, Se
where S is the set of points on the light source, Le (~y, ω~y→~x ) is the radiance emitted by point ~y into the direction towards e
c The Eurographics Association and Blackwell Publishing 2004. °
light source
v=0
The formula of the optimal weight (the correlation of f /p and g/p) cannot be evaluated analytically, thus it is also a subject for Monte-Carlo estimation [13] or some intuitive approximation. We could, for example, take the M samples generated for the integral quadrature and obtained with probability density p, and estimate the optimal weight statistically as ³ ´ ³ ´ g(zi ) f (zi ) M f (z j ) 1 ∑M i=1 J − p(zi ) · M · ∑ j=1 p(z j ) − p(zi ) λ≈ . (4) ³ ´ g(z j ) 2 M J − ∑ j=1 p(z j )
cos θ~x · cos θ~y . |~x −~y|2
Z
J~x,ω = L˜ e (~x) · f˜r (~x, ω) ·
G(~x,~y) d~y. Se
This area integral of the geometric factor can be transformed to a contour integral applying the Stoke’s theorem, as proposed by Hottel and Sarofin [5], or simpler geometric arguments can be applied to obtain the closed form solution [17]. The result is known as the point-to-polygon form-factor in the radiosity literature: Z
G(~x,~y) d~y = Se
1 L−1 angle(~Rl , ~Rl⊕1 ) ~ ~ ∑ |~R × ~R | (Rl × Rl⊕1 ) · ~N~x (5) 2 l=0 l l⊕1
Szécsi, Sbert, Szirmay-Kalos / Correlated and Importance Sampling in Direct Light Source Computation and Environment Mapping
where 1. ~N~x is the normal vector of the illuminated surface at ~x, 2. angle(~a,~b) is the signed angle between two vectors. The sign is positive if ~b is rotated clockwise from ~a looking at them in the opposite direction to ~N~x , 3. ⊕ represents addition modulo L (circular next operator for vertices), 4. L is the number of vertices of the light source polygon, 5. ~Rl is the vector from ~x to the lth vertex of the light source polygon. The main part equals to the integrand if the light source is fully visible and both the light and the receiver surfaces are diffuse, thus in such cases correlated sampling gives exact results. For partially or fully occluded light sources, however, the main part can be far from the original integrand. In fact, for a fully occluded light source, classical importance sampling provides exact result, which equals to zero. It means that correlated sampling is optimal for fully visible light sources, and importance sampling is for fully occluded ones. In case of partial occlusion, our preference should depend on the level of occlusion. Weight λ computed from equation 3 reflects this intuition. In order to set the weight, we can approximate the expected values of equation 3 from the available samples as defined by equation 4. Alternatively, we can take a more drastic approach and make λ equal to the fractional visibility, that is to the fraction of rays visible per the number of total rays. We implemented both approaches and concluded that the first approach provides slightly better results.
puted from the same set of samples as the integral quadrature, then the assumption that λ is statistically independent holds only asymptotically when many rays are shot. For smaller number of samples, the statistical dependency may introduce a small bias. This bias can be reduced and the estimate of value λ can be made more accurate if the samples of the neighboring pixels are also taken into account to compute the weight. This corresponds to a low pass filtering of the image representing the λ values (figure 3). According to our experience simple image space filtering is sufficient, although the quality could be further improved by more sophisticated object space schemes that take into account depth information and do not allow averaging for pixels where distant points are seen. This averaging is reasonable since the fractional visibility does not change abruptly. Note that such a λ filtering does not reduce the contrast of the original image since with any λ value the final color estimates are valid.
3.1. Simulation results for light source sampling
Figure 4: Reference image of the dragon scene obtained with the proposed method using 100 light source samples
Figure 3: The image of weights λ. Bright pixels indicate the preference of correlated sampling to importance sampling. If the fractional visibility or the expected values are com-
Figures 4 and 5 compare classical light source sampling and pure correlated sampling with the proposed combined method. The combined method generated visually similar images when the weight λ is computed statistically and when it was set to the fractional visibility. The scene is illuminated by a large light source covering the left wall of the room. We obtained 10 random samples on the light source for each pixel. The first and the second rows contain the full images and the zoom-ins, respectively. Note that correlated sampling performs very well on fully illuminated parts (e.g. c The Eurographics Association and Blackwell Publishing 2004. °
Szécsi, Sbert, Szirmay-Kalos / Correlated and Importance Sampling in Direct Light Source Computation and Environment Mapping
Importance sampling
Correlated sampling
Combined sampling
Figure 5: Comparison of classical light source sampling, correlated light source sampling and the combined method using 10 samples on the light source
Figure 6 presents the error curves of the original importance and correlated sampling methods, and of the proposed combined method. The new method was examined with two λ values. In the statistically computed case equation 4 was used to obtain λ. In the second case, we made λ equal to the fractional visibility. The error curves show that the combined method is better than either importance or correlated sampling, and the statistically computed weight gives more accurate results than the intuitive application of the fractional visibility. The overhead of correlated sampling and the proposed c The Eurographics Association and Blackwell Publishing 2004. °
combination with respect to classical importance sampling is 10% for only 10 light source samples, and 3% for 40 light source samples.
importance sampling correlated sampling combined sampling (lamba = fractional visibility) combined sampling (lambda from statistics)
80
70
60 RMS error
on the bright part of the columns), but is poor in occluded regions (e.g. in the shadowed area behind the column). Importance sampling, on the other hand, is good in the shadowed regions and poor on bright, strongly illuminated parts. This is also shown by the image of the weights computed by the combination method (figure 3). Where this image is bright, correlated sampling should be preferred to importance sampling. The weighting makes the combined method good everywhere, which outperforms both techniques and preserves their advantages.
50
40
30
20
10 5
10
20
40
Number of light samples
Figure 6: Error curves obtained when rendering the dragon scene with different light samples
Szécsi, Sbert, Szirmay-Kalos / Correlated and Importance Sampling in Direct Light Source Computation and Environment Mapping
4. Sky-light illumination and environment mapping with correlated sampling
In the second alternative the environment radiance is replaced by the average on the solid angle.
When virtual objects are illuminated by a realistic sky model [4, 6, 11, 1] or when these objects should be placed in real scenes, the illumination coming from the sky or from a real environment is usually represented by an environment map defined by a high dynamic range image [3, 9]. The radiance of point ~x of the virtual object is the reflection of the illumination provided by the environment map, which can be computed as Z
Lr (~x, ω) =
Lenv (ω0 ) · fr (ω0 ,~x, ω) · cos θ0 · v(~x, ω0 )dω,
Ω
where Ω is the set of all directions, Lenv (ω0 ) is the radiance of the environment map at direction ω0 , fr is the BRDF, and v(~x, ω0 ) is the indicator function checking whether no virtual object is seen from~x at direction ω0 (that is, the environment map can illuminate this point of the virtual object from the given direction). The environment map can be imagined as a large spherical (or hemispherical) light source enclosing the virtual objects. Let us decompose the directional domain into D subdomains Ω1 , . . . , ΩD , and express the integral as the sum of the subdomain integrals: r
L (~x, ω) =
D Z
∑
L
env
0
0
0
0
0
(ω ) · fr (ω ,~x, ω) · cos θ · v(~x, ω )dω .
d=1Ω d
v=0
occluder ω
r
L(x, ω )
θ’
v=1
Ωd
puted once when the environment map is loaded. We have to select from the two alternatives according to which one is better mimicking the original integrand. If the environment map has high variation in the subdomain and the point to be rendered is diffuse or moderately specular, then option one is better. However, when the environment map is smooth and the BRDF is strongly specular, then option two is the more appropriate choice. Note that the optimal alternative can be selected separately for each sample. In both options, the integral of the main part will be the same: Z
J=
(1)
g~x,ω (ω0 ) dω0 =
Ωd
Z
(2) g~x,ω (ω0 ) dω0 = L˜ denv · ad (~x, ω).
Ωd
4.1. Decomposition of the directional domain In order to decompose directional domain Ω, the directions can be expressed by spherical coordinates φ, θ using ω = (cos φ · sin θ, sin φ · sin θ, cos θ), and their domains are broken to intervals φ0 , φ1 , . . . , φn and θ0 , θ1 , . . . , θm . The size of the spherical domain corresponding to Ωd = (φi , φi+1 ) × (θ j , θ j+1 ) is φi+1 θZj+1 Z
0
sin θ dθdφ = φ=φi θ=θ j
(φi+1 − φi ) · (cos θ j+1 − cos θ j ). This means that a uniform decomposition of the domain of θ results in a non-uniform decomposition of the directional domain, which would make fine tessellation around the “north pole” and crude tessellation close to the equatorial plane. This distortion can be compensated if interval boundaries θ j are obtained by transforming uniformly distributed values by the arccos function.
ω’
g~x,ω (ω0 ) = Lenv (ω0 ) · ad (~x, ω),
(7)
Lenv (ω0 ) dω0 . These values can also be com-
dω =
The integrals of this sum are evaluated by correlated sampling. First an analytically integrable approximation of the integrand is found. We have two alternatives. In both of them the main part neglects the visibility factor. In the first alternative the main part approximates the cosine weighted BRDF by a constant value, that is R
Ωd
Ωd
Figure 7: Environment mapping
where ad (~x, ω) =
where L˜ denv =
R
Z
environment map
x
(1)
(2) g~x,ω (ω0 ) = L˜ denv · fr (ω0 ,~x, ω) · cos θ0 ,
(6)
fr (ω0 ,~x, ω) · cos θ0 dω0 . This albedo-like
value can be pre-computed once for each material before starting the rendering.
The application of correlated sampling requires the integral of fr · cos θ0 in the directional subdomains. The general solution involves numerical approximation. However, in the special case of diffuse reflection, the integral can be analytically evaluated: Z
ad (~x, ω) =
fr (ω0 ,~x, ω) · cos θ0 dω0 =
Ωd
fr · (φi+1 − φi ) ·
cos2 θ j+1 − cos2 θ j . 2
c The Eurographics Association and Blackwell Publishing 2004. °
Szécsi, Sbert, Szirmay-Kalos / Correlated and Importance Sampling in Direct Light Source Computation and Environment Mapping
BRDF sampling
Correlated sampling
Combined sampling
Figure 8: Armadillo illuminated by the environment map of St. Peter’s Cathedral using classical importance sampling, correlated sampling and the combined method
BRDF sampling
Correlated sampling
Combined sampling
Figure 9: A virtual horse statue illuminated by the Florence environment using classical importance sampling, correlated sampling and the combined method
c The Eurographics Association and Blackwell Publishing 2004. °
Szécsi, Sbert, Szirmay-Kalos / Correlated and Importance Sampling in Direct Light Source Computation and Environment Mapping
4.2. Simulation results of environment mapping Figure 8 shows a virtual object called Armadillo (downloaded from the Stanford Scanning Repository) illuminated by an environment map defined by a HDRI panoramic image [3]. The hemisphere was decomposed into 24 solid angles and 20 random samples were taken in each solid angle. The image generated with BRDF sampling is rather noisy. We can obtain noise free results with correlated sampling at points where there is no self occlusion, but the error is high at occluded parts. The combined method performs well at both self occluded and unoccluded parts. Since Armadillo is moderately specular, we used equation 6 to define the approximation of the integrand. The images of figure 9 show a virtual horse statue placed in the real Florence environment. The images were rendered using only 10 random samples in each solid angle. Since the horse is more specular than Armadillo, we set approximation function g according to equation 7. The images indicate that correlated sampling is better than importance sampling in this case, but the combined method is superior to both techniques.
TIC 2001-2416-C03-01 from the Spanish Government. The scenes have been modelled by Maya that was generously donated by AliasWavefront. The authors are also grateful to Paul Debevec, who provided the high dynamic range images used in the tests, and to Alex Keller [7] and John Halton, who draw the attention of the authors to correlated sampling in Dagstuhl Seminar on Stochastic Methods in Rendering. References [1]
S. Agarwal, R. Ramamoorthi, S. Belongie, and H. W. Jensen. Structured importance sampling of environment maps. ACM Trans. Graph., 22(3):605–612, 2003. 6
[2]
P. Bekaert. Hierarchical and stochastic algorithms for radiosity. PhD thesis, University of Leuven, 1999. 2
[3]
P. Debevec. Rendering synthetic objects into real scenes: Bridging traditional and image-based graphics with global illumination and high dynamic range photography. In Computer Graphics (ACM SIGGRAPH ’98 Proceedings), pages 189–198, 1998. 6, 8
[4]
Y. Dobashi, K. Kaneda, H. Nakatani, and H. Yamashita. Method for Calculation of Sky Light Luminance Aiming at an Interactive Architectural Design. Computer Graphics Forum, 15(3):C109–C118, 1996. 6
[5]
H. C. Hottel and A. F. Sarofin. Radiative Transfer. McGraw-Hill, New-York, 1967. 3
[6]
Henrik Wann Jensen, Michael M. Stark, Simon Premoze, Peter Shirley, Fredo Durand, and Julie Dorsey. A physically-based night sky model. In Computer Graphics Proceedings, Annual Conference Series (SIGGRAPH 2001), August 2001. 6
[7]
A. Keller. Correlated sampling. Closing section of the Dagstuhl Seminar on Stochastic Methods in Rendering, No. 01261, 2001. 2, 8
[8]
A. Keller. Hierarchical Monte Carlo image synthesis. Mathematics and Computers in Simulation, 55(1– 3):79–92, 2001. 2
[9]
T. Kollig and A. Keller. Efficient illumination by high dynamic range images. In Eurographics Symposium on Rendering, pages 45–51, 2003. 6
5. Conclusions This paper proposed a general variance reduction technique that is a quasi-optimal combination of importance and correlated sampling. Both techniques to be combined, as well as the calculation of their weights depend on random samples. We concluded that the combination based on statistical results can keep the merits of both techniques. In order to apply this sampling scheme, we investigated two rendering problems, area light source sampling and environment mapping. In these cases a reasonably good approximation of the integrand can be found, which is analytically integrable, making these problems primary candidates for correlated sampling. The statistical decisions are responsible for measuring the accuracy of these analytical approximations, and prefer correlated to importance sampling schemes, or vice versa, depending on the results. The combination method has negligible overhead, but due to its adaptivity the combined sampling is much better than either pure importance sampling or correlated sampling. We used independent random light source samples for each pixel to estimate the illumination of the light source or the environment map. However, the proposed method can also be used in dependent sampling, when the illumination in different pixels is computed from the same set of random light source points.
[10] E. Lafortune and Y. D. Willems. A 5D tree to reduce the variance of Monte Carlo ray tracing. In Rendering Techniques ’96, pages 11–19, 1996. 2
6. Acknowledgements
[11] Nelson L. Max. Unified Sun and Sky Illumination for Shadows Under Trees. CVGIP: Graphical Models and Image Processing, 53(3):223–230, May 1991. 6
This work has been supported by the National Scientific Research Fund (OTKA ref. No.: T042735), IKTA ref. No.: 00159/2002, the Bolyai Scholarship, by Intel, and by
[12] L. Neumann, A. Neumann, J. Prikryl, and W. Purgathofer. The constant radiance term. Machine Graphics & Vision, 7(3):535–549, 1998. 2 c The Eurographics Association and Blackwell Publishing 2004. °
Szécsi, Sbert, Szirmay-Kalos / Correlated and Importance Sampling in Direct Light Source Computation and Environment Mapping
[13] W. Purgathofer. A statistical method for adaptive stochastic sampling. In Eurographics ’86, pages 145– 152, 1986. 3 [14] P. Shirley, C. Wang, and K. Zimmerman. Monte Carlo techniques for direct lighting calculations. ACM Transactions on Graphics, 15(1):1–36, 1996. 3 [15] I. Sobol. Die Monte-Carlo Methode. Deutscher Verlag der Wissenschaften, 1991. 1, 2 [16] L. Szirmay-Kalos, F. Csonka, and Gy. Antal. Global illumination as a combination of continuous random walk and finite-element based iteration. Computer Graphics Forum (Eurographics’2001), 20(3):288–298, 2001. 2 [17] L. Szirmay-Kalos (editor). Theory of Three Dimensional Computer Graphics. Akadémia Kiadó, Budapest, 1995. http://www.iit.bme.hu/˜szirmay. 3 [18] E. Veach and L. Guibas. Optimally combining sampling techniques for Monte Carlo rendering. In Computer Graphics Proceedings, Annual Conference Series, 1995 (ACM SIGGRAPH ’95 Proceedings), pages 419–428, 1995. 2
c The Eurographics Association and Blackwell Publishing 2004. °