Combined lock-in thermography and SQP algorithm for non-intrusive reconstruction of optical and thermal properties in semitransparent medium Shuangcheng Sun, Hong Qi*, Wenwen Zhang, Yatao Ren, Liming Ruan* School of Energy Science and Engineering, Harbin Institute of Technology, Harbin, China, 150001 *Corresponding author Hong Qi School of Energy Science and Engineering, Harbin Institute of Technology 92, West Dazhi Street, Harbin, P. R. China, 150001 Tel: (86)-0451-86412638 Email:
[email protected] (H. Qi)
Liming Ruan School of Energy Science and Engineering, Harbin Institute of Technology 92, West Dazhi Street, Harbin, P. R. China, 150001 Tel: (86)-0451-86412638 Email:
[email protected] (L. M. Ruan)
Abstract: A combined lock-in thermography (LIT) technique with sequential quadratic programming (SQP) algorithm is proposed for simultaneous reconstruction of the optical and thermal property distributions in a 2D semitransparent medium. The LIT technique is applied to identify the positions of inclusions in media, in which the discrete correlation method is employed to extract the amplitude and phase angle of thermal wave signals. The SQP algorithm is employed as the main optimization method to simultaneously reconstruct the absorption coefficient, scattering coefficient, and thermal conductivity distributions in the medium. The LIT-SQP technique combines the advantages of rapid identification of inclusion position of the LIT technique and accurate reconstruction of inclusion properties of the SQP algorithm. The inclusions of various positions, shapes, numbers, and sizes are investigated. All the inclusions can be accurately reconstructed by the proposed LIT-SQP technique, which is proved to be more efficient and accurate than the LIT technique and the SQP algorithm alone. Keyword: optical parameter, thermal conductivity, simultaneous reconstruction, lock-in thermography, sequential quadratic programming, absorption coefficient, scattering coefficient
Nomenclature A
amplitude of thermal wave signal, K
c
restriction
c0°
reference sine function
c-90°
reference cosine function
cp
specific heat capacity at constant pressure, J/(kg K)
d
search direction
fe
frequency of incident laser
F
objective function
Fp
penalty function
G
Hessian matrix
h
convective heat transfer coefficient, W/m2 K
H
effective approximation of Hessian
I
radiative intensity, W/(m2 sr)
L
Lagrangian function or size of medium, m
m
the total number of restriction
me
the number of equality restriction
n
outward normal vector on the boundary
Nd
the number of detector at boundaries
Ns
the number of computational period
Nt
the number of sampling time in direct problem
q
heat flux, W/m2
r
penalty factor
s
spatial position
S0°
in-phase reference output
S-90°
quadrature reference output
t
time, s
T
temperature, K
u
Lagrangian multiplier
w
directional weight
x
coordinate in the x direction, m
xi
ith exact parameter
xi
ith estimated parameter
y
coordinate in the y direction, m
Greeks symbols
search step size
a positive constant
e
extinction coefficient, m-1
Φ
scattering phase function
directional cosine
a
absorption coefficient, m-1
s
scattering coefficient, m-1
reflectivity of surface
phase angle of thermal wave signal
thermal conductivity, W/(m K)
density, kg/m3
Stefan-Boltzmann constant, W/(m2 K4)
transmittance of boundary
scattering direction
'
incident direction
directional cosine
Subscripts a
ambient value
am
peak heat flux of incident laser
b
blackbody
c
conductive heat transfer
est
estimated value
exa
exact value
k
iteration number
l
lth discretized direction
m
mth discretized direction
r
radiative heat transfer
w
boundary value
1 Introduction Coupled radiation-conduction heat transfer has numerous engineering applications such as solar energy conservation, ceramic thermal protection, biological heat transfer, glass manufacture, multilayer semiconductor processing, and fiber insulation [1-6]. Accurate identification of optical and thermal properties is greatly important to a variety of industrial and medical applications, including the inverse design of radiative enclosures, non-destructive testing of semitransparent media, optimization of heat transfer process, tumor thermal therapy, and clinical testing [7-18]. During the last few decades, a significant amount of interests was provided in the research of simultaneous estimation of optical and thermophysical parameters in semitransparent media. Quite a few inverse techniques have been proposed and developed to solve the non-intrusive reconstruction tasks. Generally, the inverse optimization techniques can be classified into two categories. One is the intelligent algorithm, which is based on the stochastic search strategy, including genetic algorithm (GA), particle swarm optimization (PSO), and ant colony optimization (ACO). The other one is the gradient method, which is updated
based on of the gradient of the objective function with respect to the reconstruction parameter, such as conjugate gradient method (CGM), Levenberg-Marquardt (L-M) method, and sequential quadratic programming (SQP) algorithm. Both the intelligent algorithm and the gradient-based method have obtained wide applications, through which the optical and thermophysical parameters are simultaneously reconstructed. For example, Das et al. [19-22] applied GA to estimate the extinction coefficient, scattering albedo, conduction-radiation parameter, boundary emissivity, and boundary heat flux in an absorbing, scattering, and emitting medium with diffuse gray boundaries. In addition, the effects of genetic parameters such as crossover and mutation probabilities, population size, and iteration number on the estimation results were investigated. Qi et al. [23-26] employed modified PSO algorithms to identify the radiative source term, extinction coefficient, scattering coefficient, conduction-radiation parameter, and temperature-dependent thermal conductivity and absorption coefficient in 1D and 2D semitransparent media. The effect of population size of particle swarm on the estimation results was studied, and a suggested value was provided. Zhang et al. [27-29] used ACO algorithm to determine the optical thickness, scattering albedo, thermal conductivity, and scattering asymmetry parameter in 1D homogeneous media. Furthermore, several improved ACO models were proposed to enhance the search capability and convergence velocity of the ant colony. Many other intelligent algorithms, such as differential evolution (DE) [30], krill herd (KH) [31], and social spider optimization (SSO) [32], were employed to solve the simultaneous estimation of optical and thermal properties in semitransparent media. The retrieval results demonstrated that the intelligent algorithms are robust to identify the physical parameters in the medium. However, most of the above studies of intelligent algorithms were investigated based on the assumptions that the medium is homogeneous, or the properties of the media can be expressed as a function with respect to the temperature or position. It is very difficult for the intelligent algorithm to simultaneously reconstruct the multi-dimensional field parameters without priori information, especially when the parameters to be reconstructed are closely related. On the contrary, the gradient method is an effective optimization technique, which can simultaneously reconstruct a large number of relevant parameters or parameter distributions. Many researches on the reconstruction of optical parameter distributions have been investigated by using the gradient-based methods. For instance, Schweiger and Arridge [33] proposed a two-stage optimization technique on the basis of CGM to simultaneously reconstruct the absorption and scattering coefficient distributions in segmented brain model. The diffusion equation was employed to describe the photon transport in optical tissue and a nonlinear CGM was used as the optimization method. Homogeneous distributions of optical parameters were estimated in the first stage, and the spatial-dependent optical tissue parameters were reconstructed in the second stage, through which the stability
and convergence velocity of the reconstruction technique can be improved. Ren et al. [34] investigated the optical tomographic reconstruction of absorption and scattering coefficients based on frequency-domain radiative transfer equation (RTE). The transmitted radiative intensities on the surfaces were served as inputs for the inverse analysis, and a limited-memory quasi-Newton method was applied to optimize the objective function. Compared with the reconstruction results obtained based on steady-state RTE, the cross-talk between absorption and scattering coefficients can be reduced significantly. Kim and Hielscher [35] introduced a partial-differential-equation (PDE) constrained technique to reconstruct the absorption and scattering coefficients in a cylinder medium, in which the reduced Hessian SQP (rSQP) algorithm was used to solve the forward and inverse problems all at once. The reconstruction results demonstrated that the proposed rSQP algorithm can reduce the computational time and improve the reconstruction accuracy. Moreover, the optical parameters in a tissue phantom were reconstructed by using experimental and numerical data. Although many modified inverse techniques had been proposed and developed to reconstruct the optical parameters in biological tissue, the cross-talk cannot be avoided. Time-domain RTE can provide much more time-dependent measurement signals than steady-state and frequency-domain models, and thereby the accuracy of the reconstruction results can be significantly improved. Boulanger and Charette [36] applied the discrete ordinate method (DOM) to solve the time-domain RTE and employed the emerging radiative intensity on boundaries as the measurement signals. The adjoint mode and reverse differentiation were used to calculate the gradient of objective function with respect to the optical parameters. The absorption and scattering coefficients in 1D, 2D, and 3D homogeneous and non-homogeneous semitransparent media were reconstructed. More recently, our group [37] has employed the SQP algorithm to reconstruct the absorption and scattering coefficients in a 2D semitransparent medium. The DOM was used to solve the time-domain RTE, and the adjoint model was applied to retrieve the gradient of the objective function with respect to the optical parameters. Compared with the frequency-domain model, the time-domain model was more robust and accurate. Though the optical imaging technique has been successfully applied in clinical testing, the reconstruction accuracy is significantly reduced if the radiative transfer in the media is dominated by a single optical parameter (for instance the scattering coefficient is much larger than the absorption coefficient in our previous research [37]). The lock-in technique is a simple tool that analyzes the measurement signals by extracting the amplitude and phase angle information of the detected signals. During the last three decades, a considerable amount of works for defect recognition or imaging by lock-in thermography (LIT) were reported. For instance, Busse et al. [38] employed the LIT technique to detect the defects in carbon fiber reinforced polymers, in which the thermography and thermal wave techniques are combined to provide a short-time low-frequency phase angle image. The retrieval results
showed that the detective depth range can be increased by the proposed imaging technique. Bai and Wong [39] applied the LIT technique to non-destructively detect the defects in carbon fiber reinforced composite materials. Their retrieval results showed that the detection accuracy of LIT depends on the inspection frequency, intensity of heat source, resolution of lock-in system, and distance between the infrared camera and the object. Meanwhile, the LIT technique was more sensitive than the conventional thermography methods. Maldague et al. [40] proposed a pulse phase thermography (PPT) technique, which combines the advantages of pulse thermography (PT) and LIT methods. The specimen was heated by a pulse laser, and the Fourier transform was employed to retrieve the phase angle of the temperature evolution. The retrieval results demonstrated that the PPT technique can improve the detection depth of defects and obtain better shape resolution than the PT and LIT techniques. Liu et al. applied LIT [41, 42], PT [43], and thermal-wave radar imaging [44] techniques to non-destructively detect the defects in specimen by experimental methods. Various multi-transform techniques, including Fourier transform (FT), Hilbert transform (HT), and cross-correlation (CC), were employed to extract the characteristics of thermal wave signals. The delay time image of CC obtained high contrast, whereas the phase image of FT achieved high SNR for the shallow defects. The phase images of HT achieved both high contrast and large SNR for the deep defects. However, these thermographic studies were investigated based on pure conduction heat transfer model, which may produce a mismatch between the theoretical and the experimental results, especially for semitransparent materials. Moreover, the physical properties of defects in specimens cannot be identified by these techniques. To the best knowledge of the authors, simultaneous reconstruction of absorption coefficient, scattering coefficient, and thermal conductivity distributions based on LIT technique has not yet been reported. The current study aims to simultaneously reconstruct the optical properties (i.e., absorption and scattering coefficient distributions) and thermophysical parameter (i.e., thermal conductivity distribution) in 2D semitransparent media by using LIT technique and SQP algorithm. A combined LIT with SQP (LIT-SQP) technique is proposed and developed to improve the reconstruction accuracy and convergence speed. The remainder of this work is organized as follows. In Section 2, the direct problem concerns coupled radiation-conduction heat transfer is presented. In Section 3, the inverse methods including LIT technique and SQP algorithm are introduced, and the theoretical principle of LIT-SQP technique is described in detail. The reconstruction model and the objective function are discussed in Section 4. In Section 5, the absorption coefficient, scattering coefficient, and thermal conductivity distributions are simultaneously reconstructed by the LIT-SQP technique. Meanwhile, the effects of position, shape, number, and size of inclusions on the reconstruction results are investigated. The main conclusions are provided in Section 6.
2 Direct model The transient coupled radiation-conduction model is considered to describe the heat transfer process in 2D absorbing, emitting, and isotropically scattering media (see Fig. 1). The boundaries are diffuse gray walls and are subjected to convective boundary conditions with ambient temperature Ta and convective heat transfer coefficient hf. The left surface is exposed to an infrared laser. The energy conservation equation for 2D coupled radiation-conduction heat transfer can be written as [45]:
cp
T T qr t
(1)
where , cp, and denote the density, specific heat capacity, and thermal conductivity of the media, respectively. T is the temperature. qr represents the radiative source term produced by the radiative heat transfer. The initial and boundary conditions for the energy equation are defined as: T t 0 T0
(2)
qlaser qr,w qc,w hw Tw Ta
(3)
where is the transmittance of the boundary. qlaser and qc indicate the heat flux of the incident laser and conduction heat transfer on boundaries, respectively. The script w denotes the walls of the media.
Fig. 1 Schematic of 2D participating medium
The radiative source term can be obtained by solving the following RTE [45]: dI s,Ω ds
e I s,Ω a I b s
s 4
4
I s,Ω' Φ Ω' ,Ω dΩ'
(4)
where I(s, ) is the radiative intensity at the position s and direction . e, a and s represent the extinction, absorption and scattering coefficients of media, respectively, and e=a+s. I b T 4 denotes the radiative intensity of blackbody at temperature T. is the Stefan-Boltzmann constant. Φ Ω' ,Ω indicates the scattering phase function. ' and are the incident and scattering directions, respectively. The boundary condition of RTE for semitransparent surfaces can be defined as: n I wm 1 Ta4 n 0
wl I wl n w Ωl
n w Ωm 0
(5)
n w Ω 0 l
where n1 and n0 denote refractive index of surroundings and media, respectively. represents the reflectivity of
surface. w indicates the directional weight. nw is the outward normal vector on the boundary. Hence, the radiative source term in Eq. (1) can be calculated by: qr a 4 I b s
4
I s,Ω dΩ
(6)
The DOM is employed to solve the RTE, and the finite volume method (FVM) is applied to solve the energy equation. The detailed computational procedure for solving coupled radiation-conduction heat transfer is available in Refs. [45] and not repeated here. 3 Inverse model 3.1 Lock-in thermography technique If the specimen is irradiated by a sine-wave type source, then sine-wave thermal signals can be obtained on specimen surfaces, and the thermal responses are determined by the physical properties of the specimen. Thus, the thermophysical and optical properties can be identified based on the measurement signals. An infrared sine-wave laser is employed as the excitation source whose heat flux can be expressed as: qlaser qam sin 2 fet qam
(7)
where 2qam and fe represent the peak heat flux and frequency of the incident laser, respectively. The discrete correlation method (DCM) is applied to extract the characteristic information such as amplitude and phase angle of the thermal wave signals. It is realized by using a synchronous correlation between the boundary thermal wave and a reference harmonic signal [46]. The two-channel sine/cosine correlation is one of the most effective correlation techniques, and it consists of a sine and a cosine function. Two correlation functions are defined as: 2 n 1 0 c n 2sin N c n
90
2 n 1 2cos N
(8)
(9)
where c(n)0°and c(n)-90° are the reference sine and cosine functions, respectively. N indicates the number of sampling point in a modulation period. Thus, the correlation output for LIT technique can be expressed as [38, 46]:
S
0
1 Ns N
S 90
Ns
N
T
i ,n
i 1 n 1
1 Ns N
Ns
N
2 n 1 2sin N
T
i ,n
i 1 n 1
2 n 1 2cos N
(10)
(11)
where S0°and S-90° denote the in-phase and quadrature reference outputs, respectively. Ns represents the number of computational period. Ti, j is the thermal wave signal. According to the two-channel sine/cosine output, the amplitude and phase angle of the thermal wave signal can be obtained by: A
S S 2
0
90
2
S 90 0 S
arctan
(12)
(13)
where A and represent the amplitude and phase angle of the thermal wave signal, respectively. 3.2 SQP algorithm The SQP algorithm is one of the most effective optimization techniques for solving smooth nonlinear programming problems. The theoretical principle of SQP, which is first proposed by Wilson, is employing the idea of Newton method in solving unconstrained optimization problems to solve the constrained optimization problems [47]. Therefore, the SQP algorithm is also called the Lagrangian-Newton method for solving constrained optimization problems. The following general nonlinear programming problem is considered: min
F x
s.t.
ci x 0 i E 1, 2,..., me
(14)
ci x 0 i I me 1, me 2,..., m
where F is the objective function to be optimized. ci represents the restriction. m and me denote the numbers of total restriction and equality restriction, respectively. In the optimization process of SQP, the optimization task is converted to a series of quadratic programming (QP) subproblems, and the SQP algorithm superlinearly converges to the optimum by solving these QP subproblems. Thus, Eq. (14) is transformed into the following form [48]:
d 12 d c x c x c x c x
min F x k s.t.
T
k
i
k
H kd
T
d 0 iE
T
d 0 iI
i
k
i
T
k
i
(15)
where d denotes the search direction at the current iteration. xk represents the current reconstruction parameters. Hk is an approximation of the Hessian of the following Lagrangian equation [48]:
L x, u F x
m
u c x
(16)
i i
i 1
where ui is the Lagrangian multiplier. To improve the global convergence capability of the SQP algorithm, a penalty function is introduced, and is written as [49]: m me Fp x F x r ci x min 0, ci x i 1 i me 1
(17)
where r 0 denotes the penalty factor. Hence, the reconstruction parameter can be updated by: xk 1 xk k d k
(18)
where k represents the step size, which satisfies:
Fp xk 1 Fp x k k Fp x k , d k Fp x k
(19)
where
Fp x k d k F x k F x k
T
1 d TH kd 2
me r ci x k ci x k i 1
T
m
d
min 0, ci x ci x
i me 1
k
T
d
(20)
Furthermore, the following second-order approximation is considered to avoid Maratos effect [50]:
min F x k s.t.
T
1 d d TG k d 2
1 d d T Gik d 0 i E 2 T 1 ci x k d d T Gik d 0 i I 2
ci x k ci x k
ci x k
T
(21)
where G and Gi represent the Hessian matrices 2 F x and 2 ci x , respectively. The reconstruction parameter and search step size are updated based on:
dˆ
xk 1 xk k d k k
2
k
dk
(22)
The subproblem in Eq. (21) is considered only when both of the following equations are satisfied:
Fp xk k d k Fp x k k Fp x k , d k Fp x k
max ci x k aik
T
(23)
d k ci x k d k max ci x k ci x k d k ci x k d k
(24)
3.3 Computation procedure of LIT-SQP technique A combined LIT-SQP technique is proposed and employed to simultaneously reconstruct the absorption coefficient, scattering coefficient, and thermal conductivity distributions of 2D semitransparent medium. First, the LIT technique is applied to determine the preliminary positions of inclusions in the media. Afterwards, the SQP algorithm is employed to estimate the optical and thermal properties of the inclusions determined by the LIT technique. Finally, the retrieval results in the previous step are used as the initial guessed values, and the SQP algorithm is employed to reconstruct the final optical and thermophysical parameter distributions. The entire optimization process of LIT-SQP technique can be carried out according to the following steps: Step 1.
Initially identify the inclusion in the medium by using the LIT technique.
Step 2.
Set the initial distributions of the optical and thermal properties as the related values of the background medium.
Step 3.
Estimate the absorption coefficient, scattering coefficient, and thermal conductivity of the preliminary inclusions in Step 1 by using the SQP algorithm.
Step 4.
Read the retrieval results obtained in Step 3 and employ them as the initial values for the next step.
Step 5.
Reconstruct the optical and thermophysical parameters of the inclusion domain by using the SQP algorithm.
Step 6.
Repeat the reconstruction work in Step 5 until one of the following stop criteria is satisfied: (1) the objective function value reaches the specified computational accuracy, and (2) the iteration number reaches the maximum value.
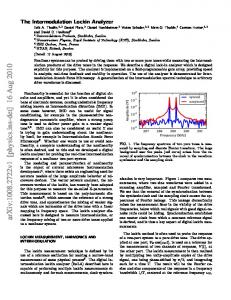
The reconstruction process is presented in Fig. 2.
Fig. 2 Reconstruction process of the LIT-SQP technique
4 Problem description The optimization task aims to simultaneously reconstruct the optical and thermophysical parameters in the semitransparent medium, and thereby the inclusions can be identified based on the imaging results. A 2D square medium with the size of Lx Ly 0.01 0.01 m2 is considered. The left and bottom surfaces of the medium are exposed to a sine-wave laser in turn, and the measured thermal wave signals on these two surfaces are served as inputs for the LIT technique to identify the boundaries of inclusions. Meanwhile, the detected radiative and thermal signals on four boundaries are recorded.
The exit radiative intensity is highly sensitive to the optical parameters but slightly sensitive to the thermal conductivity, whereas the temperature response is highly sensitive to the thermal conductivity but slightly sensitive to the optical parameters [25]. Thus, the optical and thermophysical parameters are reconstructed in different stages based on different objective functions. The objective function of the reconstruction of absorption and scattering coefficient distributions is defined as: Nt
F1
Nd
j 1 i 1
I i, j 2 est 1 I exa i, j
(25)
where Iest and Iexa denote the estimated and exact exit radiative intensities at boundaries, respectively. Nt represents the number of sampling time in the direct problem. Nd is the number of detector at the boundaries. The objective function to reconstruct the thermal conductivity of the medium is defined as:
T Nt
F2
Nd
est
i, j Texa i, j
2
j 1 i 1
(26)
The normalized root-mean square error (NRMSE) is employed to evaluate the reconstruction results as follows [51]: N
NRMSE
xi xi 2 i 1
N
x
2
i
(27)
i 1
where xi and xi represent the exact and estimated values of optical and thermophysical parameters, respectively. N is the number of reconstruction parameter. 5 Results and discussion The proposed LIT-SQP technique is employed to simultaneously reconstruct the absorption coefficient, scattering coefficient, and thermal conductivity distributions in 2D semitransparent media. The parameter settings of optical and thermophysical properties of background medium and inclusion are listed in Table 1. The computational domain is discretized into 22 22 grids and 24 discrete ordinate quadratures. The test cases are implemented using the FORTRAN code, and the developed program is executed on an Intel Core(TM) 3.6 GHz i7-770 PC.
Table 1 Parameters of background medium and inclusion
A square inclusion located at the left side of the medium is considered. The actual distributions of the
absorption and scattering coefficients and the thermal conductivity are shown in Fig. 3. Fig. 4 illustrates the amplitude and phase angle distributions on the left and bottom boundaries of the medium. The position of the inclusion can be preliminarily identified by the LIT technique (see Fig. 4(c)). The SQP algorithm is employed to further determine the characteristics of the inclusion, and the final retrieval results are shown in Fig. 5. The optical and thermophysical parameter distributions are accurately reconstructed by the present technique. Meanwhile, the position and boundaries of the inclusion are also clearly identified, thereby demonstrating the proposed method is effective in simultaneous reconstruction of the absorption coefficient, scattering coefficient, and thermal conductivity distributions in semitransparent media.
Fig. 3 Actual distributions of (a) absorption coefficient, (b) scattering coefficient, and (c) thermal conductivity
Fig. 4 Retrieval results of LIT technique. (a) Amplitude and phase angle of thermal wave signal at the left boundary, (b) amplitude and phase angle of thermal wave signal at the bottom boundary, and (c) identified position of inclusion by LIT technique
Fig. 5 Final reconstruction results of (a) absorption coefficient, (b) scattering coefficient, and (c) thermal conductivity
To test the performance of the LIT-SQP technique, circular and oval inclusions at different positions are considered. As shown in Figs. 6 and 7, the circular and oval inclusions are accurately identified by the combined LIT-SQP technique. The results show that the proposed method is effective and robust in reconstructing the inclusions of different geometric shapes and positions. Table 2 lists the NRMSE values and computational time of SQP and LIT-SQP methods. The LIT-SQP technique achieves better performance than the SQP algorithm in terms of computational accuracy and efficiency given that the LIT technique can provide an accurate initial distribution of reconstruction parameter for the SQP algorithm, and the number of reconstruction parameter can be significantly decreased based on the preliminary identification. Moreover, no regularization constraint is required for the reconstruction work. Thus, the proposed LIT-SQP method is more practical than the SQP algorithm.
Fig. 6 Reconstruction results of circular inclusion. (a) Actual absorption coefficient distribution, (b) actual
scattering coefficient distribution, (c) actual thermal conductivity distribution, (d) amplitude and phase angle of thermal wave signal at the left boundary, (e) amplitude and phase angle of thermal wave signal at the bottom boundary, (f) identified result of LIT technique, (g) final reconstruction result of absorption coefficient distribution, (h) final reconstruction result of scattering coefficient distribution, and (i) final reconstruction result of thermal conductivity distribution
Fig. 7 Reconstruction results of oval inclusion. (a) actual absorption coefficient distribution, (b) actual scattering coefficient distribution, (c) actual thermal conductivity distribution, (d) amplitude and phase angle of thermal wave signal at the left boundary, (e) amplitude and phase angle of thermal wave signal at the bottom boundary, (f) identified result of LIT technique, (g) final reconstruction result of absorption coefficient distribution, (h) final reconstruction result of scattering coefficient distribution, and (i) final reconstruction result of thermal conductivity distribution
Table 2 Retrieval NRMSEs and computational time of SQP and LIT-SQP methods
Furthermore, three inclusions are considered to test the performance of the LIT-SQP technique in simultaneous reconstruction of multi-inclusions. As illustrated in Fig. 8, all the inclusions in the medium can be accurately recovered by the present inverse method, demonstrating the LIT-SQP technique is also effective and robust in reconstructing multi-inclusions in the semitransparent media. The NRMSEs of the reconstructed absorption coefficient, scattering coefficient, and thermal conductivity distributions are 0.0036, 0.0059, and 0.0061, respectively, and the total computation time is 0.49 h. Both the NRMSE and the computation time are larger than those for single square inclusion, which is owing to the fact that three inclusions reduce the accuracy of LIT results and increase the number of reconstruction parameter in the last optimization process. Although the reconstruction accuracy is slightly decreased and the computation time is extended, the main characteristics of the inclusions such as geometric shapes, positions, and optical and thermal properties can be clearly identified based on the imaging results.
Fig. 8 Reconstruction results of three square inclusions. (a) Actual absorption coefficient distribution, (b) actual scattering coefficient distribution, (c) actual thermal conductivity distribution, (d) amplitude and phase angle of thermal wave signal at the left boundary, (e) amplitude and phase angle of thermal wave
signal at the bottom boundary, (f) identified result of LIT technique, (g) final reconstruction result of absorption coefficient distribution, (h) final reconstruction result of scattering coefficient distribution, and (i) final reconstruction result of thermal conductivity distribution
The effect of various sizes of inclusions on the reconstruction results is also investigated. The central positions of three square inclusions remain the same as in the former case. Table 3 lists the NRMSEs and computational time of the retrieval results for different sizes. The size of inclusion slightly influences the reconstruction of the combined LIT-SQP technique, and the maximum NRMSE is only 0.0066 for different sizes, which demonstrates that the present technique is robust to reconstruct the inclusions with different sizes.
Table 3 Reconstruction results for different sizes of inclusions
Moreover, a special case that considers two crossed inclusions is tested, and the retrieval results are shown in Fig. 9. The imaging qualities of the optical and thermal properties are reduced compared with the reconstruction results of the dispersed inclusions because the crossed inclusions increase the identified sizes of the LIT technique and decrease the sensitivity of the measurement signal with respect to the deeper inclusion. Two inclusions can be accurately identified by the present combined LIT-SQP technique based on the imaging results even when the reconstruction accuracy of the crossed inclusions is reduced.
Fig. 9 Reconstruction results of two crossed inclusions. (a) Actual absorption coefficient distribution, (b) actual scattering coefficient distribution, (c) actual thermal conductivity distribution, (d) amplitude and phase angle of thermal wave signal at the left boundary, (e) amplitude and phase angle of thermal wave signal at the bottom boundary, (f) identified result of LIT technique, (g) final reconstruction result of absorption coefficient distribution, (h) final reconstruction result of scattering coefficient distribution, and (i) final reconstruction result of thermal conductivity distribution
6 Conclusions The absorption coefficient, scattering coefficient, and thermal conductivity distributions in 2D semitransparent media are accurately reconstructed by using the proposed combined LIT-SQP technique. First, the coupled radiation-conduction heat transfer is solved by the FVM combined with DOM, and the temperature and
radiative intensity distributions on the boundaries are served as measurement signals. Next, the LIT technique is employed to determine the preliminary positions of inclusions, and the DCM is used to extract the amplitude and phase angle information of the thermal wave signals. Then, the identified inclusions are assumed to be homogeneous square, and the SQP algorithm is applied to retrieve the optical and thermophysical parameters of the preliminary inclusions. Finally, the SQP algorithm is employed to reconstruct the absorption coefficient, scattering coefficient, and thermal conductivity distributions, in which the retrieval distributions in the previous step are used as the initial values. Furthermore, the effects of the number, position, geometric shape, and size of inclusions on the reconstruction results are investigated. The following conclusions can be drawn: (1) The characteristics of inclusions such as optical and thermal properties, geometric shape, boundary, and position can be accurately reconstructed by the LIT-SQP technique. (2) The combined LIT-SQP technique is more efficient and accurate than the LIT technique or SQP algorithm alone. (3) The computational time increases, and the reconstruction accuracy slightly decreases when the number of inclusion increases. The crossed inclusions reduce the imaging quality of the optical and thermal properties. (4) The size of inclusion slightly influences the reconstruction results of the LIT-SQP technique. Acknowledgements The supports of this work by the National Natural Science Foundation of China (No. 51576053) and the Major National Scientific Instruments and Equipment Development Special Foundation of China (No. 51327803) are gratefully acknowledged. A very special acknowledgement is also made to the editors and referees who make important comments to improve this paper. References [1] H. Y. Li, C. Y. Yang, A genetic algorithm for inverse radiation problems, Int J Heat Mass Transfer, 40(7) (1997) 1545-1549. [2] H. P. Tan, P. Y. Wang, X. L. Xia, Transient coupled radiation and conduction in an absorbing and scattering composite layer, J Thermophys Heat Transfer, 14(1) (2000) 77-87. [3] X. T. Gong, F. Q. Wang, H. Y. Wang, J. Y. Tan, Q. Z. Lai, H. Z. Han, Heat transfer enhancement analysis of tube receiver for parabolic trough solar collector with pin fin arrays inserting, Sol Energy, 144(1) (2017) 185-202. [4] X. Cai, J. Li, X. Ouyang, Z. Zhao, M. Su, In-line measurement of pneumatically conveyed particles by a light
transmission fluctuation method, Flow Meas Instru, 16(5) (2005) 315-320. [5] L. Y. Wei, H. Qi, Y. T. Ren, J. P. Sun, L. M. Ruan, Multi-parameter estimation in semitransparent graded-index media based on coupled optical and thermal information, Int J Therm Sci, 113 (2017) 116-129. [6] S. Siddiqa, M. A. Hossain, R. S. R. Gorla, Conduction-radiation effects on periodic magnetohydrodynamic natural convection boundary layer flow along a vertical surface, Int J Therm Sci, 53 (2012) 119-129. [7] S. M. H. Sarvari, J. R. Howell, S. H. Mansouri, Inverse boundary design conduction-radiation problem in irregular two-dimensional domains, Numerical Heat Transfer, Part B, 44(3) (2003) 209-224. [8] S. M. H. Sarvari, Inverse determination of heat source distribution in conductive–radiative media with irregular geometry, J Quant Spectrosc Radiat Transfer, 93(1-3) (2005) 383-395. [9] S. C. Sun, H. Qi, F. Z. Zhao, L. M. Ruan, B. X. Li, Inverse geometry design of two-dimensional complex radiative enclosures using krill herd optimization algorithm, Appl Therm Eng, 98 (2016) 1104-1115. [10] F. L. Rodrí guez, V. D. P. Nicolau, Inverse heat transfer approach for IR image reconstruction: Application to thermal non-destructive evaluation, Appl Therm Eng, 33-34 (2012) 109-118. [11] M. Cui, X. W. Gao, H. G. Chen, A new inverse approach for the equivalent gray radiative property of a non-gray medium using a modified zonal method and the complex-variable-differentiation method, J Quant Spectrosc Radiat Transfer, 112(8) (2011) 1336-1342. [12] Q. Cheng, J. L. Chai, Z. M. Zhang, Investigation of double-layer coating pigmented with CuO particles of different concentrations on aesthetic and thermal aspects, Int J Therm Sci, 105 (2016) 36-44. [13] B. Zhang, C. L. Xu, S. M. Wang, An inverse method for flue gas shielded metal surface temperature measurement based on infrared radiation, Meas Sci Technol, 27(7) (2016) 074002. [14] X. C. Wu, Y. C. Wu, J. Yang, Z. H. Wang, B. W. Zhou, G. Grehan, K. Cen, Modified convolution method to reconstruct particle hologram with an elliptical Gaussian beam illumination, Opt Express, 21(10) (2013) 12803-12814. [15] S. C. Sun, H. Qi, J. P. Sun, Y. T. Ren, L. M. Ruan, Estimation of thermophysical properties of phase change material by the hybrid SSO algorithms, Int J Therm Sci, 120 (2017) 121-135. [16] M. Cui, X. W. Gao, H. G. Chen, Inverse radiation analysis in an absorbing, emitting and non-gray
participating medium, Int J Therm Sci, 50(6) (2011) 898-905. [17] Z. C. Wang, J. L. Song, J. L. Chai, Q. Cheng, H. C. Zhou, The effect of BRDF surface on radiative heat transfer within a one-dimensional graded index medium, Int J Therm Sci, 77 (2014) 116-125. [18] E. M. Burghold, Y. Frekers, R. Kneer, Determination of time-dependent thermal contact conductance through IR-thermography, Int J Therm Sci, 98 (2015) 148-155. [19] R. Das, S. C. Mishra, M. Ajith, R. Uppaluri, An inverse analysis of a transient 2-D conduction-radiation problem using the lattice Boltzmann method and the finite volume method coupled with the genetic algorithm, J Quant Spectrosc Radiat Transfer, 109(11) (2008) 2060-2077. [20] R. Das, S. C. Mishra, R. Uppaluri, Multiparameter estimation in a transient conduction-radiation problem using the lattice boltzmann method and the finite-volume method coupled with the genetic algorithms, Numer Heat Transfer, Part A, 53(12) (2008) 1321-1338. [21] R. Das, S. C. Mishra, R. Uppaluri, Inverse analysis applied to retrieval of parameters and reconstruction of temperature field in a transient conduction–radiation heat transfer problem involving mixed boundary conditions, Int Commun Heat Mass Transfer, 37(1) (2010) 52-57. [22] R. Das, S. C. Mishra, T. B. P. Kumar, R. Uppaluri, An inverse analysis for parameter estimation applied to a non-Fourier conduction-radiation problem, Heat Transfer Eng, 32(6) (2011) 455-466. [23] H. Qi, L. M. Ruan, H. C. Zhang, Y. M. Wang, H. P. Tan, Inverse radiation analysis of a one-dimensional participating slab by stochastic particle swarm optimizer algorithm, Int J Therm Sci, 46(7) (2007) 649-661. [24] H. Qi, C. Y. Niu, S. Gong, Y. T. Ren, L. M. Ruan, Application of the hybrid particle swarm optimization algorithms for simultaneous estimation of multi-parameters in a transient conduction-radiation problem, Int J Heat Mass Transfer, 83(7) (2015) 428-440. [25] Y. T. Ren, H. Qi, F. Z. Zhao, L. M. Ruan, H. P. Tan, Simultaneous retrieval of temperature-dependent absorption coefficient and conductivity of participating media, Sci Rep, 6 (2016) 21998. [26] H. Qi, D. L. Wang, S. G. Wang, L. M. Ruan, Inverse transient radiation analysis in one-dimensional non-homogeneous participating slabs using particle swarm optimization algorithms, J Quant Spectrosc Radiat Transfer, 112(15) (2011) 2507-2519.
[27] B. Zhang, H. Qi, Y. T. Ren, S. C. Sun, L. M. Ruan, Inverse transient radiation analysis in one-dimensional participating slab using improved Ant Colony Optimization algorithms, J Quant Spectrosc Radiat Transfer, 133(2) (2014) 351-363. [28] B. Zhang, H. Qi, S. C. Sun, L. Ruan, H. P. Tan, A novel hybrid ant colony optimization and particle swarm optimization algorithm for inverse problems of coupled radiative and conductive heat transfer, Therm Sci, 20(2) (2016) 461-472. [29] B. Zhang, H. Qi, Y. T. Ren, S. C. Sun, L. M. Ruan, Application of homogenous continuous Ant Colony Optimization algorithm to inverse problem of one-dimensional coupled radiation and conduction heat transfer, Int J Heat Mass Transfer, 66 (2013) 507-516. [30] R. P. Chopade, V. Mohan, R. Mayank, R. V. S. Uppaluri, S. C. Mishra, Simultaneous retrieval of parameters in a transient conduction-radiation problem using a differential evolution algorithm, Numer Heat Transfer, Part A, 63(5) (2013) 373-395. [31] Y. T. Ren, H. Qi, X. Huang, W. Wang, L. M. Ruan, H. P. Tan, Application of improved krill herd algorithms to inverse radiation problems, Int J Therm Sci, 103(24) (2016) 24-34. [32] S. C. Sun, H. Qi, Y. T. Ren, X. Y. Yu, L. M. Ruan, Improved social spider optimization algorithms for solving inverse radiation and coupled radiation-conduction heat transfer problems, Int Commun Heat Mass Transfer, 87 (2017) 132-146. [33] M. Schweiger, S. R. Arridge, Optical tomographic reconstruction in a complex head model using a priori region boundary information, Phys Med Biol, 44(11) (1999) 2703-2721. [34] K. Ren, G. Bal, A. H. Hielscher, Frequency domain optical tomography based on the equation of radiative transfer, SIAM J Sci Comput, 28(4) (2006) 1463-1489. [35] H. K. Kim, A. H. Hielscher, A PDE-constrained SQP algorithm for optical tomography based on the frequency-domain equation of radiative transfer, Inverse Probl, 25(1) (2009) 015010. [36] J. Boulanger, A. Charette, Numerical developments for short-pulsed Near Infra-Red laser spectroscopy. Part II: inverse treatment, J Quant Spectrosc Radiat Transfer, 91(3) (2005) 297-318. [37] H. Qi, Y. B. Qiao, Y. T. Ren, J. W. Shi, Z. Y. Zhang, L. M. Ruan, Application of the sequential quadratic programming algorithm for reconstructing the distribution of optical parameters based on the time-domain
radiative transfer equation, Opt Express, 24(21) (2016) 24297-24312. [38] G. Busse, D. Wu, W. Karpen, Thermal wave imaging with phase sensitive modulated thermography, J Appl Phys, 71(8) (1992) 3962-3965. [39] W. Bai, B. S. Wong, Nondestructive evaluation of aircraft structure using lock-in thermography, SPIE's 5th Annual International Symposium on Nondestructive Evaluation and Health Monitoring of Aging Infrastructure, SPIE, Newport Beach, CA, United States, 2000, 37-46. [40] X. Maldague, S. Marinetti, Pulse phase infrared thermography, J Appl Phys, 79(5) (1996) 2694-2698. [41] J. Y. Liu, J. L. Gong, L. Q. Liu, L. Qin, Y. Wang, Investigation on stress distribution of multilayered composite structure (MCS) using infrared thermographic technique, Infrared Phys Technol, 61 (2013) 134-143. [42] J. Y. Liu, Q. J. Tang, X. Liu, Y. Wang, Research on the quantitative analysis of subsurface defects for non-destructive testing by lock-in thermography, NDT&E Int, 45(1) (2012) 104-110. [43] J. Y. Liu, L. Q. Liu, Y. Wang, Experimental study on active infrared thermography as a NDI tool for carbon-carbon composites, Composites Part B: Eng, 45(1) (2013) 138-147. [44] J. L. Gong, J. Y. Liu, L. Qin, Y. Wang, Investigation of carbon fiber reinforced polymer (CFRP) sheet with subsurface defects inspection using thermal-wave radar imaging (TWRI) based on the multi-transform technique, NDT&E Int, 62 (2014) 130-136. [45] M. F. Modest, Radiative heat transfer, McGraw-Hill, New York, 2003. [46] J. Y. Liu, Y. Wang, J. M. Dai, Research on thermal wave processing of lock-in thermography based on analyzing image sequences for NDT, Infrared Phys Technol, 53(5) (2010) 348-357. [47] R. B. Wilson, A simplicial algorithm for concave programming, Harward University, Boston, 1963. [48] S. P. Han, A globally convergent method for nonlinear programming, J Optim Theory Appl, 22(3) (1977) 297-309. [49] K. Schittkowski, The nonlinear programming method of Wilson, Han, and Powell with an augmented Lagrangian type line search function, Numer Math, 38(1) (1981) 83-114. [50] M. Fukushima, A successive quadratic programming algorithm with global and superlinear convergence
properties, Math Program, 35(3) (1986) 253-264. [51] J. C. Ye, K. J. Webb, C. A. Bouman, R. P. Millane, Optical diffusion tomography by iterative-coordinate-descent optimization in a Bayesian framework, J Opt Soc Am A, 16(10) (1999) 2400-2412.
Figure Captions Fig. 1 Schematic of 2D participating medium Fig. 2 Reconstruction process of the LIT-SQP technique Fig. 3 Actual distributions of (a) absorption coefficient, (b) scattering coefficient, and (c) thermal conductivity Fig. 4 Retrieval results of LIT technique. (a) Amplitude and phase angle of thermal wave signal at the left boundary, (b) amplitude and phase angle of thermal wave signal at the bottom boundary, and (c) identified position of inclusion by LIT technique Fig. 5
Final reconstruction results of (a) absorption coefficient, (b) scattering coefficient, and (c) thermal
conductivity Fig. 6 Reconstruction results of circular inclusion. (a) Actual absorption coefficient distribution, (b) actual scattering coefficient distribution, (c) actual thermal conductivity distribution, (d) amplitude and phase angle of thermal wave signal at the left boundary, (e) amplitude and phase angle of thermal wave signal at the bottom boundary, (f) identified result of LIT technique, (g) final reconstruction result of absorption coefficient distribution, (h) final reconstruction result of scattering coefficient distribution, and (i) final reconstruction result of thermal conductivity distribution Fig. 7 Reconstruction results of oval inclusion. (a) Actual absorption coefficient distribution, (b) actual scattering coefficient distribution, (c) actual thermal conductivity distribution, (d) amplitude and phase angle of thermal wave signal at the left boundary, (e) amplitude and phase angle of thermal wave signal at the bottom boundary, (f) identified result of LIT technique, (g) final reconstruction result of absorption coefficient distribution, (h) final reconstruction result of scattering coefficient distribution, and (i) final reconstruction result of thermal conductivity distribution Fig. 8 Reconstruction results of three square inclusions. (a) Actual absorption coefficient distribution, (b) actual scattering coefficient distribution, (c) actual thermal conductivity distribution, (d) amplitude and phase angle of thermal wave signal at the left boundary, (e) amplitude and phase angle of thermal wave signal at the bottom boundary, (f) identified result of LIT technique, (g) final reconstruction result of absorption coefficient distribution, (h) final reconstruction result of scattering coefficient distribution, and (i) final reconstruction result of thermal conductivity distribution Fig. 9 Reconstruction results of two crossed inclusions. (a) Actual absorption coefficient distribution, (b) actual scattering coefficient distribution, (c) actual thermal conductivity distribution, (d) amplitude and phase angle of thermal wave signal at the left boundary, (e) amplitude and phase angle of thermal wave signal at the bottom
boundary, (f) identified result of LIT technique, (g) final reconstruction result of absorption coefficient distribution, (h) final reconstruction result of scattering coefficient distribution, and (i) final reconstruction result of thermal conductivity distribution
y Ly q
as N
t
W
P
Ts hw
E
Measure signal
S 0
Incident laser
(Optical and thermal signals)
Lx
x
Fig. 1 Schematic of 2D participating medium
Real distribution (n defects)
Unknown inclusions LIT Identify the positions
Reflect the real distribution
SQP
Final result
Estimate 3n2 parameters
Preliminary result
SQP Reconstruct the field
Fig. 2 Reconstruction process of the LIT-SQP technique
x Lx
y Ly
(c)
y Ly
(b)
y Ly
(a)
x Lx
x Lx
Fig. 3 Actual distributions of (a) absorption coefficient, (b) scattering coefficient, and (c) thermal conductivity
0.5
-0.4
Phase angle
0.4
Amplitude
0.6
-0.6 0.3
-0.8 0.2
-0.2 -0.4 -0.6
0.3 -0.8 0.2
-1.0 0.1 0.0
(c)
(b)
0.4
Amplitude
0.5
-0.2
(a)
Unknown defect Phase angle
0.6
-1.0 0.1
0.2
0.4
0.6
y / Ly
0.8 0.675
0.835
-1.2 1.0
0.0
0.2 0.175
0.4 0.335
0.6
0.8
-1.2 1.0
x / Lx
Fig. 4 Retrieval results of LIT technique. (a) Amplitude and phase angle of thermal wave signal at the left boundary, (b) amplitude and phase angle of thermal wave signal at the bottom boundary, and (c) identified position of inclusion by LIT technique
x Lx
y Ly
(c)
y Ly
(b)
y Ly
(a)
x Lx
x Lx
Fig. 5 Final reconstruction results of (a) absorption coefficient, (b) scattering coefficient, and (c) thermal conductivity
y Ly
(c)
y Ly
(b)
y Ly
(a)
x Lx
x Lx
0.75
0.0
(f)
(e) -0.2
-0.6 0.30 -0.8 0.15
-1.0
0.4
0.375
0.6
0.8
-1.2 1.0
0.45 -0.6 0.30 -0.8 0.15
-1.0
0.00 0.0
0.2
0.4
0.6
x / Lx
y / Ly
0.585
0.655
0.8
-1.2 1.0
0.865
(i)
y Ly
(h)
y Ly
(g)
Unknown inclusion
x Lx
y Ly
0.2
-0.4
Amplitude
0.45
-0.2
0.60
Phase angle
-0.4
Amplitude
0.0
Phase angle
(d) 0.60
0.00 0.0
x Lx
0.75
x Lx
x Lx
Fig. 6 Reconstruction results of circular inclusion. (a) Actual absorption coefficient distribution, (b) actual scattering coefficient distribution, (c) actual thermal conductivity distribution, (d) amplitude and phase angle of thermal wave signal at the left boundary, (e) amplitude and phase angle of thermal wave signal at the bottom boundary, (f) identified result of LIT technique, (g) final reconstruction result of absorption coefficient distribution, (h) final reconstruction result of scattering coefficient distribution, and (i) final reconstruction result of thermal conductivity distribution
y Ly
(c)
y Ly
(b)
y Ly
(a)
x Lx
x Lx
0.8
(d)
(f)
(e) 0.60
-0.4
0.45
-0.6
0.30
-0.8
0.15
-1.0
-0.6 -0.8
0.2
Phase angle
-0.4 0.4
Amplitude
-0.2
Phase angle
Amplitude
-0.2
0.0
0.6
x Lx
0.75
0.2
Unknown inclusion
-1.0 0.2
0.175
0.4
0.335
0.6
0.8
0.00 0.0
-1.2 1.0
y / Ly
0.2
0.4
0.355
0.8
-1.2 1.0
0.645
(i)
y Ly
(h)
y Ly
(g)
0.6
x / Lx
x Lx
y Ly
0.0 0.0
x Lx
x Lx
Fig. 7 Reconstruction results of oval inclusion. (a) Actual absorption coefficient distribution, (b) actual scattering coefficient distribution, (c) actual thermal conductivity distribution, (d) amplitude and phase angle of thermal wave signal at the left boundary, (e) amplitude and phase angle of thermal wave signal at the bottom boundary, (f) identified result of LIT technique, (g) final reconstruction result of absorption coefficient distribution, (h) final reconstruction result of scattering coefficient distribution, and (i) final reconstruction result of thermal conductivity distribution
y Ly
(c)
y Ly
(b)
y Ly
(a)
x Lx
x Lx
0.60
-0.2
(f)
(e) -0.4 -0.6
0.30 -0.8 0.15
-1.0
0.4
0.6
y / Ly
0.675 0.585
0.8
-1.2 1.0
-0.6 0.30 -0.8 0.15
-1.0
0.00 0.0
0.2
0.4
0.6
x / Lx
0.175 0.325 0.425
0.835
0.8
-1.2 1.0
0.835
(i)
y Ly
(h)
y Ly
(g)
0.675 0.585
x Lx
y Ly
0.2
0.175 0.325 0.425
Unknown inclusions
-0.4
0.45
Phase angle Amplitude
0.45
Amplitude
-0.2
Phase angle
(d)
0.00 0.0
x Lx
0.60
x Lx
x Lx
Fig. 8 Reconstruction results of three square inclusions. (a) Actual absorption coefficient distribution, (b) actual scattering coefficient distribution, (c) actual thermal conductivity distribution, (d) amplitude and phase angle of thermal wave signal at the left boundary, (e) amplitude and phase angle of thermal wave signal at the bottom boundary, (f) identified result of LIT technique, (g) final reconstruction result of absorption coefficient distribution, (h) final reconstruction result of scattering coefficient distribution, and (i) final reconstruction result of thermal conductivity distribution
y Ly
(c)
y Ly
(b)
y Ly
(a)
x Lx
x Lx -0.2
(d)
0.2
(e) -0.4
0.4 -0.8 0.2
-0.2 -0.4
0.4 -0.6 -0.8
0.2
-1.0
(f)
0.0
0.6
Amplitude
-0.6
Phase angle
0.6
Amplitude
x Lx
0.8
Phase angle
0.8
-1.0 0.2
0.4
0.355
0.6
y / Ly
0.8
-1.2 1.0
0.0 0.0
0.2
0.175
0.735
0.6
x / Lx
0.525
0.8
0.685
(i)
y Ly
(h)
y Ly
(g)
0.4
0.335
Unknown inclusions
-1.2 1.0
x Lx
y Ly
0.0 0.0
x Lx
x Lx
Fig. 9 Reconstruction results of two crossed inclusions. (a) Actual absorption coefficient distribution, (b) actual scattering coefficient distribution, (c) actual thermal conductivity distribution, (d) amplitude and phase angle of thermal wave signal at the left boundary, (e) amplitude and phase angle of thermal wave signal at the bottom boundary, (f) identified result of LIT technique, (g) final reconstruction result of absorption coefficient distribution, (h) final reconstruction result of scattering coefficient distribution, and (i) final reconstruction result of thermal conductivity distribution
Table Captions Table 1 Parameters of background medium and inclusion Table 2 Retrieved NRMSEs and computational time of SQP and LIT-SQP methods Table 3 Reconstruction results for different sizes of inclusions
Table 1 Parameters of background medium and inclusion Parameters
Unit
Background medium
Inclusion
Absorption coefficient
m-1
10.0
1.0
Scattering coefficient
m-1
10.0
1.0
Thermal conductivity
W/(m K)
8.0
0.1
Table 2 Retrieval NRMSEs and computational time of SQP and LIT-SQP methods SQP Inclusion
LIT-SQP
NRMSE of a
NRMSE of s
NRMSE of
Time (h)
NRMSE of a
NRMSE of s
NRMSE of
Time (h)
Square
0.0330
0.0312
0.0285
42.59
0.0011
0.0009
0.0012
0.26
Circular
0.0365
0.0392
0.0314
46.04
0.0218
0.0181
0.0238
2.21
Oval
0.0343
0.0401
0.0299
45.11
0.0183
0.0150
0.0237
2.02
Table 3 Reconstruction results for different sizes of inclusions NRMSE 2
Sizes (m )
Time (h)
a
s
0.005×0.005
0.0035
0.0060
0.0066
0.23
0.01×0.01
0.0038
0.0061
0.0065
0.24
0.015×0.015
0.0036
0.0059
0.0061
0.26