Aylward, S.R., Jomier, J., Weeks, S., Bullitt, E.: Registration and Analysis of Vas- cular Images. Internat. Journal of Computer Vision 55(2/3), 123â138 (2003). 2.
Combined Model-Based Segmentation and Elastic Registration for Accurate Quantification of the Aortic Arch Andreas Biesdorf1 , Karl Rohr1 , Hendrik von Tengg-Kobligk2, and Stefan W¨ orz1 1 University of Heidelberg, BIOQUANT, IPMB, and DKFZ Heidelberg Dept. Bioinformatics and Functional Genomics, Biomedical Computer Vision Group 2 German Cancer Research Center (DKFZ) Heidelberg, Dept. of Radiology and University Hospital Heidelberg, Dept. of Diagnostic and Interventional Radiology
Abstract. Accurate quantification of the morphology of vessels is important for diagnosis and treatment of cardiovascular diseases. We introduce a new approach for the quantification of the aortic arch morphology that combines 3D model-based segmentation with elastic image registration. The performance of the approach has been evaluated using 3D synthetic images and clinically relevant 3D CTA images including pathologies. We also performed a comparison with a previous approach.
1
Introduction
Diseases of the aortic arch are a major cause of death in the western world and can be diagnosed using, for example, computed tomography angiography (CTA), and treated by minimally-invasive placement using an endovascular graft. For this task, individual morphological parameters such as the centerline position and the vessel diameters have to be quantified. The geometry of the aortic arch can be automatically determined from radiological images by segmentation approaches. A wide spectrum of different approaches exists, for example, approaches based on differential measures, deformable models, or parametric intensity models. Alternatively, segmentation may also be achieved by registration, where an atlas or a model is registered with an image of a patient (e.g., [2,3]). In recent years, increased attention has been paid to combined approaches for vessel analysis that integrate both segmentation and registration (e.g., [1,4,5,8]). Existing approaches can be classified according to the transformation model (e.g., rigid, affine, elastic), the type of information used for registration (e.g., point sets, surfaces, intensities), and whether prior information is employed (e.g., an atlas or a template image). Most approaches use rigid transformation models (e.g., [1]), or splines on a regular grid such as B-Splines (e.g., [4]) and Cardinal-Splines (e.g., [5]). In addition, registration is performed based on, for instance, surfaces (e.g., [5]), point sets (e.g., [8]), centerlines (e.g., [1]), or binarized image volumes (e.g., [4]). Thus, the image intensities are not directly exploited. Moreover, none of the combined approaches uses an incremental tracking scheme or employs a parametric intensity model for vessel segmentation. T. Jiang et al. (Eds.): MICCAI 2010, Part I, LNCS 6361, pp. 444–451, 2010. c Springer-Verlag Berlin Heidelberg 2010 �
Combined Model-Based Segmentation and Elastic Registration
445
In this contribution, we introduce a novel approach for the quantification of the aortic arch morphology from 3D tomographic images. Our approach combines 3D fitting of a parametric intensity model with intensity-based elastic image registration. The image intensities are exploited directly, thus the full intensity information is incorporated. In comparison to a pure model fitting approach (e.g., [6]), the combined approach can cope with a larger spectrum of vessel shapes and even with shapes that deviate significantly from the model used for segmentation. At the same time, our approach is constrained to meaningful shapes by employing a physically-based deformation model for registration. Moreover, our approach can cope with very different shapes of vessel centerlines since an incremental tracking scheme is used. In contrast to atlas- or model-based segmentation (e.g., [2,3]), our approach does not require a prior segmentation. Instead, the intensity template is automatically generated by model-based segmentation. We have successfully applied our approach to 3D synthetic images and clinically relevant 3D CTA images, and the performance has been evaluated.
2
Model-Based Segmentation and Elastic Registration
Our approach for the segmentation of vessels in 3D tomographic images combines model-based segmentation with elastic image registration. The approach is based on an energy-minimizing functional Jk corresponding to a vessel segment k: roi roi roi , pk ) + JR (gI,k , gM,k , uk ) Jk (pk , uk ) = JM (gM , gI,k
(1)
The first term JM denotes an intensity similarity measure between a 3D cylinroi drical intensity model gM with parameters pk and the intensities gI,k within a region-of-interest (ROI) of a 3D tomographic image gI . The second term JR roi denotes an energy-minimizing functional for elastic registration of gI,k with an roi image gM,k generated from the 3D intensity model gM . The result of elastic registration is described by the deformation field uk . By minimizing the overall functional Jk , the segmentation result from 3D model fitting is refined using elastic image registration, while at the same time the registration result is used to improve 3D model fitting. For segmentation of an entire vessel such as the aortic arch, we incrementally minimize Jk along the vessel using a tracking approach based on a Kalman filter assuming a linear motion model. Typically, a segmentation result of the aorta consists of several hundreds overlapping vessel segments. Branches can be detected based on a connected components analysis. The 3D parametric intensity model used in JM represents an ideal sharp 3D cylinder convolved with a 3D Gaussian. The model includes parameters for the width R of the tubular structure and the image blur σ, and is well-suited to describe the plateau-like intensity structure of thick vessels such as the aorta: � √ � � c2 − 1 2 σ 2 + r2 R2 3 + c 1 , c1 = σ 2 , c = (2) gCyl (x, R, σ) = Φ 2 c1 3 2σ + r2 2σ 2 + r2 �x 2 where Φ(x) = −∞ (2π)−1/2 e−ξ /2 dξ denotes the Gaussian error function, x = � (x, y, z)T , and r = x2 + y 2 . The complete model also incorporates intensity
446
A. Biesdorf et al.
(a)
(b)
(c)
(d)
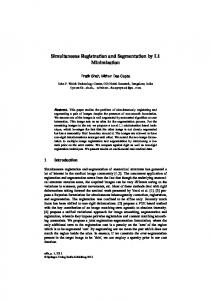
Fig. 1. (a) Cross-section of a 3D CTA image of an aorta and overlaid result of modelbased segmentation (black) and combined model-based segmentation and elastic registration (white). (b) Segmentation result of the 2D combined approach for a 3D synthetic image of a twisted torus. (c) Segmentation result of the 2D combined approach for a 3D CTA image. (d) Computed vessel contours using the model-based approach (black) and the 2D combined approach (white) for a section of a 3D CTA image.
levels a0 (surrounding tissue) and a1 (vessel) as well as a 3D rigid transform R with rotation α = (α, β, γ)T and translation x0 = (x0 , y0 , z0 )T , which yields gM (x, p) = a0 + (a1 − a0 ) gCyl (R(x, α, x0 ), R, σ)
(3)
with 10 parameters p = (R, a0 , a1 , σ, α, β, γ, x0 , y0 , z0 )T [6]. The cylindrical model gM can accurately represent a vessel segment if the vessel has circular cross-sections. However, the model may be inaccurate in the case of non-circular cross-sections (e.g., Fig. 1a, black contour). To improve the accuracy between the model and the true vessel shape in this case, we suggest roi generated from the 3D intensity model using elastic registration of an image gM,k roi gM with a ROI of the original image gI,k . The result of elastic registration is a deformation field uk which can be used to compute a refined vessel contour and centerline position (e.g., Fig. 1a, white contour). To limit the final segmentation result in (1) to physically meaningful shapes, the deformations uk are computed based on Gaussian elastic body splines (e.g., [7]). 2.1
Optimization of the Energy-Minimizing Functional Jk
The functional in (1) is optimized by an iterative scheme which alternatingly minimizes JM and JR for each vessel segment k to obtain estimates for the model parameters pk and the deformation field uk (see Fig. 2). For a vessel segment k, we estimate pk by least-squares model fitting of gM to the image roi by minimizing intensities gI,k JM (pk ) =
� � 2 roi gM (x, pk ) − gI,k (x)
(4)
roi x∈gI,k
using the method of Levenberg-Marquardt. To compute the deformation field roi uk , we generate an image gM,k from the fitted intensity model gM and perform roi intensity-based registration with gI,k by minimizing
Combined Model-Based Segmentation and Elastic Registration
447
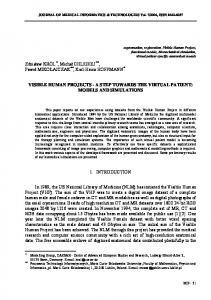
Fig. 2. Incremental combined vessel segmentation approach roi roi JR (uk ) = JData,I (gI,k , gM,k , uIk ) + λI JI (uk , uIk ) + λE JElastic (uk )
(5)
where λI and λE are scalar weights. We use λE = 0.1 while λI is estimated automatically. The first term JData,I describes the intensity-based similarity mearoi roi sure between gI,k and gM,k . Since gM incorporates intensity levels a0 and a1 , minimization of JData,I can be considered a monomodal registration problem. Therefore, we use the sum-of-squared intensity differences for JData,I (cf. (4)). With the second term JI , the intensity-based deformation field uIk is coupled with the final deformation field uk using a weighted Euclidean distance. The third term JElastic represents the regularization of the deformation field according to the Navier equation of linear elasticity. Optimization of JR is performed alternatingly w.r.t. uIk and uk . Note that the functional (5) has been formulated such that for the minimization of λI JI + λE JElastic w.r.t. uk an analytic solution can be derived [7]. For the minimization w.r.t. uIk , JData,I + JI has to be minimized for which we use the method of Levenberg-Marquardt. The result of elastic registration is used to improve the result of model fitting by re-estimating the model parameters pk including the radius R, the orientation α, as well as the translation x0 . To update the radius R, we compute the mean radius along the vessel contour based on uk . For the translation x0 we obtain new estimates based on the deformation uk (x0 ). The orientation α can be reestimated using finite differences of the positions of two points close to x0 . Based on the updated parameter vector pk and the deformation field uk , we again perform model-based segmentation with subsequent elastic registration for minimizing J. Note that now, model fitting is performed on a deformed roi . Performing model fitting on the image which is obtained by applying uk to gI,k deformed image has the advantage that the model parameters can be estimated more accurately since the deformed image is more similar to the underlying model than the original image. This alternating optimization is repeated until the results of model fitting and elastic registration converge for a vessel segment k. After convergence and having estimated the parameters for the current vessel segment, a new parameter vector pk+1 is predicted based on a Kalman filter and used as initialization for the next vessel segment along a vessel. For initialization of uk+1 in the next iteration, the current deformation field uk is used.
448
2.2
A. Biesdorf et al.
Exploiting 2D and 3D Image Information
With our combined approach for vessel segmentation there are different possibilities to exploit the intensity information. We have developed two approaches, a 3D and a 2D approach, which differ w.r.t. computational efficiency and segmentation accuracy. The first approach performs model fitting within a 3D ROI and uses 3D image registration of the 3D ROI. Since with this approach all image information within a 3D ROI is exploited, the accuracy as well as the computational complexity is expected to be relatively high. The second variant uses 3D model fitting only for estimating the initial 3D orientation α, while Jk in (1) is minimized based on model fitting and image registration of 2D image cross-sections orthogonal to the vessel centerline. Compared to the 3D approach, the computational complexity of the 2D approach is significantly lower.
3
Experimental Evaluation
We have applied our approach to 240 3D synthetic images and 17 clinically relevant 3D CTA images of the human thorax. To quantify the segmentation accuracy, we have computed the mean errors for clinically relevant measures comprising the minimum, mean, and maximum vessel diameters, eD,min , eD,mean , and eD,max , respectively, as well as the mean error for the centerline position ex0 . Note that, in general, vessel cross-sections are noncircular. To compute eD,min , eD,mean , and eD,max , we have defined a diameter by the length of a straight line that connects two points on the vessel boundary and that passes through the center x0 . The error measures for the diameters were determined by evaluating a sample of 1000 different diameters of a cross-section where the directions of the diameters are equiangularly distributed. ex0 is defined as Euclidean distance between the true center of the vessel and the estimated position x0 . For all measures, we have computed mean errors by averaging over all vessel segments. 3.1
3D Synthetic Images
In a first experiment, we have generated two different sets of 3D synthetic images. The first set contains 120 different images of straight twisted cylinders with elliptical cross-sections that differ in radii and the level of Gaussian image noise (σn = 0, 1, 3, 5, 20), and have a size of 200 × 200 × 200 voxels. The second image set contains 120 different images of twisted tori with elliptical cross-sections that also differ in radii and the level of Gaussian image noise, and have a size of 400 × 400 × 200 voxels (see Fig. 1b for an example). Table 1 shows the results of the segmentation accuracy of the two new combined approaches (2D and 3D) in comparison to a previous model-based approach [6]. Segmentation results: 120 twisted cylinders. For ex0 we obtain similar very good results for the new approaches and the previous approach with subvoxel accuracy of ex0 ≤ 0.02 voxels. For eD,mean , the results of the approaches are comparable, while the 2D combined approach yields the best result. For
Combined Model-Based Segmentation and Elastic Registration
449
eD,min and eD,max , the accuracy of the new approaches is significantly better than that of the previous approach. In comparison to the previous approach, the 2D and 3D combined approaches yield improvements of 61% - 66% for eD,min and eD,max . Segmentation results: 120 twisted tori. For eD,min , eD,mean , and eD,max , the previous approach yields similar results as for the first image set with eD,min = 3.14 voxels, eD,mean = 0.09 voxels, and eD,max = 3.83 voxels. However, for the 2D combined approach we obtain a significant improvement for all diameter measures with eD,min = 0.61 voxels, eD,mean = 0.05 voxels, and eD,max = 0.88 voxels, which is an improvement of 77% – 80% for eD,min and eD,max as well as 44% for eD,mean compared to the previous approach. The 3D combined approach, however, yields the best result for all diameter measures with eD,min = 0.37 voxels, eD,mean = 0.04 voxels, and eD,max = 0.52 voxels, which, in comparison to the previous approach, are improvements of 88%, 56%, and 86%, respectively. For ex0 , all approaches yield very good results with subvoxel accuracy, however the 3D combined approach yields the best result with ex0 = 0.08 voxels, which is an improvement of 50% compared to the previous approach and 38% compared to the 2D combined approach. 3.2
3D CTA Images
In a second experiment, we applied our approach to two different sets of 3D CTA images of the thorax. The first set of images contains ten 3D CTA images of patients with only slight pathologies. The second set of images contains seven 3D CTA images of patients with severe pathologies such as aneurysms or highly curved vessel centerlines. The CTA images comprise 619 to 829 slices with a size of 512 × 512 voxels. For evaluation, manual segmentation by a radiologist was performed for 15 of the 3D CTA images, while two of the images were segmented by a trained observer. Table 2 shows the results for the two new combined approaches and a previous model-based approach [6] for both sets of images. Segmentation results: Ten 3D CTA images. For the first set of 3D CTA images and for eD,min as well as eD,max the accuracy of our new approaches is significantly better than that of the previous approach, while the best result is obtained for the 3D combined approach. For eD,mean and ex0 we obtain similar good results for the new approaches and the previous approach while for eD,mean the best result is obtained for the 3D combined approach and for ex0 Table 1. Mean errors for the diameters eD,min , eD,mean , and eD,max , and the centerline position ex0 for different approaches
``` 120 twisted tori ``` Accuracy 120 twisted cylinders ``` Approach `` eD,min eD,mean eD,max ex0 eD,min eD,mean eD,max ex0 Model-based approach 2D combined approach 3D combined approach
3.01 1.04 1.02
0.09 0.07 0.09
3.67 0.01 1.42 0.02 1.42 0.01
3.14 0.61 0.37
0.09 0.05 0.04
3.83 0.16 0.88 0.13 0.52 0.08
450
A. Biesdorf et al.
(a)
(b)
(c)
(d)
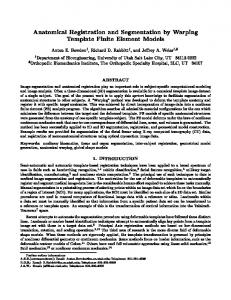
Fig. 3. (a), (c) Segmentation results of the 3D combined approach for two 3D CTA images showing a pathology. (b), (d) Vessel contours using the model-based approach (black) and the 3D combined approach (white) for a section of the 3D CTA images.
the best result is obtained for the 2D combined approach. In Fig. 1c,d we show the segmentation result of the 2D combined approach for a 3D CTA image as well as a section of the same image and the result of the 2D combined approach in comparison to a previous approach. It can be seen that the new approach yields a significant improvement in highly curved regions. Segmentation results: Seven 3D CTA images with pathologies. For the second set of 3D CTA images, we consistently obtain more accurate results for the new combined approaches. For eD,min , eD,mean , and eD,max the accuracy of the new approaches is significantly better than that of the previous approach, while the best result is obtained for the 3D combined approach with improvements of 21% to 57% compared to the previous approach as well as improvements of 9% to 15% compared to the 2D combined approach. For ex0 , the 2D combined approach the 2D combined approach consistently yields the most accurate result. In Fig. 3 we show segmentation results of the 3D combined approach for two 3D CTA images as well as sections of the same images and the result of the new approach in comparison to the previous approach. It can be seen that the new approach yields a significant improvement. Note that for the image in Fig. 3b, only the new approach succeeds to fully segment the pathology, while the previous approach fails to segment the last part of the pathology. Overall, it turns out that for eD,min and eD,max the new 2D and 3D combined approaches yield more accurate results than the previous approach. For ex0 , the 2D combined approach yields the best result, while for eD,mean , the 3D combined approach yields the best result. The computation time for a vessel segment on a Table 2. Mean errors for the diameters eD,min , eD,mean , and eD,max , and the centerline position ex0 for different approaches
``` Seven pathologies ``` Accuracy Ten 3D CTA images ``` Approach `` eD,min eD,mean eD,max ex0 eD,min eD,mean eD,max ex0 Model-based approach 2D combined approach 3D combined approach
5.40 4.67 4.24
2.27 2.38 2.19
1.67 0.65 1.58 0.47 1.46 0.83
7.42 5.19 4.70
2.32 1.89 1.83
6.15 1.00 3.14 0.63 2.66 0.96
Combined Model-Based Segmentation and Elastic Registration
451
2.40 GHz Intel Core 2 Quad CPU is about 1-2 seconds for the 2D approach and about 50-60 seconds for the 3D approach.
4
Discussion
We have introduced a new approach for the quantification of the aortic arch from 3D CTA images that combines fitting of a parametric intensity model with intensity-based elastic image registration. We have demonstrated the applicability of our approach using 3D synthetic images and clinically relevant 3D CTA images. From the experiments it turned out that the new combined approach consistently yields more accurate segmentation results than a previous segmentation approach for the minimum and maximum diameters, which are the most relevant clinical measures. For real 3D CTA images, the 2D combined approach is most accurate for estimating the centerline position, while the 3D combined approach is most accurate for estimating the diameters. It also turned out that for the new approach significant improvements are obtained for difficult segmentation tasks, in particular, for pathologies and highly curved vessel centerlines. Acknowledgment. Support of the Deutsche Forschungsgemeinschaft (DFG) within the project QuantVessel (RO 2471/6) is gratefully acknowledged.
References 1. Aylward, S.R., Jomier, J., Weeks, S., Bullitt, E.: Registration and Analysis of Vascular Images. Internat. Journal of Computer Vision 55(2/3), 123–138 (2003) 2. Barber, D., Oubel, E., Frangi, A., Hose, D.: Efficient computational fluid dynamics mesh generation by image registration. Med. Imag. Anal. 11(5), 648–662 (2007) 3. Isgum, I., Staring, M., Rutten, A., Prokop, M., Viergever, M., van Ginneken, B.: Multi-Atlas-Based Segmentation With Local Decision Fusion – Application to Cardiac and Aortic Segmentation in CT Scans. IEEE Trans. Med. Imaging 28(7), 1000– 1010 (2009) 4. Kang, D.G., Suh, D., Ra, J.: Three-Dimensional Blood Vessel Quantification via Centerline Deformation. IEEE Trans. Med. Imaging 28(3), 405–414 (2009) 5. Wong, W., Chung, A.: Augmented Vessels for Quantitative Analysis of Vascular Abnormalities and Endovascular Treatment Planning. IEEE Trans. Med. Imaging 25(6), 665–684 (2006) 6. W¨ orz, S., Rohr, K.: Segmentation and Quantification of Human Vessels Using a 3-D Cylindrical Intensity Model. IEEE Trans. on Image Processing 16(8), 1994–2004 (2007) 7. W¨ orz, S., Rohr, K.: Hybrid Physics-Based Elastic Image Registration Using Approximating Splines. In: Reinhardt, J., Pluim, J. (eds.) Proc SPIE Medical Imaging 2008: Image Processing, San Diego, CA/USA, pp. 6914–6930 (February 2008) 8. Zhao, F., Zhang, H., Wahle, A., Matthew, T.T., Stolpen, A.H., Scholz, T.D., Sonka, M.: Congenital aortic disease: 4D magnetic resonance segmentation and quantitative analysis. Medical Image Analysis 13(3), 483–493 (2009)