European Cells M Doube et al. and Materials Vol. 19 2010 (pages 242-251)
ISSN 1473-2262 Bone and cartilage stiffness and mineralisation
COMBINED NANOINDENTATION TESTING AND SCANNING ELECTRON MICROSCOPY OF BONE AND ARTICULAR CALCIFIED CARTILAGE IN AN EQUINE FRACTURE PREDILECTION SITE M. Doube1*, E.C. Firth2, A. Boyde1, and A.J. Bushby3 1
Biophysics, Oral Growth and Development, Queen Mary University of London, London, UK Institute of Veterinary, Animal and Biomedical Sciences, Massey University, Palmerston North, New Zealand 3 Department of Materials, School of Engineering, Queen Mary University of London, London, UK
2
Abstract
Introduction
Condylar fracture of the third metacarpal bone (Mc3) is the commonest cause of racetrack fatality in Thoroughbred horses. Linear defects involving hyaline articular cartilage, articular calcified cartilage (ACC) and subchondral bone (SCB) have been associated with the fracture initiation site, which lies in the sagittal grooves of the Mc3 condyle. We discovered areas of thickened and abnormally-mineralised ACC in the sagittal grooves of several normal 18-monthold horses, at the same site that linear defects and condylar fracture occur in older Thoroughbreds and questioned whether this tissue had altered mechanical properties. We embedded bone slices in PMMA, prepared flat surfaces normal to the articular surface and studied ACC and SCB using combined quantitative backscattered electron scanning electron microscopy (qBSE) and nanoindentation testing: this allowed correlation of mineralisation density and tissue stiffness (E) at the micron scale. We studied both normal and affected grooves, and also normal condylar regions. Large arrays of indentations could be visualised as 2-dimensional maps of E with a limit to resolution of indentation spacing, which is much larger than qBSE pixel spacing. ACC was more highly mineralised but less stiff in early linear defects than in control regions, while subchondral bone was more highly mineralised and stiffer in specimens with early linear defects than those without. Thus both ACC and SCB mineralisation may be abnormal in a class of early linear defect in 18-month-old Thoroughbred horses, and this may possibly contribute to later fracture of the Mc3 condyle.
Condylar fracture of the third metacarpal bone (Mc3) of Thoroughbred racehorses is a common injury that occurs during normal racing and training activity (Bassage and Richardson, 1998; Ellis, 1994; Rick et al., 1983) and is the leading cause of racetrack fatality in the United Kingdom (Parkin et al., 2004). Condylar fracture of Mc3 usually initiates in or near a sagittal groove where linear defects involving articular calcified cartilage (ACC) and subchondral bone are often found (Parkin et al., 2006; Riggs et al., 1999a; Riggs et al., 1999b). Linear defects are likely to predispose individuals to condylar fracture (Swindlehurst, 2007), possibly by acting as stressconcentrating notches (Currey et al., 2004), but a full explanation for fracture predilection in these sites is lacking. We have found regions of thickened, aberrantly mineralised ACC associated with disorganised, highturnover subchondral bone and enlarged marrow spaces in the sagittal grooves of Mc3 distal condyles from 18month-old horses prior to the onset of race-training (Doube et al., 2007; Firth et al., 2009). Here, delayed chondroclastic resorption of ACC appears to have occurred in the first few months of life, resulting in poor structural integration of ACC and subchondral bone and contributing to the development of linear defects. Within this abnormal ACC, quantitative backscattered electron scanning electron microscopy (qBSE) imaging showed small islands (20-50 μm diameter) of highly mineralised ACC separated by strands of unmineralised cartilage matrix, forming a discontinuously-mineralised band of ACC (Fig. 1a and Doube et al., 2007). The material properties of this abnormally-mineralised ACC were unknown, yet might be important for understanding condylar fracture initiation. We propose that aberrant osteochondral development early in life predisposes horses to fracture of the Mc3 sagittal groove during adulthood. Correlated nanoindentation testing and qBSE imaging has been used to determine relationships between elastic moduli and mineralisation densities of ACC and subchondral bone in normal equine (Bushby et al., 2004; Ferguson et al., 2008) and human (Gupta et al., 2005) joints, in osteoarthritic human patellae (Ferguson et al., 2003) and in carious human dentine (Angker et al., 2004). The indentation modulus of mineralised tissue is related to mineral content and organisation within the matrix (Oyen et al., 2008), as well as collagen orientation (Rho et al., 2001) and tissue hydration (Bushby et al., 2004). Correlated qBSE imaging and nanoindentation testing
Keywords: Nanoindentation, scanning electron microscopy, bone, cartilage, mineralisation.
*Address for correspondence Michael Doube Department of Bioengineering Imperial College London London SW7 2AZ United Kingdom Telephone Number: +44 (0)20 7594 7426 E-mail:
[email protected]
242
www.ecmjournal.org
M Doube et al.
Bone and cartilage stiffness and mineralisation
allows a greater understanding of tissue qualities than either method alone because the contribution of mineral to indentation modulus can be determined directly. For example, it has been shown that ACC and subchondral bone have different mineralisation-stiffness relationships, with ACC generally having a greater mineral content for the same indentation modulus than subchondral bone (Ferguson et al., 2003; Gupta et al., 2005). Both stiffness and mineralisation density affect the amount of energy absorbed during failure (fracture energy) and sensitivity to stress concentration due to features of small radius such as cracks (notch sensitivity) in bending tests on mineralised tissues (Currey et al., 2004), so it is important to determine both qualities in a fracture predilection site. This study sought to discover material deficiencies within ACC and subchondral bone that might be related to previously identified histomorphological variations in the sagittal grooves from equine Mc3 (Doube et al., 2007; Riggs et al., 1999a). We applied combined nanoindentation testing and qBSE imaging to determine the mineralisation density and indentation stiffness in ACC and subchondral bone from normal and abnormal Mc3 sagittal grooves. Materials and Methods Specimen preparation The distal condyles of Mc3 were collected from the right forelimbs of 12 18-month old horses. These were part of an experiment undertaken to examine possible effects of preconditioning exercise on the musculoskeletal system (Doube et al., 2007; Kawcak et al. 2010; Nugent et al., 2004; Rogers et al., 2008). However, it is very important to note at the outset that no significant differences were found between the animal groups in the current study, as in our previous work on ACC mineralisation in the same specimens (Doube et al. 2007). Nevertheless, for the sake of completeness, we briefly summarise the experiment, but, again we emphasise that we were not looking for, and found no evidence of, differences between the exercise groups. Table 1 summarises the distribution of morphologically ‘affected’ (see Nanoindentation for definition) specimens between the exercise groups. Six of the 12 foals ran 1020 m, 5 days per week at a base speed, which increased from 4.20 ms-1 at 10 days, to 5.56 ms-1 at 4 months, to 6.66 ms-1 at 6 months, after which time a 129 m sprint at 12.5 ms-1 (mean) was introduced after the first 500 m at base speed. Speed was regulated by a pair of 4-wheeled motorcycles, one ahead of and one behind the horses. All preconditioning was performed on a turf track with a sandy base; between the imposed preconditioning exercise sessions animals had free access to pasture and exercise; the 6 control animals had the latter exercise at pasture only. All live animal procedures were performed with permission from the relevant animal ethics committee. After euthanasia, 2-3 mm thick osteochondral slices were cut in a low-speed diamond saw (LabCut; DR Bennett Ltd, London, UK) from the condyle in the palmar-35ºoblique-frontal plane so as to coincide with the usual location of sagittal groove linear defects (Boyde and Firth, 2005). Osteochondral slices were fixed in 70% ethanol, dehydrated in 100% ethanol and embedded in poly-
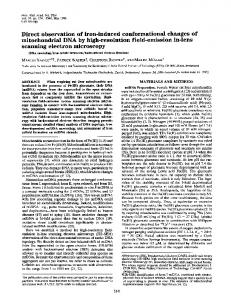
methylmethacrylate (PMMA). Block surfaces were ground flat, polished with increasing fineness of abrasive then finished in a diamond ultramiller (Reichert-Jung Ultramiller; Leica UK Ltd, Milton Keynes, UK). Specimens were carbon coated and imaged in qBSE for other experiments (Doube et al., 2005; Doube et al., 2007); these images were used to design nanoindentation arrays. Nanoindentation Two sites were tested per specimen: one in the lateral sagittal groove and one in a control condylar region 5 mm lateral, i.e. abaxial, to the sagittal groove. Specimens were designated ‘affected’ or ‘unaffected’ based on morphological criteria: those specimens with at least one site containing thickened, poorly mineralised ACC were ‘affected’ (Fig. 1a) and those with thin ACC and wellintegrated ACC and subchondral bone in both sites were ‘unaffected’ (Fig. 1b). The control region was chosen as a site where ACC was always well mineralised and integrated with underlying subchondral bone and did not display any of the features of ‘affected’ ACC, even in ‘affected’ specimens. Selecting these sites allowed internal comparisons between sagittal groove and control (condyle) sites within the same joint. Arrays of between 708-1492 indentations were designed individually for each site, using 50× qBSE images as tissue maps and an ImageJ (Rasband, 2007) macro that produced a scaled layout file (Doube, 2007a) for the nanoindenter (UMIS 2000, CSIRO, Lindfield, NSW, Australia). The macro also drew the desired array on the tissue map and gave an estimated time to completion (Fig. 1). Each array incorporated hyaline articular cartilage (HAC), ACC and subchondral bone, contained at least 500 μm depth of subchondral bone and incorporated sufficient ACC to result in at least 50 usable ACC Table 1. Distribution of affected specimens within the conditioned and control horses. Horse ID Exercise Affected 1
*
+
3 13 16
*
17
+
19
*
+
20
*
+
*
+
24 29 30 31 33
+ * +
Four of seven affected specimens (+) were from conditioned horses (*). There was no significant correlation between exercise group and specimen type. 243
www.ecmjournal.org
M Doube et al.
Bone and cartilage stiffness and mineralisation
indentations. Indentations were spaced at 20 μm intervals in x and y. Twenty-four sites in total were tested, comprising 2 sites from each of the 12 osteochondral slices. Each specimen block was glued to a steel stub with cyanoacrylate adhesive and mounted on the nanoindenter stage. The indenter tip was aligned in x, y and z axes with a microscope mounted to the indentation apparatus. Visualisation of the specimen in the microscope allowed rotational orientation of the specimen and accurate placement of the array in the desired microanatomical location. Parameters for indentation were similar to those used in earlier experiments on calcified tissues (Bembey, 2008; Bushby et al., 2004; Ferguson et al., 2003; Ferguson et al., 2008). A 5 μm radius spherical diamond indenter tip was used to make indentations in 40 load increments, with 75% partial unloading between each increment, to a maximum of 20 mN. Contact force was set to 0.03 mN. A single indenter tip was calibrated (Zhu et al., 2008) and used for all indentations. Measurements of force (mN) versus z-displacement (nm) were logged to hard disk at each load increment. A set of marker indents were included in the array layout to facilitate localisation of the array in later qBSE imaging; these were incremented to a maximum force of 50 mN. Mineralised tissues have viscoplastic as well as elastic properties, so the dwell time at each incremental loading was set to the minimum allowed by the apparatus (0.1 seconds) to avoid creep effects interfering with measurements of elastic modulus. A spherical indenter tip was used rather than a Berkovich tip, increasing the loading rate during unloading and reducing the severity of the stress field, resulting in lesser effects of creep. Nanoindentation data processing Each indentation resulted in a dataset comprising 40 forcedisplacement data points, each point corresponding to a loading increment. Previous work found a low-modulus surface layer and stabilisation of elastic modulus once this surface layer had been passed (Bushby et al., 2004). For this reason, force-displacement data from only the deepest 10 loading increments were used to determine elastic modulus. Elastic modulus was calculated as a function of contact depth (Field and Swain, 1993) for each load-partial unload data pair, and a mean value of indentation modulus (E) was derived for each indentation site from the 10 deepest increments. E’ may be calculated for spherical indentations to allow for better comparison with Berkovich indenter data. The reduced modulus, Er, was calculated using Hertzian contact mechanics: Er =
3 P ⎛1 1 ⎞ ⎜ − ⎟ 4 he3 / 2 ⎝ R R' ⎠
Fig. 1. Nanoindentation Array Maps. Nanoindentation array layouts designed with UmisArrayDesigner.txt on affected (a) and unaffected (b) sagittal grooves. Nanoindentation tests were placed at 20 μm intervals in x and y. Note the thicker layer of ACC and patchy mineralisation in (b). Taller, narrower arrays were required for affected ACC in order to sample similar depths of subchondral bone in each specimen and provide a minimum of 50 usable indentation tests from ACC. ACC, articular calcified cartilage; SCB, subchondral bone; arrowheads, cement line. Backscatter coefficients were calibrated against brominated () methacrylate standards and a greyscale applied.
1/ 2
(1)
where he is the elastic penetration depth of the sphere under force P, and 1 ⎞ ⎛1 ⎜ − ⎟ ⎝ R R' ⎠
(2) is the relative curvature between the sphere of radius R and residual impression in the surface of radius R’ (Bushby, 2001). E’ is derived from Er again, using
1 1 1 = + E r E' s E' i
(3)
and
E' x =
Ex 1 − v x2
(4)
Where v is Poisson’s ratio for material x.
244
www.ecmjournal.org
M Doube et al.
Bone and cartilage stiffness and mineralisation
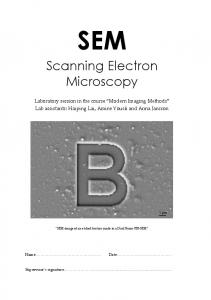
Fig. 2. Tissue Typing with UmisArray. qBSE image (a) displays mineralisation density at the submicron scale while the nanoindentation map has been overlaid for combined measurement using a topographic BSE (A-B) image (b) as a guide. By stepping through every indentation in sequence, the tissue type at each site was identified and associated with E and mineralisation density. The selected indentation site, 70, was classified as 0 (reject) as it was not completely filled with mineralised matrix. Data were processed with an Excel (Microsoft, Redmond, CA, USA) macro in batches of 25 indentations and mean ± standard deviation of elastic modulus (E) collated for each indentation array. Array imaging in qBSE and topographic BSE Each completed nanoindentation array was imaged in a Zeiss DSM962 scanning electron microscope (SEM) (Zeiss UK Ltd, Welwyn Garden City, Herts, UK) at a nominal 150× magnification (field width 599.5 μm). Where nanoindentation arrays were larger than a single 150× field, montages were constructed from several overlapping images. Standard settings (20kV accelerating voltage, 17 mm working distance, filament current saturated, beam current 0.8 – 1.0 × 10⁻⁹ A) were used on all images. For qBSE, BSE detector contrast and brightness settings were set so that calibration images of a monobrominated dimethacrylate standard resulted in an 8-bit grey level (range 0-255) of around 30, and of a monoiodinated dimethacrylate standard resulted in an 8-bit grey level of around 220. Images were collected at 2048×2048 pixel resolution in the Zeiss IMG file format. Specimen IMG files were converted to TIFF and their grey level normalised against the standards (Fig. 1 and 2a and Howell et al., 1998). Topographic BSE (A-B) images were made of every field immediately after capturing each qBSE image by reversing the polarity of two of the backscatter detector quadrants, highlighting surface topography by creating a directional lighting effect on the specimen surface (Fig. 2b). The specimen remained in the same position for both qBSE and A-B imaging, so that qBSE and A-B image pairs were automatically in register. Most of the nanoindentation arrays were bigger than a single field so montages of up to
5 image fields were stitched manually, ensuring that matching tiles in qBSE and A-B images remained exactly in register in the resulting montage images (Fig. 2). A program was written in the ImageJ macro language to correlate A-B images with registered qBSE images (Doube, 2007b). This ensured that the indentation modulus at a given point was accurately correlated with backscatter coefficient from the same point. A-B images showed residual impressions at many but not all indentation sites (Fig. 2b). A small amount of skew was present in the SEM images, due to a slight deviation in the x:y aspect ratio being sent from the SEM’s scan rotation unit to the electron beam scan generator. The indentation array could also be in any rotational and translational position within the images. Umis Array Plotter corrected for translation, scale, rotation and shear transformations between the indentation array layout file and the images of the indentation array, and was designed for rapid, error-free user interaction. Three key points on the array, bottom left (0,0); bottom right (xmax, 0) and top left (0, ymax), were identified by the operator. The macro calculated the pixel position within the image of each indentation by relating the user-identified key points to the layout file and drew a 15-pixel (4.4 μm) radius circular ROI at each position in the qBSE image. Registration errors between A-B and qBSE images from individual indentations could be corrected by moving the ROI to the appropriate position with the mouse; however, this function was rarely required. The operator identified the tissue type at each position or rejected the data from the position by entering a number; 0 = reject, 2 = ACC, 3 = cement line, 4 = bone. A position was rejected if it fell on a crack, an uneven surface, a cell lacuna, marrow space or HAC. Positions that were affected by high electron backscatter from topographic ridges were 245
www.ecmjournal.org
M Doube et al.
Bone and cartilage stiffness and mineralisation
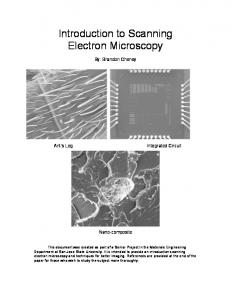
Fig. 3. Correlated qBSE and Nanoindentation Modulus Maps. qBSE image (a) and map of E (b) of an unaffected site showing spatial variation in E relating closely to tissue morphology. Note the lower E in ACC (yellow-green, to bottom of image) than subchondral bone (yellow-red).
rejected to avoid an artefactual increase in the interpretation of mineralisation density. Repeat measurement resulted in approximately 10% of positions being classified differently in successive runs. Therefore, all indentation sites were classified twice and positions with non-matching classifications reclassified as 0 (reject). qBSE data were matched to elastic moduli and entered into SPSS (SPSS v11.0.0, SPSS Inc, Chicago, IL, USA) for statistical analysis.
Exercise effects were assessed with the non-parametric Mann-Whitney U and Kolmogorov-Smirnov Z tests on means calculated for each horse, site and tissue. No effect of exercise was found, so indentations from conditioned and control animals were pooled and comparisons made between tissue types (affected versus unaffected) in both sites (sagittal groove and condyle). Elastic moduli and mineralisation density in affected ACC and bone were compared to unaffected ACC and bone with a 2-tailed Student’s t-test, equal variances not assumed.
246
www.ecmjournal.org
M Doube et al.
Bone and cartilage stiffness and mineralisation
Fig. 4. Indentation Modulus versus Mineralisation Density by Site and Tissue Type. Data surviving two rounds of indentation classification are illustrated. Outlying data with lower than expected E were retrospectively assessed and generally found to meet at least one criterion for rejection; as a result all data bounded by the dashed line were excluded from further analysis (n = 200, < 1% of the total data set).
Results 23,658 indentations were made, from which 2,256 were accepted into the ACC dataset and 6,945 accepted into the bone dataset (Table 2). This represented approximately 1,500 hours of indentation testing. A variable number of indentations per array yielded no elastic modulus data, usually because the indentation tip had proceeded beyond its maximum z-range of 2,000 nm. Such measurements were classified as “reject”. Spatial maps of E showed that morphological features could be distinguished and that E generally related well to mineralisation density (Fig. 3). Subtle, statistically significant (p < 0.001) differences in E and Dm (p < 0.001) were found between affected and unaffected ACC and bone in both sagittal ridge and condyle sites (Table 3). There was no significant difference between horses from the conditioned and control exercise groups for either E or mineralisation density in ACC or bone in either the condyle or sagittal groove (p > 0.05), consistent with earlier work (Ferguson et al., 2008).
A cluster of data tending towards high mineralisation density and low E was seen in affected sagittal groove ACC (Figure 4). Cut-off values of Dm > 100 and E < 10 GPa were introduced in order to explore the data that fell outside the expected trend, i.e. those indentations on matrix that was apparently well mineralised but which yielded lower than expected values for E. Two-hundred indentations fell into this range, 115 of which were from ACC and 85 from bone. Examination of indentation sites using UmisArray’s GoTo feature revealed that most should have been excluded in the first two rounds of typing based on the defined criteria. However, several of the filtered indentations appear in sites in which there was no obvious cause for a low E and were in sites that satisfied the criteria for inclusion. Two-hundred indentations out of over 20,000 represents less than 1% of the total, so was considered mainly classification error and occasionally an indentation on a thin remnant of ACC overlying a cellular lacuna or marrow space. One specimen with normal-looking ACC gave several low E values for ACC, possibly because of surface contamination resulting in asperity contacts well 247
www.ecmjournal.org
M Doube et al.
Bone and cartilage stiffness and mineralisation
Table 2. Duplicate tissue typing at nanoindentation sites First Typing Run Counts Reject ACC Second Typing Cement Line Run Bone Subtotal
Reject
ACC
11319 558 56 1267 13200
126 2256 19 16 2417
Cement Line 78 65 324 101 568
Bone
Subtotal
458 41 29 6945 7473
11981 2920 428 8329 23658
All indentation tests were classified twice by a single operator (MD) based on each indentation site’s appearance in qBSE imaging. Any indentation classified differently in the two runs or classified as ‘reject’ was excluded from further analysis. Final data sets comprised n = 2256 for ACC and n = 6945 for subchondral bone. Bold figures indicate the number of indentation sites given the same classification in both both rounds, plain figures indicate the number of indentations given different classifications in the two rounds. It can be seen that, for example, 19 indentation sites were classified as ACC in the first round but classified as Cement Line in the second round, and therefore excluded. Table 3. E and Dm differ between affected specimen’s ACC and bone. Site
Tis s ue
M e as ure me nt
Affe cte d
Unaffe cte d
p
E (GPa)
12.45 ± 2.37
13.37 ± 1.74
< 0.001
Dm
146.60 ± 30.65
137.17 ± 24.07
< 0.001
E (GPa)
15.03 ± 1.89
14.81 ± 1.72
0.001
Dm
145.98 ± 20.33
136.57 ± 17.45
< 0.001
E (GPa)
13.65 ± 1.97
12.90 ± 1.66
< 0.001
Dm
127.98 ± 27.42
120.73 ± 17.57
< 0.001
E (GPa)
15.20 ± 2.00
14.57 ± 1.76
< 0.001
Dm
146.16 ± 22.17
140.26 ± 18.20
< 0.001
ACC Sagittal Groove Bone
ACC Condyle Bone
Nanoindentation moduli (E) and matrix mineralisation densities (Dm) from affected and unaffected specimens show significant differences (2-tailed Student’s t-test). Note the lower E in affected compared to unaffected ACC in the sagittal groove, despite a higher Dm in the same site. above the true surface of the specimen. All 200 questionable indentations were excluded from analysis. Discussion Nanoindentation calculations assume that the specimen is an homogeneous, isotropic material with a mathematically flat surface, that the indenter tip is of ideal geometry and that there is perfect contact between specimen and indenter tip. Normal bone and ACC are neither homogeneous nor isotropic because they are variably hydrated and variably oriented mixtures of organic, inorganic and cellular components; furthermore, the proportions of the components are variable. Thus, testing of irregularly mineralised tissue in specimens with sometimes imperfectly flat surfaces presents a challenge to nanoindentation testing (Bushby et al., 2004). If the radius of curvature of the surface is more than 10× the indenter radius, the effect on measured modulus is only a few per cent. If it is substantially less than 10×, the measured values will be in error. Where surface topography is visible in the A-B image, it is probably not flat enough for
nanoindentation, so results from such sites should be rejected. The approach here, of using a very large number of indentations and excluding invalid tests based on morphological characteristics at each position, has resulted in a data set free of cracking and imaging artefacts. Arrays were made as large as possible in this study, given the constraints of time and the 596 μm field width of the nominal 150× SEM image. The geometry of indentation arrays varied in width and depth because there was substantial variation in ACC thickness and in the consistency in mineralisation and the flatness of the prepared surface. The number of indentations per array was limited by the time available for each run: since each indentation test required 3.7 minutes to complete, approximately 390 tests could be completed per 24 hours. The shortest run took almost 2 full days to complete (1 day 19 hours), while the longest required 3 days 20 hours. Twenty-four sites in total were tested, comprising 2 sites from each of the 12 osteochondral slices. Regional variations in bone matrix anisotropy may lead to averaging and elimination of bias if a large enough area 248
www.ecmjournal.org
M Doube et al. is included in the indentation array. Collagen within ACC is highly organised and in the sections used in this study was aligned essentially parallel to the plane of section so site-related bias referable to collagen orientation in ACC should not be present in the data. Islands of mineralisation were present in affected ACC making indentation data difficult to obtain because a large number of indentations fell on unmineralised tissue, small cracks within mineralised tissue or unstable tissue regions, which allowed the nanoindenter to exceed its maximum indentation depth of 20,000 nm. Data from such sites were excluded from analysis to improve data fidelity, but with the effect of reducing the contribution of abnormal tissue to the final data set. Our plots of E versus mineralisation density (Fig. 4) show a weak positive correlation between mineralisation density and E for both bone and ACC. However, this relationship was not as strong as sometimes suggested (Seeman, 2007) and appeared to break down in affected sagittal grooves. Numerous indentations with high mineralisation density and low E were found (Fig. 4). These data were mainly concentrated in affected sagittal groove ACC and related to indentations failing to be excluded after two rounds of typing despite not meeting the criteria for inclusion. The occasional indentation would be expected to fall upon a thin layer of mineralised matrix overlying a cell lacuna or marrow space, leading to unusually low values of E as the tip passed through this thin layer into PMMA. Further investigation showed that these aberrantly low E values mainly came from indentations that fell upon cracks, edges and irregular surfaces, which were plentiful in affected ACC. Bone is known to be notch sensitive, that is, the inclusion of a stress concentrator dramatically reduces fracture energy. Furthermore, bone’s notch sensitivity is dependent on its mineralisation density and Young’s modulus, increasing as mineralisation density and Young’s modulus increases (Currey et al., 2004). Mineralisation density of both ACC and bone was raised in affected sagittal grooves, while the E of ACC was reduced and the E of bone was raised. E and Dm were higher in affected specimens’ condylar ACC and bone, despite the tissues having normal morphology, suggesting an underlying variation in mineralisation in affected animals. We suspect that high load applied by the proximal sesamoid bone to the sagittal groove and condyle damages cartilage, and that the abnormal mineralisation we see in affected specimens may be a result of this damage. The sagittal groove appears to be particularly severely damaged, resulting in grossly abnormal morphology. Together, these findings support the presence of materially inferior ACC forming a stress concentrator in the lateral sagittal groove and the underlying bone being more notch-sensitive than in unaffected specimens. It is likely that stress concentration within the sagittal groove due to materially inferior ACC increases the probability of fatigue failure in the distal Mc3. Attempts have been made to predict maps of indentation modulus and hardness based on qBSE imaging despite a failure to demonstrate a strong correlation between mineral content and indentation modulus or
Bone and cartilage stiffness and mineralisation hardness (Gupta et al., 2005). Graphs of indentation modulus and hardness versus Ca content display widely spread nanoindentation moduli (12-24 GPa) and hardness values (0.4-1.0 GPa) for a single Ca content value (22%), similar to our data (Figure 4), while the usual measures of spread (standard deviation or standard error) and correlation (R2 or Pearson’s correlation coefficient) were not reported (Gupta et al., 2005). Our maps of E (Figure 3) show grossly recognisable features when placed alongside qBSE images but are at much lower spatial resolution than Gupta et al. (2005) suggest is possible. Correlated nanoindentation testing and qBSE imaging has helped define the relationship between matrix mineralisation and stiffness. It is clear that a wide range of nanoindentation moduli (as much as ±25% around the mean) may be associated with a single mineralisation density, so that extrapolating directly from mineralisation density to nanoindentation modulus is inappropriate. It is possible to construct spatial maps of nanoindentation moduli if a large array of indents (n > 500) forms the data set, but the resolution of such maps is limited to the indentation array spacing (20 μm) rather than the submicron resolution of SEM. While the morphology of ACC in affected sagittal grooves is clearly abnormal, the measured material properties are only subtly different from unaffected ACC. The irregular matrix morphology of affected ACC means that the most interesting material in the failure site is the most difficult material from which valid nanoindentation moduli can be collected. Furthermore, the relatively low number of results from affected ACC relative to unaffected ACC leads to results from abnormal tissue being swamped by results from normal tissue, so that the usual measures of central tendency and spread are not fully descriptive of the abnormal phenomena. ACC from control and sagittal groove sites in affected specimens is more highly mineralised than the same sites in unaffected specimens, suggesting that ACC in affected specimens has had longer to mineralise than ACC in unaffected specimens. This is broadly consistent with previous work that showed delayed resorption of ACC in affected sagittal grooves.
Conclusions Our results indicate that there are differences in the stiffness of abnormal ACC. This tissue phase has, compared with the normal, a lower volume fraction of tissue which is actually mineralised, but that which is mineralised is mineralised to a higher degree. The mineralised phase tends to be arranged as domains of many microns, with these domains largely discontinuous. The non-mineralised remnant HAC matrix phase is the continuous phase and thus decreases the apparent stiffness. No such argument applies in the case of either the normal ACC or the normal or abnormal SCB. The abnormal bone is evidently more mineralised than normal and we suggest that this probably reflects the decreased level of bone turnover which resulted in the retention of the abnormal ACC. Any given bone packet will therefore persist for longer, and, as such, become more highly mineralised. In keeping with our 249
www.ecmjournal.org
M Doube et al.
Bone and cartilage stiffness and mineralisation
hypothesis that this may be related to the condylar fracture problem, this is just another example of the ideal bone tissue being that which has the ‘normal’ mineral content: too much and it is too stiff and too brittle. Another example can be plucked from the clinical bone field, where the long term use of bisphosphonates to inhibit bone resorption, and hence increase matrix mineralisation density, may be leading to the increased incidence of brittle fractures in previously unusual locations. However, our conclusions must be limited by the fact that we have examined only one moment in the life of these animals, and we cannot predict what would have happened in the affected grooves if the horses had gone on to race training and racing. Would they disappear in the fullness of time? We nevertheless feel that this type of developmental lesion might be of significance in respect of the condylar fracture problem, and should be studied more closely in the future.
Acknowledgements We thank the Horserace Betting Levy Board for its generous financial support through a Veterinary Research Training Scholarship and Project Grant, as well as the Global Equine Research Alliance, New Zealand Racing Board, Marilyn M. Simpson Trust, Utrecht University and Massey University for their contributions to the parent project. Maureen Arora provided valuable technical assistance at many stages of the project. Dr Chris Kawcak and two anonymous reviewers made valuable comments on the manuscript.
References Angker L, Nockolds C, Swain MV, Kilpatrick N (2004) Correlating the mechanical properties to the mineral content of carious dentine – a comparative study using an ultra-micro indentation system (UMIS) and SEM-BSE signals. Arch Oral Biol 49: 369-378. Bassage LH, Richardson DW (1998) Longitudinal fractures of the condyles of the third metacarpal and metatarsal bones in racehorses: 224 cases (1986-1995). J Am Vet Med Assoc 212: 1757-1764. Bembey AK (2008) Micro-Mechanical Properties and Composite Behaviour of Bone. PhD thesis; Queen Mary, University of London. Boyde A, Firth EC (2005) Musculoskeletal responses of 2-year-old Thoroughbred horses to early training. 8. Quantitative back-scattered electron scanning electron microscopy and confocal fluorescence microscopy of the epiphysis of the third metacarpal bone. N Z Vet J 53: 12332. Bushby A (2001) Nano-indentation using spherical indenters. Nondestructive Testing and Evaluation 17: 213.. Bushby A, Ferguson V, Boyde A (2004) Nanoindentation of bone: Comparison of specimens tested in liquid and embedded in polymethylmethacrylate. J Mater Res 19: 249-259.
Currey JD, Brear K, Zioupos P (2004) Notch sensitivity of mammalian mineralized tissues in impact. Proc Biol Sci 271: 517–522. Doube M (2007a) Umis Array Designer. http:// doube.org/macros. html#umisdesign. Doube M (2007b) Umis Array Plotter. http://doube.org/ macros.html#umis. Doube M, Firth EC, Boyde A (2005) Registration of confocal scanning laser microscopy and quantitative backscattered electron images for the temporospatial quantification of mineralization density in 18-month old thoroughbred racehorse articular calcified cartilage. Scanning 27: 219-26. Doube M, Firth E, Boyde A (2007) Variations in articular calcified cartilage by site and exercise in the 18month-old equine distal metacarpal condyle. Osteoarth Cart 15: 1283-1292. Ellis DR (1994) Sir Frederick Hobday Memorial Lecture. Some observations on condylar fractures of the third metacarpus and third metatarsus in young thoroughbreds. Equine Vet J 26: 178-183. Ferguson V, Bushby A, Boyde A (2003) Nanomechanical properties and mineral concentration in articular calcified cartilage and subchondral bone. J Anat 203: 191–202. Ferguson V, Bushby A, Firth E, Howell P, Boyde A (2008) Exercise does not affect stiffness and mineralisation of third metacarpal condylar subarticular calcified tissues in 2 year old thoroughbred racehorses. Eur Cell Mater 16: 40-46. Field J, Swain M (1993) A simple predictive model for spherical indentation. J. Mater. Res. 8: 297-306. Firth EC, Doube M, Boyde A (2009) Mineralised tissue changes in the site of origin of third metacarpal bone condylar fractures in horses that have not entered race training. N Z Vet J 57: 278-283. Gupta HS, Schratter S, Tesch W, Roschger P, Berzlanovich A, Schoeberl T, Klaushofer K, Fratzl P (2005) Two different correlations between nanoindentation modulus and mineral content in the bone-cartilage interface. J Struct Biol 149: 138-148. Howell P, Davy K, Boyde A (1998) Mean atomic number and backscattered electron coefficient calculations for some materials with low mean atomic number. Scanning 20: 35-40. Nugent GE, Law AW, Wong EG, Temple MM, Bae WC, Chen AC, Kawcak CE, Sah RL (2004) Site- and exercise-related variation in structure and function of cartilage from equine distal metacarpal condyle. Osteoarthr Cartil 12: 826-833. Oyen ML, Ferguson VL, Bembey AK, Bushby AJ, Boyde A (2008) Composite bounds on the elastic modulus of bone. J Biomech 41: 2585-2588. Parkin TDH, Clegg PD, French NP, Proudman CJ, Riggs CM, Singer ER, Webbon PM, Morgan KL (2004) Risk of fatal distal limb fractures among Thoroughbreds involved in the five types of racing in the United Kingdom. Vet Rec 154: 493-497. Parkin T, Clegg P, French N, Proudman C, Riggs C, Singer E, Webbon P, Morgan K (2006) Catastrophic
250
www.ecmjournal.org
M Doube et al. fracture of the lateral condyle of the third metacarpus/ metatarsus in UK racehorses - fracture descriptions and pre-existing pathology. Vet J 171: 157-165. Rasband WS (2007) ImageJ v. 1.38. Bethesda, Maryland, USA: U.S. National Institutes of Health. http:/ /rsb.info.nih.gov/ij/. Rho J, Currey J, Zioupos P, Pharr G (2001) The anisotropic Young’s modulus of equine secondary osteones and interstitial bone determined by nanoindentation. J Exp Biol 204: 1775-1781. Rick MC, O’Brien TR, Pool RR, Meagher D (1983) Condylar fractures of the third metacarpal bone and third metatarsal bone in 75 horses: radiographic features, treatments, and outcome. J Am Vet Med Assoc 183: 287296. Riggs CM, Whitehouse GH, Boyde A (1999a) Pathology of the distal condyles of the third metacarpal and third metatarsal bones of the horse. Equine Vet J 31: 140-148.
Bone and cartilage stiffness and mineralisation Riggs CM, Whitehouse GH, Boyde A (1999b) Structural variation of the distal condyles of the third metacarpal and third metatarsal bones in the horse. Equine Vet J 31: 130-139. Rogers CW, Firth EC, McIlwraith CW, Barneveld A, Goodship AE, Kawcak CE, Smith RKW, van Weeren PR (2008) Evaluation of a new strategy to modulate skeletal development in Thoroughbred performance horses by imposing track-based exercise during growth. Equine Vet J 40: 111-118. Seeman E (2007) Bone’s material and structural strength. Curr Opin Orthopaed 18: 494-498. Swindlehurst J (2007) Skeletal risk factors for fatal lateral condylar fractures in racing thoroughbreds. MPhil thesis 20726.SWI Harold Cohen Library; University of Liverpool. Zhu T, Bushby A, Dunstan D (2008) Size effect in the initiation of plasticity for ceramics in nanoindentation. J. Mech Phys Solids 56: 1170-1185.
251
www.ecmjournal.org