J. Dairy Sci. 94:1091–1097 doi:10.3168/jds.2010-3996 © American Dairy Science Association®, 2011.
Hot topic: Microstructure quantification by scanning electron microscopy and image analysis of goat cheese curd S. Rovira,1 M. B. López, E. Ferrandini, and J. Laencina Department of Food Technology, Human Nutrition and Bromatology, Veterinary Faculty, University of Murcia, Espinardo, E-30071, Murcia, Spain
ABSTRACT
Five microstructural parameters of goat cheese curd (number of pores, their area and perimeter, strand thickness, and porosity) were studied by scanning electron microscopy and image analysis. Image analysis was used to characterize and quantify differences in all parameters and to provide a procedure for the measurement of strand thickness. The micrographs provided visual evidence of differences in the protein matrix and were quantified by image analysis at 3 production times: 34 ± 1 min (cutting), 154 ± 6 min (before molding), and 293 ± 35 min (after pressing). The data showed that this procedure is an adequate tool for quantifying differences in the parameters analyzed in industrial samples despite their natural heterogeneity. The procedure was reproducible and repetitive for the first 2 production times because no significant intragroup differences were observed. Significant differences were found when comparing the values of the microstructure parameters analyzed at 34 ± 1 min and those corresponding to 154 ± 6 min and 293 ± 35 min, but no significant differences between samples analyzed at 154 ± 6 min and 293 ± 35 min were found. All microstructure parameters analyzed were related at a significance level of at least 95%. This procedure enables the characterization of the microstructure of industrial goat cheese curd. Key words: curd microstructure, scanning electron microscopy, image analysis, quantification INTRODUCTION
If cheese quality is to be guaranteed, technological and safety aspects cannot be ignored; thus, it is important to control all steps of the manufacturing process. The prediction of possible irregularities during the cheese manufacturing process will minimize costs as well as lessen the risk of offering consumers low-quality products. The structural organization of a cheese is an important factor for its sensory properties and also conReceived November 10, 2010. Accepted December 21, 2010. 1 Corresponding author:
[email protected]
tributes to final product quality (Stanley, 1987). Food structure and the distribution of components influence many of the structural properties perceived by consumers, such as texture, fragility, and elasticity (Langton et al., 1996). Cheese structure has been studied at the molecular, macroscopic, and microscopic levels by several methods. Many of the studies in this area have focused on the observation of protein clusters and how they link together to make up the cheese protein matrix. Transmission electron microscopy has shown that the size of protein aggregates is correlated to cheese stress and fragility, meaning that the stress at fracture, the modulus, and work at fracture of the cheese product can be predicted by observing the size of the protein clusters (Wium et al., 2003). Rennet coagulation, acidification, drainage, ripening, and storage have all been extensively studied. The use of scanning electron microscopy, confocal scanning laser microscopy, and transmission electron microscopy has allowed observation of changes and differences in the structure in each of the 5 parameters mentioned above. The effects of different factors, such as starter concentration, pH, salt content, temperature, rennet type, and concentration, on the microstructure and rheological properties have also been studied (Langton et al., 1996; Thorvaldsson et al., 1999; Pinho et al., 2004). Studies at the microscopic level using electron microscopy techniques have described cheese microstructure and pore diameters during ripening in an orientative way based on the measurement of the horizontal diameter of pores without taking into account its irregularities. However, such techniques do not allow a quantitative determination of microstructure parameters that would enable the characteristics of the cheese structure and its irregularities to be described. Ding and Gunasekaran (1998) developed a 2-dimensional to 3-dimensional image reconstruction procedure for the study of Cheddar cheese microstructure by confocal scanning laser microscopy, quantifying with good precision the variation in particle size and shape between the 2-dimensional and the reconstructed 3-dimensional images. Later, Everett and Auty (2008) pointed to the need to use 3-dimensional images to describe the complex protein
1091
1092
ROVIRA ET AL.
matrix structure in a more real and complete way because 2-dimensional images provide information only on the particle shape and surface in the first plane, without showing how the particles link together or their distribution along the x-, y-, and z-axes. In recent years, image analysis techniques have increased and improved. Most uses of image software in this area have focused on identifying components and on measuring their diameters, shapes and distribution. Binary images from scanning electron microscopy have been used previously for a variety of measurements and quantifications. For example, Ding and Gunasekaran (1998) used image analysis to guarantee the validity of the 3-dimensional reconstruction algorithm by processing several layered digital images. Moreover, Impoco et al. (2006) developed an ad hoc method to analyze scanning electron microscopy cheese imagery, and Dávila and Parés (2007) used image analysis to calculate the fractal dimension of the structure of heat-induced gels of plasma at different pH values. The different mechanical processes involved in the manufacture of cheese are expected to produce differences in the protein matrix aggregates and free cavities that define product microstructure. For this reason is important to ascertain whether different production times lead to differences in microstructure parameters. To understand and thereby control the manufacturing process of goat cheese, it is essential to find an objective and quantitative method that will reveal how the particles are joined together and how the whey is retained in the protein matrix. The aim of this work was to develop and apply a procedure using scanning electron microscopy and image analysis to quantify differences in the microstructure (pore number, area and perimeter, strand thickness, and porosity) at different times of an industrial goat cheese manufacturing process.
sterile 250-mL plastic containers at different times of the goat cheese production process: 34 ± 1 min (cutting), 154 ± 6 min (before molding), and 293 ± 35 min (after pressing) after the start of the coagulation process. The samples were fixed as described below, transported at 4°C, and processed immediately upon reception. Four replicates were processed for each sample, and 2 scanning electron microscopy images were analyzed per replicate. A total of 48 values were considered for the study. Scanning Electron Microscopy
Samples were immediately fixed at the factory in 0.2 M sodium cacodylate containing glutaraldehyde and formaldehyde for 48 h at 4°C, as described by McDowell and Trump (1976). Upon reception in the laboratory, 4 slices (2 to 6 mm thick) were cut vertically for each curd sample. The samples were then rinsed for 24 h at 4°C with 0.2 M cacodylate and saccharose buffer before and after being fixed with OsO4 at 1%. The fixed samples were dehydrated in a graded acetone series of 30, 40, 50, 90, and 100% in steps of 40 min before critical point drying (Balzers Union CPD-020, Vaduz, Liechtenstein). Samples were glued on the sample holder, coated with gold (Bio-Rad Polaron Division 200A, Watford, UK), and observed at 15 kV (Jeol T-300 SEM, Sollentuna, Sweden). The internal surface of the samples was observed at 6,500× magnification. Two representative areas of each piece of the sample were randomly selected and scanned in a horizontal direction at a distance of 9 mm. At least 6 micrographs were captured for each sample (Inca Oxford image capture system, Oxford Instruments Analytical Ltd., High Wycombe, UK). This procedure is based on the method described by Boutrou et al. (2002), with modifications. Image Analysis
MATERIALS AND METHODS Samples
Curd samples were obtained during the industrial manufacture of “Queso de Murcia al Vino,” a cheese made with pasteurized Murciano-Granadina goat milk. The cheeses were produced by an industrial company, following the rules for the production of Protected Denomination of Origin Queso de Murcia al Vino. Cheesemaking was carried out in a 10,000-L vat. When milk reached 33.3°C, rennet (chymosin 85%) was added at a concentration of 0.026 mg/L. The samples were taken on 8 production days to study the microstructure parameters by applying the procedure described below. Samples were taken using Journal of Dairy Science Vol. 94 No. 3, 2011
To compute the microstructure parameters, micrographs were analyzed by means of the image analysis software MIP v4.5 (Consulting Image Digital, Barcelona, Spain) in a blind manner. Porosity was defined as the division of the pore area by the total image area (Impoco et al., 2006). Pore is a structural unit defined as the free cavity between many protein links on the microstructure surface (Buffa et al., 2001). Different parameters related to pore microstructure were also analyzed: pore number, as observed in the image surface; pore area, as the total square micrometers of each pore surface considering all the irregularities; and pore perimeter, defined as the whole of the pore edge or boundary, measured in micrometers and also considering its irregularities. Strands were defined as
HOT TOPIC: MICROSTRUCTURE QUANTIFICATION OF GOAT CHEESE CURD
the union between aggregates in the protein matrix (Boutrou et al., 2002). For such structural strands, thickness was taken as a microstructure parameter and defined as the distance from one side of the strand to the other, perpendicular to the strand direction vector. Micrographs were transformed into 8-bit binary images of 1,024 × 786 pixels and then normalized in the same conditions to guarantee the correct and standard contrast for all the images. Before quantification, all the micrographs were calibrated according to the magnification of the image. For the variables porosity, pore number, pore area, and pore perimeter, the gray levels were segmented to identify which pixels belonged to pores and which to the protein matrix regions. Gray segmentation was made in the same conditions for all the images, and the pixels below a gray value of 47 were selected. Porosity in the binary image was calculated as the percentage of white area (free space in the protein matrix) with respect to the total image area (Impoco et al., 2006). Interactive measurements were used for calculation of the strand thickness. A perpendicular line of the strand direction vector was drawn in an interactive way from one side of the strand to the other, and measured as the total distance in micrometers was measured. Statistical Analysis
Statistical treatment of the data was performed using SPSS version 15.0 (2006, SPSS Ibérica S.L.U., Madrid, Spain). Descriptive analyses, one-way ANOVA, the Kolmogorov-Smirnov normality test, and a Pearson correlation test were used with a significance level of P < 0.05. RESULTS AND DISCUSSION
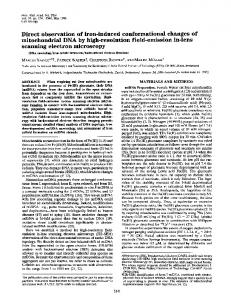
To provide a visual characterization, the representative scanning electron microscopy images, the corresponding gray level, and binary images are illustrated in Figure 1. From the images, differences in the protein matrix (Figure 1A, B, and C) can be observed between the 3 production times selected, each of which has characteristic structural features that reflect the effect of the different cheesemaking steps involved in the manufacture: the cutting, stirring, heating, and washing steps between times A and B, and the pressing step between times B and C. As can be observed, the gray level (Figure 1A′, B′, and C′) makes it possible to detect each of the pores and the irregularities present in the microstructure, whereas the corresponding binary images (Figure 1A″,
1093
B″, and C″) allow quantification of porosity and the number of pores. As was described by Boutrou et al. (2002), the microstructure development of cheese begins with the rearrangement of casein micelles to form the micelle aggregates of the protein matrix. This state corresponds to the images obtained at time A where a more disaggregated structure with a higher number of pores is visualized (Figure 1A, B, and C). As can be observed in Figure 1A′, the aggregates are irregularly shaped, which gives rise to a high number of free cavities throughout the protein matrix, in contrast with the curd microstructure from times B and C (Figure 1B′ and C′), where the aggregates touch to form a continuous network in the same way as was described for rennet curd syneresis by Dejmek and Walstra (2004). Moreover, the binary images (A″, B″, and C″) show differences in the total free area (white area) of the protein matrix (black area), which is related to curd porosity, which is defined as the ratio between black and white areas. The same visual evidence was provided by the confocal scanning laser microscopy images obtained by López et al. (2007) in a study of the development of milk fat microstructure during the manufacture and ripening of Emmental cheese. Table 1 depicts the following statistical values obtained for each of the manufacturing times selected: mean, Fisher’s coefficient of skewness (g1) and coefficient of variation (CV), the values of which indicate the acceptability of the results obtained with this procedure. These statistical determinations were made for 48 images, giving a total of 48 values for porosity and pore number (1 for each image). A total of 288 values for strand thickness (6 strands per image selected according to the description defined above), and 11,126, 8,736, and 8,671 values for pore area and perimeter at times A, B, and C, respectively (according to the value of the area and perimeter of each pore identified and computed for each of the 48 images). A greater number of pores and greater pore perimeter and area were measured at time A compared with times B and C, as shown in Table 1. This confirms the visual evidence described previously for Figure 1. The microstructure observed at the second time is clearly different from that observed at the first time. These results are in contrast with those of Boutrou et al. (2002) who, by simply measuring the porous diameter, concluded that during drainage the open spaces that contain the aqueous phase are always uniformly dispersed and of the same size. In this study, the process of drainage corresponded to the period between A and B. At this second time (154 ± 6 min), clear decreases in porosity, pore number, area and perimeter Journal of Dairy Science Vol. 94 No. 3, 2011
1094
ROVIRA ET AL.
Figure 1. Scanning electron microscopy images of goat curd at 6,500× magnification and corresponding binary images: industrial goat curd at (A) 34 ± 1 min; (B) 154 ± 6 min; and (C) 297 ± 35 min; A′, B′, and C′ are the corresponding gray level detection images; A″, B″, and C″ are the corresponding binary images.
were observed, whereas the strands were thicker. These decreases could be related to the processes of cutting and stirring, as both are thought to increase the collision between curd particles, promoting consolidation of the protein matrix (Birkkjaer et al., 1961; Patel et al., 1972). Dejmek and Walstra (2004) attributed the enhancement of compaction to the pressing process. Pressing takes place between 154 ± 6 min and 293 ± 35 min, so this effect could explain the increase in strand thickness between times B and C. The samples at 34 ± 1 min showed higher standard deviation values and greater dispersion than the samples at times 154 ± 6 min and 293 ± 35 min for all parameters measured except strand thickness, for which the standard deviation was lower, and pore area and perimeter, for which the CV was higher. As previously discussed for Figure 1, a disaggregated structure
Journal of Dairy Science Vol. 94 No. 3, 2011
was evident at time A, which meant that the samples were more heterogeneous, allowing a less reproducible and repetitive analysis. This explains why the standard deviation values for porosity, pore number, area, and perimeter and the CV value for pore area are higher at time A, whereas at time C, with a more continuous protein matrix, they are lower. A mean value is considered representative when the CV is