Combining complex networks and data mining: why and how M. Zanina,b,∗, D. Papoc , P. A. Sousab , E. Menasalvasc , A. Nicchid , E. Kubike , S. Boccalettif a Innaxis
Foundation & Research Institute, José Ortega y Gasset 20, 28006 Madrid, Spain de Engenharia Electrotécnica, Faculdade de Ciêcias e Tecnologia, Universidade Nova de Lisboa, 2829-516 Caparica, Portugal c Center for Biomedical Technology, Universidad Politécnica de Madrid, 28223 Pozuelo de Alarcón, Madrid, Spain d Università degli Studi Guglielmo Marconi, Centro Studi in Scienze della Vita, Via Plinio 44, 00193 Roma, Italy e Columbia University, School of International and Public Affairs, 420 W 118th St #1411, New York, NY 10027, United States f CNR- Institute of Complex Systems, Via Madonna del Piano, 10, 50019 Sesto Fiorentino, Florence, Italy
arXiv:1604.08816v2 [physics.soc-ph] 19 May 2016
b Departamento
Abstract The increasing power of computer technology does not dispense with the need to extract meaningful information out of data sets of ever growing size, and indeed typically exacerbates the complexity of this task. To tackle this general problem, two methods have emerged, at chronologically different times, that are now commonly used in the scientific community: data mining and complex network theory. Not only do complex network analysis and data mining share the same general goal, that of extracting information from complex systems to ultimately create a new compact quantifiable representation, but they also often address similar problems too. In the face of that, a surprisingly low number of researchers turn out to resort to both methodologies. One may then be tempted to conclude that these two fields are either largely redundant or totally antithetic. The starting point of this review is that this state of affairs should be put down to contingent rather than conceptual differences, and that these two fields can in fact advantageously be used in a synergistic manner. An overview of both fields is first provided, some fundamental concepts of which are illustrated. A variety of contexts in which complex network theory and data mining have been used in a synergistic manner are then presented. Contexts in which the appropriate integration of complex network metrics can lead to improved classification rates with respect to classical data mining algorithms and, conversely, contexts in which data mining can be used to tackle important issues in complex network theory applications are illustrated. Finally, ways to achieve a tighter integration between complex networks and data mining, and open lines of research are discussed. Keywords: Complex networks; data mining; Big Data 2010 MSC: 05C82, 62-07, 92C42
Contents 1 Introduction 2 Some basic concepts 2.1 Complex networks . . . . . . . . . . 2.2 Data Mining . . . . . . . . . . . . . 2.3 What is “Big Data”? . . . . . . . . . 2.4 The limits of data mining in physics 2.5 Hands-on: analysing EEG data . . .
2
. . . . .
. . . . .
. . . . .
. . . . .
. . . . .
. . . . .
. . . . .
. . . . .
. . . . .
. . . . .
. . . . .
. . . . .
. . . . .
. . . . .
. . . . .
. . . . .
. . . . .
. . . . .
. . . . .
. . . . .
. . . . .
. . . . .
. . . . .
. . . . .
. . . . .
. . . . .
. . . . .
. . . . .
. . . . .
. . . . .
. . . . .
4 . 4 . 9 . 18 . 19 . 21
∗ Corresponding
author Email address:
[email protected] (M. Zanin)
Preprint submitted to Physics Reports
May 20, 2016
3 Classification 3.1 Statistics vs. classification . . . . . . . . . . . . . . . . . . . . . 3.2 Are network metrics really necessary? . . . . . . . . . . . . . . 3.3 Classifying with complex networks: Neuroscience . . . . . . . . 3.4 Classifying with complex networks: Brain-Computer Interfaces 3.5 Classifying with complex networks: -omics data . . . . . . . . . 3.6 Hands-on: classification . . . . . . . . . . . . . . . . . . . . . .
. . . . . .
. . . . . .
. . . . . .
. . . . . .
. . . . . .
. . . . . .
. . . . . .
. . . . . .
. . . . . .
. . . . . .
. . . . . .
. . . . . .
. . . . . .
. . . . . .
. . . . . .
. . . . . .
. . . . . .
21 22 23 24 26 27 28
4 Improving network significance 4.1 Selecting the synchronisation metric 4.2 Selecting the threshold . . . . . . . . 4.3 Selecting the topological metrics . . 4.4 Hands-on: improving significance . .
. . . .
. . . .
. . . .
. . . .
. . . .
. . . .
. . . .
. . . .
. . . .
. . . .
. . . .
. . . .
. . . .
. . . .
. . . .
. . . .
. . . .
. . . .
. . . .
. . . .
. . . .
. . . .
. . . .
. . . .
. . . .
. . . .
. . . .
. . . .
. . . .
30 30 31 32 32
5 Feature selection 5.1 Selecting the nodes of a network . . . . . . 5.2 Selecting the links of a network . . . . . . . 5.3 Feature selection through complex networks 5.4 Hands-on: feature selection . . . . . . . . .
. . . .
. . . .
. . . .
. . . .
. . . .
. . . .
. . . .
. . . .
. . . .
. . . .
. . . .
. . . .
. . . .
. . . .
. . . .
. . . .
. . . .
. . . .
. . . .
. . . .
. . . .
. . . .
. . . .
. . . .
. . . .
. . . .
. . . .
. . . .
34 34 36 39 39
. . . . . . . . . . . . . . . graphs .
. . . .
. . . .
. . . .
. . . .
. . . .
. . . .
. . . .
. . . .
. . . .
. . . .
. . . .
. . . .
. . . .
. . . .
40 40 41 43 43
. . . .
. . . .
. . . .
6 Additional bridges 6.1 Clustering and community detection . . . . . . . . . . . . . 6.2 Link prediction . . . . . . . . . . . . . . . . . . . . . . . . . 6.3 Evaluating and validating generative models . . . . . . . . . 6.4 Complex networks in Big Data: semantic representations by
7 Conclusions 45 7.1 Problems to overcome . . . . . . . . . . . . . . . . . . . . . . . . . . . . . . . . . . . . . . . . 46 7.2 Open lines of research . . . . . . . . . . . . . . . . . . . . . . . . . . . . . . . . . . . . . . . . 46 Appendix A
List of acronyms
58
1. Introduction As much as they may sometimes seem chaotic or random, large-scale natural and man-made phenomena show characteristic complex structure. Parts or components are related to each other in a non-random way, with identifiable regularities and recurring patterns, ultimately making for internally coherent entities. The ability to extract regularities of all sorts from the environment is already functional within the first few months of humans’ life. In fact, the ability to recognise and use patterns is likely the gateway to some important function acquisition such as that of language, and appears to be key to the adaptive capabilities of living organisms [1, 2]. Scientific knowledge can be seen as an endeavour to extract and quantify reproducible regularities of phenomena. Up until relatively recently, save for a few notable Gedankenexperiment examples in physics, science generally progressed through similar inductive rule extraction cycles of carefully sampled phenomena, then reordered in a compact, e.g. mathematical, formulation. However powerful and general, the classical theory-based approach encounters limits more often than scientists were initially ready to admit. Some systems simply turn out to be too complex to be modelled in a synthetic form. Furthermore, the relevant mechanisms may be hidden. In some other cases, the seemingly intuitive notion of system may be of little help in identifying the underlying structure of a constellation of separate entities. While methods to extract patterns from data have a long history – Bayes’ theorem (1700s) and regression analysis (1800s) arguably belong to this tradition – over the past few decades, the increasing power of computer technology has dramatically increased data collection, storage, and manipulation ability. While 2
uncovering more information, ever more precise instruments with constantly improved sampling capabilities do not yield compact representations of the entities that are being studied, and therefore do not dispense with the need to extract and model regularities, patterns or rules from the data that these instruments generate. Often, quite the contrary, in fact, as the multiplication of samples makes up for overwhelming and intricate jumbles of always increasing size. As data sets have grown in size and complexity, direct data analysis has started been augmented with indirect, automated data processing methods including neural networks, cluster analysis, genetic algorithms (1950s), decision trees and decision rules (1960s) and, more recently support vector machines (1990s) [3, 4]. Data mining was born: an interdisciplinary subfield of computer science applying these methods with the intention of uncovering hidden patterns in large data sets, and transforming them into understandable structures for further use. Data mining bridges the gap from applied statistics and artificial intelligence to database management, to execute learning and discovery algorithms more efficiently, allowing such methods to be applied to ever larger data sets. When data sets are so complex that managing their size is a challenge in itself, data mining is also called Big Data [5]. Over the last two decades, complex network theory has emerged as a new way to understand the structure of relationships characterising complex systems. A statistical physics understanding of graph theory (a much older branch of pure mathematics), complex networks have been used by scientists from very different fields to describe systems ranging from power grids to social interactions and the brain [6, 7, 8, 9, 10]. Complex network analysis and data mining have similar goals: given some data, usually representing a complex system, the aim is to extract (or synthesise) some information from them, and create a new representation (either a complex network, or a data mining model) that can be used in successive steps of the analysis. Likewise, many of the problems encountered in both fields are similar, although bearing different names: for instance, selecting the most relevant nodes in a network is mirrored by the feature selection problem; evaluating differences between groups of networks in classification tasks; and so forth. At the same time, complex network theory and data mining also present some important differences. Networks aim at describing the relations between the elements of a single (complex) system, by means of patterns that have a statistical nature and that are free from any topological space. On the other hand, data mining characterises the relations between the observables associated to different instances (not of a single system), by means of patterns pinned to a set of well-identified elements/features that are used to explain reality. Given the similarity in the general purpose and sometimes even in procedures, it may be natural to think that both approaches can be used interchangeably. Nevertheless, the differences between network theory and data mining may, in some situations, provide an added value when both of them are used in combination. The question is then: why and when would one want to resort to both data mining and complex networks? In what kind of problems do the differences between both of them result in a synergic effect? Note that the primary goal of this review is not to make network-minded individuals fluent in the language of data mining or vice versa, but to convince either side of this field divide that there is reason enough to resort to both. Some examples of such synergy are easy to identify. Probably the clearest ones can be drawn from biology and biomedicine, two fields in which it is simple to identify different conditions (e.g. control subjects and patients suffering from some disease) that have to be diagnosed and prognosed. Data mining is well suited for constructing models allowing the evaluation of the health condition of a person, for instance by detecting a pattern between two or more genes that is symptomatic of a disease; yet, it requires the target elements and the corresponding relations to be regular across instances - in other words, the same pattern, but involving other genes, would not be correctly identified. Complex network theory may solve the problem, by identifying target structures even if they vary across subjects (provided they are topological invariant). Similar situations can be found in neuroscience, where complex networks can be used to describe the structure of relationships between different regions of the brain, and data mining can be used to create diagnostic models. This is not limited to biology: many interdisciplinary fields face similar problems, as for instance econophysics, where networks may represent the economical structure of countries, which can then be modelled through data mining techniques. This review aims at creating bridges between two communities that have so far had little contact and cross-fertilisation, mainly due to contingent and background differences: Section 2 thus starts by providing an overview of both fields, laying down some fundamental concepts, and providing references to allow the 3
Acetyl-CoA
Cholic acid
Mevalonate Squalene
LDL
Cholesterol ester Cholesterol
IDL
HDL
VLDL
Metric
Value
Number of nodes
10
Average degree
2.4
Clustering coefficient
0.243
Characteristic path length
1.829
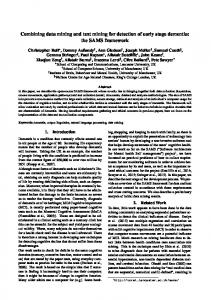
Figure 1: Creating a complex network representation. (Left) Simplified cholesterol pathway. (Center) Network representation of the same pathway. (Right) Some topological metrics of the network.
interested reader to dig deeper into them. Next, in Section 3 we focus on one of the most important tasks in data mining, i.e. classification, to understand how complex networks can be used to provide a richer representation of some complex systems. Section 4 changes the point of view, by dealing with how data mining can be used to tackle one of the most important problems in the application of complex network theory, that is, the reconstruction of meaningful functional networks. This latter section is complemented by Section 5, in which we discuss the potential applications of feature selection in network analysis. Finally, Section 6 discusses some additional problems and scenarios in which complex network theory and data mining have been (or could be) jointly used. The review is closed by Section 7, in which conclusions are drawn about two important topics: what are the problems to overcome for a tighter integration of complex networks and data mining, and open lines of research. Additionally, hands-on sections will illustrate with worked examples the main points discussed in each chapter. 2. Some basic concepts This Section is intended to be a primer of several concepts that will be used throughout this review: what complex networks are, how to quantify their structure, up to a first definition of the most important data mining algorithms and concepts. Over the past twenty years, both complex network theory and data mining have undergone changes that are far too dramatic and extensive to be discussed in detail here. What we propose is a first introduction to both topics: some general ideas and concepts of data mining, for the complex network practitioner that has never worked with them; and conversely some basic notions of complex networks for data mining specialists. Throughout this review, we refer the interested reader to excellent reviews and books in both fields. Readers familiar with these concepts can skip the present section, and go straight to Section 3. 2.1. Complex networks Network theory is a statistical-mechanics understanding of a past branch of pure mathematics: graph theory. In a network representation of a system, all unnecessary details are removed, to extract only its constituent parts and the interactions between them. Graph theory allows characterising a system once its boundaries, constituent parts and relationships are defined, but is indifferent as to what should be treated as a system and how to isolate its constituent parts; a challenge that will be addressed in Section 4. The structure created by such interactions is called the network topology. Most social, biological, and technological networks (including the brain) display substantial non-trivial topological properties, i.e. patterns of connections between their elements are neither purely regular nor purely random [11]. These properties can be thought of as features describing the network’s structure. The process of evolving from a complex system to a complex network is depicted in Fig. 1. The left panel represents a simplified version of the statin pathway focused around cholesterol. This shows the set of interactions occurring within a human cell that is responsible for many cardiovascular diseases [12]. When the nature of the elements (molecules, metabolites, etc.) and of the interactions is disregarded, the result is a network, as shown in the central panel. Finally, the topological structure of the network can be represented as a set of topological metrics, as reported in Fig. 1 Right. 4
Table 1: The scales of complex networks
Micro-scale
Meso-scale
Macro-scale
This scale focuses on the properties of a single link or single node. When the whole network is analysed these metrics are usually averaged over each node comprised within the network, in order to create a global picture. Example: Number of connections a person has in a social network. This is the intermediate level between studying elements of a system separately (micro-) and considering the system as a whole (macro-scale). We may define the meso-scale as any regular structure that affects the connectivity of groups of nodes in the network [14]. Example: Communities of friends present within a social network. The macro-scale depicts the system as a whole. It accounts for the overall structure of the network, addressing the movement of information throughout. Example: The average path length to reach a person in a social network.
Roughly speaking, complex network measures can be divided into three classes, according to the relevant scale: micro- (single nodes or links), meso- (groups of few nodes) and macro-scale (the network as a whole). See Table 1 for further examination. In the last decade, tens of different metrics have been proposed for each of these classes and attempts to describe different aspects of the structure. However, some overlap and present different characteristics, like different computational costs and sensitivity to noise. A few of these metrics will be used throughout this text and are reported in Table 2. Although a complete review of existing complex network metrics is outside the scope of this review, the interested reader can refer to some of the excellent analyses provided in the available literature, such as: Refs. [13, 8, 11, 10]. For the sake of completeness, we will describe three important topics in complex network analysis, which repeatedly appear throughout in this review: i) the existence of different classes of networks, ii) the difference between structural and functional networks, and iii) some recent trends in network analysis. Classes of networks In the last decade the analysis of a large number of real-world networks has revealed that some structures, or networks topologies, are ubiquitous across many natural and man-made systems [9]. Such classes are of relevance, as they constitute the basis of the classification of real systems. From a historical point of view, the start of classifications was the random graphs, also known as ErdösRényi graphs after the mathematician who discovered them, Paul Erdös. Given a set of n disconnected vertices, links between all pairs of nodes are created with a probability p. Many theoretical results were obtained in random graphs, as for instance, the expected size of the largest component (groups of nodes connected between them), or the critical value of p for which the graph was connected [20]. A comprehensive review of all results obtained in random graph analysis can be found in Ref. [21]. If random graphs are characterised by a complete absence of structure, the other extreme is represented by regular graphs, i.e. networks where all nodes have the same number of connections. While these two extrema have limited interest for modelling real-world systems, which seldom present such simple structures, the importance reside in their use as null models. For instance, the frequency of appearance of a motif is usually compared with the frequency expected in equivalent (same number of nodes and links) random graphs, in order to assess its statistical significance [17]. In 1998, Watts and Strogatz realised that real networks were neither regular nor completely random graphs; that real systems lie somewhere between these two extremes. Specifically, random graphs are characterised by both a low mean geodesic distance and clustering coefficient. On the other hand, regular graphs show both high mean geodesic distance and clustering. By analysing social and biological networks, they discovered that most of them are characterised by a low mean geodesic distance, but also by a high clustering coefficient: in this case, networks are said to have the small-world property [22]. A third class of networks was born: the small-world ones. Simple models can be designed to synthetically recover such effect 5
Table 2: Some basic complex network metrics
Metric
Scale
Degree
Micro-scale
Link density
Micro-scale
Clustering coefficient
Meso-scale
Modularity
Meso-scale
Motifs
Meso-scale
Geodesic tance
Efficiency
dis-
Macro-scale
Macro-scale
Description The number of connections a node has, i.e. the number of neighbours. The degree P k of node i is calculated from the adjacency matrix as ki = j aij . The number of links l in the network, divided by the maximum number of links that could be present. For a network Pcomposed 1 l = n(n−1) of n nodes, the link density is thus n(n−1) i,j aij . The clustering coefficient Ci of a node i is the fraction of pairs of its neighbours that are directly connected, and is thus a count of the number of triangles in the network. Such metric can be averaged Pover all nodes, yielding the network clustering coefficient C = n1 i Ci . Assesses the presence of a community structure in the network, i.e. of groups of nodes densely connected between them [15, 16]. Subgraphs (usually composed of three or four nodes) that appear more frequently than what could be statistically expected [17]. The geodesic distance di,j between nodes i and j is the minimum number of steps needed to move between them, i.e. the length of the shortest path connecting them. The value can be averaged over all possible pairs of nodes, yielding the average shortest path length of the network. Mean value of the inverse of P the geodesic distance between pairs 1 1 of nodes, i.e. E = n(n−1) i,j6=i di,j . It assesses the ease of information flow in the network, and has the advantage of being defined for disconnected networks [18, 19].
[22], and the property can be numerically estimated through the small-worldness metric [23, 24], which has been particularly popular in neuroscience, though some important caveats to its applications have recently been pointed out [25]. Until 1998, three classes were thus known: random, regular, and small-world ones. A fourth class of network topologies emerged when it was first noticed that real-world networks are characterised by heterogeneous nodes, some of them (the hubs) of high connectivity. A clear example can be found in transportation networks, where few airports create the backbone of the network [26]. Mathematically, these networks are called scale-free, as their degree distribution follows a power law, and thus have no characteristic scale [27]. Many models for obtaining scale-free topologies have been proposed [28, 29, 30, 31, 32, 33, 34, 35, 36, 37], the most praised is the Barabási-Albert one [38]. It refers to a preferential attachment process, in which new nodes are added to the network, each connected to existing nodes with a probability proportional to their degree. Structural vs. functional networks When analysing networks, it is useful to make a distinction between two types: structural (also called physical) and functional networks. Physical networks are described by explicit interactions; reconstructing them is tantamount to mapping the connections into the corresponding links, as seen in the real system. For instance, in a transportation system nodes can be airports, bus stops, train stations, etc, while scheduling tables provide information on the corresponding links. However, some real-world systems lack explicit information about links. One may nevertheless suppose that each element’s dynamics is a function of its neighbours. The first step 6
iii)! ii)!
iv)!
iii)! τ"="0.25"
i)!
Threshold τ"="0.12"
ii)! τ"="0.25"
i)! Synchronisation metric
iv)!
τ"="…"
cla
τ"="0.12"
Best" classifica3on"
τ"="…"
τ"="…"
Topological metrics
…"
…"
τ"="…"
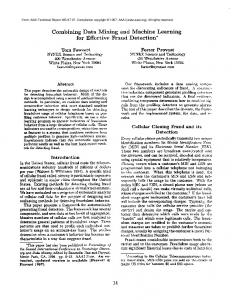
Figure 2: Interactions between different aspects of functional network reconstruction: a)" c)" b)"selection of the synchronisation metric, of the threshold for its binarisation, and of the topological metrics. See the main text for details.
…"
…"
then requires quantifying these functions (hence the name functional networks). The resulting network’s a)" c)" b)" topological features can finally be extracted as in the previous case. The study of brain structure and dynamics provides a clear example of this difference. On the one hand, different brain regions are connected by fibres and are organised in a physical structure, called the connectome [39, 40], which represents the substrate on which brain dynamics takes place. However, on the d)" e)" f)" other hand, one may be interested in understanding how the brain executes a specific task, and thus on how the connectome is used to transfer information between different regions. This can be achieved by reconstructing thed)"functional network associated to the task, by connecting pairs of nodes (brain regions) e)" f)" when some common dynamics (or synchronisation) is observed [41, 42]. In the most general case, reconstructing functional networks involves choosing (or tuning) three different aspects of the analysis, namely: 1. The connectivity metric. This is the measure assessing the presence of some relationship between the dynamics of two elements of the system. 2. A threshold. While not essential, it is customary to eliminate those links that have a low statistical significance, and to consider the binarised version of the network, i.e. to discard weights. 3. The topological metrics. These metrics describe the structure of the resulting networks and eventually compare different groups of subjects. In the absence of a set of rules, these three aspects bring in a degree of subjectiveness. For instance, researchers can be tempted to arbitrarily choose a threshold only based on their experience. More importantly, these three steps are strongly interconnected, as depicted in Fig. 2. Each connectivity metric is designed to detect different aspects of dynamics. In the case of functional brain networks, this may include local vs. global dynamics, linear and non-linear dependencies, correlations vs. causalities, and so forth. Each one of these metrics, in turns, changes the resulting topology, thus requiring different thresholds and topological metrics. Changing the threshold has important implications on the topological metrics that can be assessed. For instance, in dense networks the average geodesic distance always tends to one, while in sparse networks it is difficult to observe complex motifs. Closing the circle, if one wants to observe a given topological metric, it is necessary to choose a suitable synchronisation metric and threshold. For example, motifs containing bi-directional connections are mostly excluded by using a causality metric. These problems will be tackled in Section 4, which is devoted to the use of data mining methods for improving network representations. While the analysis of physical networks is usually straightforward, it may still require some pre-processing. This pre-processing can include filtering out spurious links (links that are the result of noisy measurements, and that therefore distort the real structure of the network) or reconstructing links in unexplored regions of the system space. These two topics are respectively discussed in Sections 5 and 6.2. 7
Recent trends in network theory Until now we have concisely presented the main elements of complex network theory that are used in the analysis of real systems. Due to the inability of this standard framework to describe scenarios observed in complex real-world scenarios, network theory has been extended within the last years to include concepts such as temporal and multi-layer networks. Temporal networks are composed of edges that are not continuously active. As an example, in networks of communication via e-mail, text messages, or phone calls, edges represent sequences of instantaneous or practically instantaneous contacts. Sometimes, edges are active for non-negligible periods of time. This is for instance the case of inpatients proximity patterns within a hospital, where individuals are pairwise connected while they are at the same ward. It is clear that the temporal structure of edge activations can affect the dynamics of the elements interacting through the network, from disease contagion in the patient network to information diffusion over an e-mail network. See [43, 44] for reviews on the topic. The idea of multi-layer networks emerged by observing that connections between the elements constituting real-world networks are seldom of a single type. Let us consider the following three examples, starting with social networks. Social networks as people (or groups of people) have some pattern of contacts or interactions between them [45]. Social interactions seldom develop on a single channel and more than one relationship can bind pairs of people, as was initially proposed by Erving Goffman in 1974, along with his theory of frame analysis [46]. Second, consider a transportation network, as for instance the Air Transportation Network (ATN) [26]. Flights connecting pairs of cities are not homogeneous, as airlines have to be considered. Furthermore, passengers cannot easily connect two flights operated by different airlines, at least connect airlines belonging to different alliances [47, 48]. Finally, biology provides a third example as scientists try to understand the role of specific components in a biological system. The full mapping of the Caenorhabditis elegans (or C. elegans) neural network is now known, comprising 281 neurons along with more than two thousand connections [49]. Since neurons can be connected by chemical and electrical (ionic) links, this results in two different dynamics, and ultimately does not form a single network. These three examples explain the efforts for generalising the traditional network theory by developing a novel framework for the study of multi-layer networks, i.e. graphs where several different layers of connections are taken into account [50, 51, 10]. Multi-layer networks explicitly incorporate multiple channels of connectivity and therefore constitute the natural environment to describe systems interconnected through different categories of connections. A layer represents each channel (relationship, activity, category) and the same node may have different kinds of interactions (different set of neighbours in each layer). For example, in social networks, one can consider several types of relationships: friendship, vicinity, kinship, membership of the same cultural society, partnership or coworker-ship, etc. Software for network analysis NetworkX [52]. Python library used for the creation, manipulation, and study of the structure, dynamics, and functions of complex networks. This allows the creation of networks with different algorithms, evaluation of a large set of standard metrics, and finally display the results in an easily understood way. Freeware. Available at https://networkx.github.io. Cytoscape [53]. Software specialised on the representation of networks, with some additional tools for the integration of biological data. It also provides some basic network analysis capabilities. Freeware. Available at http://www.cytoscape.org Gephi [54]. Interactive visualisation and exploration platform. Freeware. Available at https://gephi. github.io Pajek [55]. Software for representing complex networks, with some basic analysis capabilities. Freeware. Available at http://mrvar.fdv.uni-lj.si/pajek/ VisANT [56]. Software for the visual study of metabolic networks and pathways. Freeware. Available at http://visant.bu.edu 8
IBM r i2 Analyst’s Notebook. Software for the integration of social data and network analysis. Commercial. Information at http://www-03.ibm.com/software/products/en/analysts-notebook SAS r Social Network Analysis. Software for the analysis of social networks. Commercial. Information at http://support.sas.com/software/products/sna/index.html 2.2. Data Mining The proliferation, ubiquity and increasing power of computer technology have dramatically enhanced our ability for data collection, storage, and manipulation. This has created a new need for automatic data analysis, classification, and understanding. Data mining, with its vision of automatically extracting knowledge from data bases, has attracted growing attention since late 80’s. In the current information age, data generated and stored by modern organisations increase in an extraordinary way, and data mining tasks [57] become a necessary and fundamental technology for sustainability and improvement. The term has also evolved in [57]. A distinction was made between KDD (Knowledge Discovery in Databases), which refers to the overall process of discovering useful knowledge from data; and data mining, which refers to a particular step in such process, in which specific algorithms are applied to extract patterns from data. Nowadays, this distinction is almost lost, and “data mining” is used to refer to the overall process performed by combining methodologies and techniques from different fields, such as statistics, databases, machine learning and visualisation. The size of the data increases and becomes challenging and data mining evolves into Big Data; a topic that will be further discussed in Section 2.3. Modern data mining faces two major challenges. The first is being able to share the obtained knowledge. In this sense, the Predictive Model Markup Language (PMML) [58] has become one of the most widely adopted data mining standards used today. The second challenge is defining a methodology to guide the process of discovery. In 1997, an industry group called the Cross-Industry Standard Process for Data Mining (CRISP-DM) [59] proposed a methodology for organising the KDD process in six standard steps: Business (or Problem) Understanding: initial phase that focuses on understanding the project objectives and requirements from a business perspective. This knowledge is then converted into a data mining problem, and a preliminary plan is designed to achieve the project objectives. Data Understanding: starts with an initial data collection and proceeds with several activities, all aimed at: familiarise with the data; identify data quality problems; discover initial insights about the data; and detect interesting data subsets to form hypotheses about hidden information. Data preparation: arguably the most important of the whole process, as the success of the final analysis strongly depends on it, and may consume up to the 90% of time and resources. This covers all of the activities required to construct the final dataset, such as identifying data that will be fed into the modelling tools from the initial raw data along with data cleaning and preprocessing. Data preparation tasks are likely to be performed multiple times, and not in any prescribed order. They include selection and transformation of tables, records, attributes, and data cleaning. Ref. [60] presents several data preparation techniques and algorithms, which can be used for preprocessing data in web mining applications. Additionally, Ref. [61] presents a more general review of techniques, along with a deep discussion on the motivations for data preparation. It is worth noting that the importance of this step is reduced when one is in the Big Data field; a concept that will be further discussed in Section 2.3. Due to the complexity and volume of data, cleaning and preparation may not be feasible and it could lead to an unwanted loss of useful information. In these cases, it is preferable to work with “data in the wild”, and sacrifice some accuracy. Modelling: phase in which data mining algorithms are applied and parameters are calibrated to optimal values. Some of these techniques will be reviewed in detail in the following subsections. Typically, different techniques can be chosen to solve the same modelling problem, each having specific requirements on the format of input data and hypothesis on the patterns to be detected. In these situations, models are optimised and compared; the models reaching a higher performance are passed to the next phase for a final evaluation. 9
Evaluation. Once the models have been evaluated from a data mining perspective, it is necessary to review the output patterns obtained considering the business requirements identified in the first phase. Only when all relevant questions have been addressed, can one then move to the deployment of the extracted knowledge. Deployment. When all of the information about the business problems has been gathered, the information and knowledge then has to be organised and presented. Data Mining tasks and models Data mining tasks, or the tasks performed in the modelling phase of the KDD process, can be classified into predictive and descriptive tasks. Predictive analytics includes all data analysis processes that perform inference in order to extract patterns to be used to make predictions. On the other hand, descriptive tasks group all the processes characterising the general properties of the data. For any of these tasks, a tremendous amount of techniques and algorithms have been described in the literature, the most important of which are reviewed in the next subsections. Delving deeper into such concepts, both families can be defined as follows: Descriptive Modelling, also called Exploratory Analysis, has the main purpose of describing, through patterns, the information encoded in the data set being studied. These techniques have an exploratory nature, in the sense that allows a better characterisation of the existing data, without providing any forecast. They are oriented towards data interpretation, which focuses on understanding the underlying data relations, such as finding correlations, trends, groups, clusters and anomalies. Descriptive models mostly rely on Clustering and Association Rules techniques and algorithms. Predictive Modelling: its main goal is to find a model, constructed over the information already labelled in the data set, which can be used in the future to predict information. This model aims at predicting the value of a particular attribute, such as the target or dependent variable, based on the values of other attributes (variables), assuming a set of labelled data (training set) is given. The underlying assumption of the inductive approach is that the data used for training are representative of the whole universe, meaning of all the possible unknown data that may be encountered, and therefore the trained model is able to accurately predict the values of future unseen instances. It is important to mention that in the case of predictive and descriptive tasks, the methods used to extract knowledge are based on inductive learning, where a model is constructed by generalising a set of training records. In both cases, though, knowledge description comes in different forms. For classification problems, this may be a set of characteristic or discriminant rules, or a decision tree or a neural network with fixed sets of weights. In case of association analyses, it may be a set of associations, or association rules. For cluster analysis, it consists of a set of clusters, each of which has its own description and cluster name (class name). In the following we will review the main data mining tasks, with a special emphasis will be placed on classification, due to its relevance in problems involving complex networks. Clustering. Also called unsupervised learning, it involves the division of data into groups (clusters) that contain similar records (according to some similarity measures), and those subsequent, separate dissimilar records organised into different clusters. In Ref. [62] clustering is defined as: partition a given data set in groups, called clusters, so that the points belonging to a cluster are more similar to each other than the rest of the items belonging to other clusters. In Ref. [63] a taxonomy of clustering techniques is presented, with an overview of its fundamental concepts and methods. Moreover, it describes several successful applications of clustering, such as image segmentation or object and character recognition. Classifying clustering algorithms is not an easy task, as the categories very often overlap. According to the survey found in Ref. [64], one can establish the following classification: • Hierarchical-Based. The hierarchical clustering combines instances of the dataset, to form successive clusters, resulting in a tree form called dendrogram. In the lower level of the tree, only one 10
instance is associated to each cluster, and upper levels of the tree are aggregations of the nodes below. Agglomerative and divisive clustering can be distinguished, according to the criteria to group nodes. • Partitions-Based. The clustering methods based on partitions divide the data set into different disjoint subsets. The operation involves assigning points to different clusters, whose number is initially fixed, and iteratively improving the division, until a previously defined heuristic finds the optimal solution. The praised K-means [65] algorithm belongs to this class. • Density-Based. In the previously described algorithms, such as the K-means algorithm, the similarity of the points (instances) for cluster assignment is assessed through a specific distance measure. In density-based algorithms, however, clusters are based on density measures. The DBSCAN [66] algorithm belongs to this kind of clustering techniques. Association Rule Mining. This explores the relations between attributes that exist in data, thus detecting attribute-value conditions that occur frequently together. It has been popularised by Agrawal [67], who proposed Apriori, the best-known algorithm to mine association rules. Association rules can be used as the basis for decisions about marketing activities, as their best known application conducts analysis of market baskets. In Ref. [68, 69] the authors present two new algorithms for solving basket market analysis. The empirical evaluation presented in the aforementioned paper shows that these algorithms outperform the existing methods for both small and large problems. Apriori Hybrid is also shown as a combination of the best features of the two proposed algorithms. A more recent survey of association rule mining can be found in Ref. [70]. Prediction. Also called supervised learning methods, its goal is to learn from a set of training data, with the aim of predicting the class of new unlabelled records. More specifically, let X be the feature space and its possible values, and Y be the space of possible labels of a target variable. The underlying assumption is that within exists a function f (X ) → Y that assigns a record to a class depending on the values of its describing features. The function f thus aims to predict values of a class attribute from other attributes based on training data. The classification algorithm will try to minimise the distance between the real and the predicted value (i.e., minimise the expected error). Consequently, the classifiers are usually evaluated by assessing their predictive accuracy on a test set. The most frequent measures to validate the models are: (i) accuracy, defined as the proportion of correct predictions obtained; (ii) precision, the proportion of correct positive forecast; (iii) recall, the fraction of relevant instances that have been retrieved; and the (iv) F-measure, or F 1 measure, the harmonic mean of precision and recall. Depending on the type of variables to predict, we can distinguish between: • Numeric Value Prediction or regression: which attempts to predict a numeric attribute value by modelling a continuous-valued function. • Classification: which aims to predict a discrete class label. Algorithms and models Many classification and prediction algorithms have been proposed in the last few decades, each bringing different advantages and disadvantages, along with their own requirements on the format of the data. Below are the most successful and well-known techniques. Naïve Bayes classifiers. This refers to a family of simple probabilistic classifiers based on applying Bayes’ theorem with the assumption of independence between the features. Consider an instance, described by a vector of features X, which may belong to several classes CK (being K the number of classes). The probability of that instance to belong to a class i is then given by: p(Ci |X) = 11
p(Ci )p(X|Ci ) . p(X)
(1)
f1
f1
f1
f2
f2
kNN
Regression < 0.5
f2
SVM
> 0.5
f1
f1
C1
< 0.2
f2
output
> 0.2
C1
f2
C2
Decision Tree
ANN
Figure 3: Example of five selected data mining classification algorithms. Green circles and blue squares represent two classes, e.g. control subjects and patients. The three algorithms in the top row respectively represent simple linear regression, kNN (in which new instances are classified according to the class of their nearest neighbours), and SVM (which divides the feature space is two non-overlapping regions). In the bottom row, Decision Tree, in which numerical conditions are sequentially tested of the available features; and Artificial Neural Network, which optimises a mathematical function on the input features. Additional graphical examples can be found in Figs. 4 and 9.
In other words, the posterior probability of the instance to belong to Ci is proportional to the prior probability, to the likelihood, and inversely proportional to the evidence. Naïve Bayes classifiers are highly scalable, requiring adjustments of parameters that grows linearly with the number of variables in the problem, and thus leading to a linear computation cost. More information can be found in Ref. [71]. Regression. Regression analysis is the most basic and commonly used predictive tool, especially in practical applications [72], and is based on a statistical process for estimating the relationships among variables. As it can be seen in Fig. 3 Top Left, the goal of regression analysis is fitting a linear function through a scatter plot. In the simplest case of univariate regression analysis (i.e. with one dependent and one independent variable), this goal can be defined as: hθ (x) = θ0 + θ1 (x).
(2)
The training process thus entails finding a set of θi that fit the target population; in other words, this implies minimising the following cost function through, for instance, a gradient descent algorithm or a least squares approach: m
J(θ0 , θ1 ) =
1 X i (h − y i )2 . 2m i=1 θx
(3)
Real-world problems are usually not restricted to one independent variable, thus requiring the use of a multivariate regression. This, nevertheless, leads to the problem of overfitting: when too many features are present, the learned hypothesis may fit the training set very well, but fail to generalise to new examples. If reducing the number of features is not an option, the solution is to resort to regularisation: all features are kept, but the parameter values are reduced. In regularised linear regression, we choose θ 12
to minimise: J(θ) =
m n X 1 X i (hθx − y i ))2 + Λ θj2 . 2m i=1 i=1
(4)
Logistic regression. There are many situations in which we need to predict the value of a dependent variable as a function of other independent variables, as in regression, but in which the former is discrete, and specifically binary (e.g. the patient improves after a treatment, the credit is paid, the email is spam, etc.). The value associated to each observation i is thus either yi = 0 or yi = 1. Mathematically, yi is a realisation of a random variable Yi that can take values one and zero with probabilities p and 1 − p, respectively. Assume that P r(Y i= 1|X = x) = p(x; θ), for some function p parameterised by θ, and assume that observations are independent of each other. The conditional likelihood function is n Y
P rY = yi | = xi =
i
n Y
p(xi ; θ)yi (1 − p(xi ; θ)1−yi ).
(5)
i
In this case it is important to see that the mean and variance depend on the underlying probability. As a consequence, any factor affecting the probability will also alter both the mean and the variance of the observations. This suggests that a linear model that allows the predictors to affect the mean but assumes that the variance is constant will not be adequate for the analysis of binary data. In this kind of models, the constraint, π = p(xi ; θ), tells us that π must be the same whenever xi is the same, and if π is a continuous function, then similar values of xi must lead to similar values of π . Assuming p is known (up to parameters), the likelihood is a function of θ, then we can estimate θ by maximising its likelihood. Summing up, we have a binary output variable Y , and want to model the conditional probability P r(Y = 1|X = x) as a function of x; any unknown parameters in the function are to be estimated by maximum likelihood. How can we use linear regression to solve this problem? Logistic regression uses p . This can be transformed into a linear function a logistic (or logit) transformation of log p, by log 1−p of x without fear of nonsensical result. Formally, the model logistic regression model is: log
p(x) = β0 + xβ 1 − p(x)
(6)
The final classification model is then given by the solution of the equation β0 +xβ = 0, which represents the line that separates the two classes. The way to minimise the misclassification error is to predict Y = 1 when p ≥ 0.5 and Y = 0 when p < 0.5. This is to say that non-negative values of β0 + xβ predict value 1, and 0 otherwise. Bayesian networks. Probabilistic graphical model that represents a set of random variables and their conditional dependencies through a directed acyclic graph [73]. Edges represent conditional dependencies, while nodes that are not connected represent variables that are conditionally independent of each other. Each node is associated with a probability function that takes a particular set of values for the node’s parent variables as the input, and gives the probability (or probability distribution, if applicable) of the variable represented by the node as the output. Decision trees. Involves a set of techniques aimed at generating comprehensive tree structures that classify records by sorting them based on attribute values. Each node in a decision tree represents an attribute in a record to be classified, while each branch represents a value that the attribute can take - see Fig 3 Bottom Left for a graphical example. Decision trees where the target variable can take on continuous values are called regression trees. Let D be the set of training records that reach a node. The general procedure to build the tree is as follows: 13
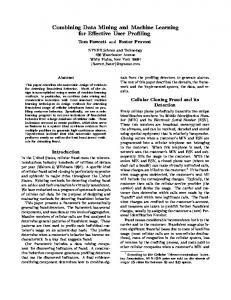
• If D contains records that belong to the same class, then this is a leaf node. • If D contains records that belong to more than one class, use an attribute test to split the data into smaller subsets. Apply the procedure recursively on the obtained subset. Depending on the criteria (information gain, Gini index, etc.) chosen to decide the splitting point, different algorithms have been described in the following literature. Gini index is used in CART [74], SLIQ [75], SPRINT [76]; information gain is used in ID3 [77] and in the well known C.45 [78]. The main advantage of decision trees is that they are simple to understand and requires little data preparation, being able to handle both numerical and categorical variables. Its ability to perform well with large datasets has made decision trees one of most used techniques, even though they present the drawback of being based on heuristics where locally-optimal decisions are made at each node. Random forests. When problems are characterised by a large number of variables, each one of them encoding very little information, the best strategy is to grow an ensemble of trees and letting them vote for the most popular class. Following this idea, random forests are a combination of tree predictors such that each tree depends on the values of a random vector sampled independently and with the same distribution for all trees in the forest [79]. Each tree in random forest is grown as follows: 1. Sample with replacement a given number of cases from the training set at random. This sample will be the training set for growing the tree. 2. Given M input variables, select randomly at each node m τ , and ai,j = 0 otherwise. Here we consider the following topological metrics: the degree density, transitivity, assortativity and efficiency. The corresponding histograms, comparing control subjects and patients, can be found in Fig. 5 Bottom, for networks created with correlation (top) and Granger Causality (bottom). Some interesting conclusions can already been drawn. For instance, in the case of the linear correlation, patients seem to have higher degree density, transitivity and efficiency, thus indicating a more strongly connected network. Although less evident, similar results, particularly a higher efficiency for patients, are observed in the case of the Granger Causality. One may stop here, add some statistical tests to confirm that the differences are indeed significant, and probably have a nice preliminary paper on the effects of alcoholism on brain activity. However, one may also start asking important questions. Is it better to use a linear correlation, or the Granger Causality? In other words, are these two metrics assessing different and significant aspects of brain dynamics? What is the best topological metric to describe the differences between both groups? Is the applied threshold the best possible one or can it be optimised? And finally, what is the discriminative power of this analysis? Could we diagnose the health condition of a new subject? Answering these questions, or more specifically, understanding how we can answer them by using data mining is the objective of this review. We leave these questions unanswered till the next section where the use of classification algorithms is further discussed. 3. Classification In this section, we start dealing with one of the most important tasks in data mining: classification, i.e. the creation of models to predict the class of an unseen instance. As discussed in the introduction, this has many applications in cross-disciplinary fields, as in medicine, with the creation of diagnostic tools. Before presenting examples of classification tasks involving complex networks (Sections 3.3 to 3.5), two additional 3 The attentive reader would note that some intermediate steps may be required, e.g. filtering the data for spurious or erroneous samples, or selecting only some frequency bands. As our aim is not to yield a correct neurological analysis, but instead to exemplify the process to be followed, we have omitted these pre-processing tasks.
21
a)
b) Control subjects Alcoholic patients
Signal amplitude (mV)
20
CZ
CZ
C3
O2 10
F4
0
P7
P4
F3
FZ
-20
0,00
0,20
0,39
0,59
0,78
Frequency
c)
0,4
0,4
0,3
0,3
0,2
0,2
0,1
0,1
0,0 0,0
0,5
1,0
P3
O1
PZ O1
P8
Control subjects Alcoholic patients
0,3 0,2 0,1
0,6
1,0
0,0
Transitivity
-0,5
0,0
0,5
1,0
0,0 0,0
Assortativity
0,5
1,0
Efficiency
0,2
Frequency
T8
P3
F7
0,1
Degree density
Control subjects Alcoholic patients
0,3
0,4
0,2
0,4
0,1 0,2
0,2 0,0 -0,2
T7
C4
FP2
F8
P8
0,2
0,0 0,2
0,6
P4
F3
FZ
FP1
PZ
F8
0,98
Time (seconds)
P7
T8
-10
F7
F4
T7
C4
FP2
FP1
C3
O2
0,0
0,2
Degree density
0,4
0,0
0,1
0,0
0,2
0,4
Transitivity
0,0
-0,3
0,0
Assortativity
0,3
0,0 0,0
0,2
0,4
Efficiency
Figure 5: A standard functional network analysis. (Top Left) Example of four time series, two for control subjects and two for patients, representing the brain activity during a cognitive task. (Top Right) Two functional networks (green for the control subject, red for the patient) obtained through linear correlation. The links weight is represented by the width of the line; the size of nodes indicates their centrality. (Bottom) Histograms of four metrics, for networks obtained through correlation (top) and Granger Causality (bottom).
issues should be discussed. First, the relevance of using classification algorithms, against resorting to simple statistical metrics (Section 3.1); second, the advantages associated with using network topological metrics, against the direct analysis of the network adjacency matrix (Section 3.2). 3.1. Statistics vs. classification Suppose one is studying a given network metric, e.g. the clustering coefficient, to see if it indicates relevant differences between populations. Its relevance can be assessed in two different ways. The first relies on the use of some non-parametric statistical test, e.g. the Kolmogorov-Smirnov test, to assess if samples corresponding to both groups are drawn from the same distribution. If the hypothesis can be rejected, then the two groups present a statistically significant difference in their network structure. The final result of this analysis would be a p-value, which can then be compared against a significance level threshold (usually denoted by α). The second option involves performing a classification task, in which the subjects within the two groups are classified, using the network metric as the input feature. In this case, the output will be a classification score (or equivalently the classification error). The considered metric would be relevant if the score is sufficiently high (or conversely, the error is sufficiently low). In principle, one may expect both methods to be equivalent. A low p-value signifies that the values of the considered metric are well separated between both groups, and thus a classification task can be easily 22
50
0
-60 30
-90 -120
20 0.0
0.5
1.0
Separation (µ)
1.5
2.0
-150
45 40
-2
35 30
-4
25 20
-6
log10 p-Value
-30 40
Classification error (%)
0
log10 p-Value
Classification error (%)
50
µ
15 10
0
20
40
60
80
100
-8
Number of instances
Figure 6: p-value vs. classification score. (Left) Data setup, with two normal distributions of σ = 1.0 and centres separated by a distance µ. (Centre) p-value and classification error as a function of the separation µ. (Right) p-value and classification error as a function of the number of samples drawn from each distribution.
performed. Nevertheless, there are situations in which this is not true. Fig. 6 Left depicts a simple situation, with two probability distributions representing the topological values obtained for the two groups of subjects. For the sake of simplicity, both distributions are normal, with σ1 = σ2 = 1.0; their centres are separated according to a parameter µ, such that µ1 = − 21 µ and µ2 = 12 µ. When a large number of samples (n = 1000) are drawn from both distributions, and the resulting p-values and classification errors are calculated as a function of µ, the obtained results are as depicted in Fig. 6 Centre. While the p-value drops very fast (note the log scale), the error presents a more flat slope. As an example, in the separation of µ = 1.0, the p-value is of the order of 10−30 , while the classification error is still around a 40%. This illustrates an important point: when two distributions are different in a statistically significant way, the difference may not be sufficient to enable a successful classification task. While uncommon, the opposite situation can also appear. Fig. 6 Right reports the evolution of both the p-value and the classification error as a function of the number of instances (samples) available in both groups (for µ = 1.0). In the case of very small sets (i.e. below 20 subjects), the reduced dimension prevents obtaining a p-value below the desired significance level, even though a classification can be successfully performed. Notice that this situation is quite common in biomedical problems, where the number of subjects available is seldom in the hundreds. These results suggest that a researcher should err on the side of caution. The p-value provides valuable information about the statistical significance of an analysis, but it is not enough to assess its usefulness. This is especially relevant when the objective is not just theoretical, as when a diagnostic tool is constructed. Conversely, when the available data set is small, the classification score alone may be misleading, and it should be complemented by an analysis of its significance. 3.2. Are network metrics really necessary? Data mining has previously been defined as the computational process of discovering patterns in sets of data. As such, one may question the necessity and advantage of using a complex network representation to extract structural patterns, as this would be completed by data mining analysis. Suppose we are studying a set of networks, each fully described by an adjacency matrix Ai . The same information can be translated into a vector Ai = {a1,1 , a1,2 , . . . , an,n }, which can then be used as the set of features for training a classification algorithm. If such algorithm were optimal, in that it could detect any class of patterns, it would describe the system as a network and the topological features extracted would be meaningless. It is simple to disprove this hypothesis. Fig. 7 presents the results of a process in which 20.000 random networks of ten nodes have been generated with a fixed link density (p = 0.3). On one hand, two topological metrics (efficiency and clustering coefficient) were extracted from these networks. However, on the other hand, the adjacency matrices have been fed inside an Artificial Neural Network (ANN), trained to recover the obtained metric values. Both outputs, i.e. the true topological values and the estimation obtained by the ANN, are fit linearly, and the coefficient of determination R2 represented in Fig. 7 as a function of the number of nodes and hidden layers in the ANN. The small R2 obtained in each case (below 0.04) indicates that the data mining model is not able to recover the true topological indicator. This is especially noteworthy in the case of the clustering coefficient, as it is a local metric that can be estimated by just 23
Clustering coefficient
0.04
0.03
0.02
0.01
0.00 0
20
40
60
80
Number of hidden neurons
100
0.020
Goodness of lineal fit (R2)
Goodness of lineal fit (R2)
1 layer 2 layers 3 layers
Clustering coefficient 1 layer 2 layers 3 layers
0.015
0.010
0.005
0.000 0
20
40
60
80
Number of hidden neurons
100
0.5
Goodness of linear fit (R2)
Efficiency 0.05
0.4 0.3 0.2 0.1 0.0 0
20
40
60
80
100
Number of triangles sampled
Figure 7: Network metrics vs. direct data mining. (Left) Coefficient of determination (R2 ) for the linear fit between network efficiency and the prediction of an Artificial Neural Network - see main text for details. (Centre) R2 for network clustering coefficient. (Right) R2 for network clustering coefficient, and the approximation obtained sampling triangles of the network.
sampling triplets of nodes and evaluating the fraction of nodes that are connected. The R2 obtained in this process, as a function of the number of triplets sampled, is shown in Fig. 7 Right. This simple numerical experiment demonstrates that one single data mining algorithm is in general not sufficient to deal with the structure of a sufficiently complex system. Additional reasons for this can be identified: Macro- and meso-scale perspectives. Data mining algorithms are optimised to extract relationships between a small set of features, but are not optimised to analyse interactions on a global scale. For instance, calculating the efficiency of a network requires estimating each of the shortest paths within it; a task that cannot be solely accomplished by an ANN. Statistical perspective. Most data mining algorithms hitherto designed do not handle a statistical approach well. On the contrary, they are optimised to detect patterns between fixed sets of features. Even in the case of local metrics, such as the clustering coefficient, the ANN is not able to statistically sample the data set. It is then clear that a complex network approach provides an important added value to the study of complex systems, which cannot be obtained by data mining alone. In the following sections, we will review examples, mainly drawn from biomedical and engineering applications, in which data mining and complex networks are used to create classification models. 3.3. Classifying with complex networks: Neuroscience In biophysics it is often important to be able to diagnose a disease. Two or more states, e.g. normal (or control) and pathologic, typically need to be distinguished. The problem then consists in creating meaningful network representations, extracting topological metrics, and assessing the differences between the states. Within neuroscience, a natural way to build a network representation is the use of the functional network concept: synchronisation between time series recorded by means of EEG 4 , MEG 5 or fMRI 6 can be assessed, and mapped in a functional network. Historically, most of the classification tasks performed with functional networks and data mining models have been focused on MRI and fMRI. Within this, the most used classification model is by far the Support Vector Machine (SVM). The reasons for this choice are easily identified. SVM is conceptually simple, easy to 4 Electroencephalography (EEG), an electrophysiological monitoring method to record the electrical activity of the brain, both in resting states and during a specific task. 5 Magnetoencephalography (MEG): similar to EEG, but focuses on recording the magnetic signals generated by the brain activity. 6 Magnetic Resonance Imaging (MRI), and its functional equivalent (fMRI), is a medical imaging technique that uses magnetic fields and radio waves to form images of the brain.
24
represent, and is simple to extract biological rules from the model structure. In other words, SVM simplifies the translation of results to a biomedical language. Numerous neurological pathologies have been studied by means of fMRI and SVM. Diagnosing Alzheimer’s disease has been extensively discussed in the literature, both with linear [132, 133, 134] and non-linear kernels SVM [135]. The discrepancies between young and older adults, or in general children vs. adults, have also been addressed, due to its relevance in understanding how the brain develops and reaches a mature functional status [136, 137, 138]. Additional pathologies include: • Schizophrenia, a pathology whose main challenges are its complexity, in terms of multiple symptoms, and the lack of characterisation in terms of local abnormalities of brain activity. The fact that this affects the collective, emergent working activity of the brain suggests that a complex network approach can yield relevant results. This topic is discussed in Refs. [139, 140]. • Major Depressive Disorder (MDD) patients, and their discrimination from non-depressed controls, by means of whole-brain tractography [141]. Results indicate that the best network metric is the small-worldness, a measure of the balance between global integration and local specialisation [23, 24]. • Social Anxiety Disorder (SAD), an extreme fear of being scrutinised and judged by others in social or performance situations [142]. • Attention Deficit Hyperactivity Disorder (ADHD), in which symptoms include difficulty staying focused and paying attention, difficulty controlling behaviour, and hyperactivity [143]. • Spinocerebellar ataxia type 7 (SCA7), a genetic disorder characterised by degeneration of the motor and visual systems [144]. • Discrimination between shiverer (C3Fe.SWV M bpshi /M bpshi ) and background control (C3HeB.FeJ) mice, a model for studying Parkinson’s Disease [145]. Kernel learning, the concept underpinning SVM, which evolved to Multiple Kernel Learning, has received increasing attention in neuroscience and has yielded relevant results. As already discussed in Section 2.2, this presents two important advantages. First, it allows the merging of different types of information, for instance coming from different biological sensors. Second, when spatial information is embedded, it detects the regions of the brain which are relevant for the task. Examples of classification tasks using MKL include Ref. [146], where this technique has been applied in two tasks: a classification of patients with schizophrenia vs. controls and a classification of wake vs. sleep healthy subjects. It has also been used to diagnose amyotrophic lateral sclerosis (ALS) [147], Alzheimer’s patients [148, 149], Mild Cognitive Impairment (MCI) [148, 150], post-traumatic stress disorder (PTSD) [151], and image-stimuli data [152]. Most of the examples above share a common feature: fMRI data are analysed by means of a single classification algorithm; specifically SVM (or its evolution MKL). This is an important limitation, as one algorithm does apply to all scenarios. Different classification models make various assumptions on the underlying data, which can then translate into important differences in classification scores. The problem of comparing classification algorithms is not new in data mining. For example, the interested reader may refer to Ref. [153] for a comprehensive comparison, and to Ref. [154] for a discussion of the associated methodological problems. Without delving into theoretical details, we stress once again that, to maximise the relevance of obtained results, scientists should try more than one algorithm. Of the works previously described, three papers have performed such comparison. Specifically, Ref. [139] compares Markov Random Field, Gaussian Naive Bayes and SVM; Ref. [137] Naïve Bayes with kernel densities, SVMs with linear and 2nd order normalised polynomial kernels, a radial basis function network, a multi-layer perceptron, and tree-based algorithms (C4.5, functional tree and random forest); Ref. [143] linear SVM, SVM with a RBF-SVM, decision stumps as a base classifier in adaboost, random forests, and C4.5 decision trees. Results are heterogeneous; the Ref. [143] reports that the best classifier is a SVM with radial kernel, while Markov Random Field outperforms SVM in Ref. [139]. These results highlight the importance of 25
comparing different classification algorithms, as even similar data (fMRI) may be better understood by different approaches under different conditions. Examples of classification tasks on functional networks can also be found in studies using EEG and MEG data. In Ref. [155], a diagnosis in children with partial epilepsy is performed; resting EEG activity away from epileptic seizures is used to create networks, and then classified by means of Decision Trees (DT). The detection of epilepsy in newborn infants is also the topic of Ref. [156]; this study aims at identifying important EEG channels, corresponding to nodes, using SMVs and Gaussian Mixture Models (GMMs) [157]. Ref. [158] uses EEG recordings of children carrying out a face perception task to diagnose autism; the model used is a SVM with polynomial kernels, giving a notable 94.7% accuracy result. A similar goal is pursued in Ref. [159] but this time using MEG data. The functional networks associated to resting activity of eight autistic subjects reconstructed using Granger Causality is discriminated with an 87.5% accuracy using SVMs. SVM and Granger causality are also used in Ref. [160], to discriminate mild traumatic brain injury (mTBI) patients. Finally, while the classification is not the main topic of the work, SVM are also used in Ref. [161] to discriminate MCI and healthy subjects. While functional networks obtained from EEG, MEG and fMRI data have yielded important results, Ref. [162] sounds a cautionary note. One of the problems of both EEG and MEG analyses is that the true network, or the network created by all neurons, cannot be recovered due to intrinsic limitations in the available technology. All previous reported studies thus deal with downsampled networks, whose number of nodes is defined by the number of sensors in the machine. The authors showed, using a large set of synthetic networks with standard topologies and corresponding down-sampled sub-networks, to then compare the resulting topologies using nearest neighbour classification (NNC), multi-layer perceptron (MLP) and support vector machine (SVM), that the topological measures may substantially deviate from that of an underlying, larger network, when sampled at a few surface sites. This suggests that the use of EEG and MEG recordings introduces an important error in the analysis. The problem of defining, or sampling, the nodes of a network will be further discussed in Section 5.1. Finally, brain connectomics has also been addressed with data mining tools. For instance, Ref. [163] studies the effect of traumatic brain injury, with white matter connections between 165 grey matter brain regions defined using tractography, and structural connectivity matrices calculated from skeletonised diffusion tensor imaging data. Support vector machines trained with graph metrics of white matter connectivity matrices from the microbleed group were able to identify patients with a history of traumatic brain injury with 93.4% accuracy. 3.4. Classifying with complex networks: Brain-Computer Interfaces While the field of Brain-Computer Interfaces (BCI) also deals with the analysis of the human brain dynamics, its focus is different from the previously reported examples of neuroscience classification problems. Instead of analysing differences between normal and pathological conditions, BCI aims at detecting patterns in brain activity to control external machines, such as computers. Examples of applications include the discrimination between movements involving the right hand and right foot, which, when performed by means of SVM, reaches a 99.1% accuracy [164]; and the discrimination of left and right hand movements, also performed by means of SVM [165], with accuracy rates ranging from 97.77% to 100%. Beyond SVM, other classification algorithms have been used in BCI problems. An interesting example can be found in Ref. [166], in which a classification of imaginary motor tasks from EEG data was performed by means of hidden conditional random fields (HCRFs) [81]. An HCRF generates sequences of labels for sequences of input samples, and thus allows exploiting the temporal structure present in EEG data. In this study, the interest of this methodology goes beyond its improvement of classification accuracy, as it allowed extracting valuable information on phenomena underlying a motor imagery task. Finally, brain activity associated with the execution of a given task may not be representative of a complete functional network. It may be interesting to reduce their complexity, for instance by extracting the corresponding minimum spanning tree (MST), and by performing the classification on its characteristic parameters. This was proposed in Ref. [167], in the task of discriminating between imagery hand movements (both right and left) and resting state conditions. 26
3.5. Classifying with complex networks: -omics data Omics is a term that generically refers to research fields in biology ending in -omics: genomics, lipidomics, proteomics, foodomics, transcriptomics and metabolomics [168]. Omics has received increased attention in the last decade due to its possibilities regarding system biology. The causes and development of a disease are seldom due to individual elements; e.g. single genes, proteins or metabolites. On the contrary, it is usually necessary to characterise their interactions, both within the same omics family, and between elements of a different kind. As such, omics studies naturally merge network representations with data mining analyses. One of the most important problems is lethality mining (also called dispensability), which aims at detecting which omics elements are essential for the functions of the cell. Notably, in most organisms knocking out most genes has little or no affect on the cell viability, and only in few cases is lethal. The problem is then detecting such lethal elements, as understanding which biological mechanisms have been affected. Gene dispensability has been studied by combining network topological features with individual properties related to essentiality, such as flux deviations, centrality, codon frequencies of the sequences, coregulation and phyletic retention. When this information is combined in a decision tree, it has been possible to identify lethal genes in Salmonella typhimurium with an AUC score of 75% - 81% [169]. Expanding from single genes to gene pairs, synthetic lethal (SL) interactions have been studied and can be predicted from the topology of the interaction network. Ref. [170] presents results combining multiple classifiers, namely SVM, neural network, RIPPER (rule-based classifier), random forest, k-nearest neighbours (KNN) and decision trees. Random walks on the interactions networks, combined with a J48 decision tree, also yielded excellent results, which include: a true positive rate of 95% against a false positive rate of 10% for Saccharomyces cerevisiae, and a true positive rate of 95% against a false positive rate of 7% for C. elegans [171]. A classification task can also be performed to identify “friendly” connections, i.e. interactions which are beneficial to the cell. This has been studied in S. cerevisiae gene networks through graph diffusion kernels, with a 50% precision and 20% to 50% recall [172] - see Fig. 8 for a graphical representation of the results. Protein’s dispensability has been relatively less studied, due to the challenges associated with modifying the presence of these molecules in vivo. Nevertheless, it has been proposed the use of neural networks and SVMs, combined with complex network features (e.g. the number of neighbours in the protein-protein interaction network and the gene expression cooperativity network), to predict essential and non-essential genes, for then using trained models to predict associated protein dispensability [173]. SVM classifiers and network properties of protein interaction networks have also been used to predict synthetic sick or lethal (SSL) interactions between proteins, specifically in S. cerevisiae [174]. Another relevant problem in omics analysis is the association of functions with specific genes and proteins, such as function annotation. Historically, this task has been performed by using various methods based on sequence or structural similarity [175, 176]; more recently, the topology of protein interaction networks has been proposed as a viable alternative [177, 178]. It has further been proposed that lethal interactions and functional similarity are related problems. For example, kernel machines have been used to predict gene functions starting from lethality and interaction data in yeast [179]; and a logical learning system called eXtended Hybrid Abductive Inductive Learning (XHAIL) for mapping genes of unknown function to enzymes in a known metabolic network [180]. Beyond the use of lethality information, protein function prediction has been performed by means of a large number of complex networks and data mining techniques. Among others, these include: Markov random fields, to infer a protein’s functions using protein-protein interaction data and the functional annotations of its interaction protein partners [181]; decision trees and naïve Bayesian networks for predicting protein interactions in yeast [182]; and random forest based methods, combined with bipartite network representations [183]. Related problems are the identification and annotation of proteins that perform their jobs as part of a multi-protein unit, i.e. of a complex. Methods combining complex networks and data mining have been proposed to tackle this task. To illustrate, the analysis of level-2 neighbours, i.e. proteins that do not interact but share interaction partners [184]; and SVM classifiers on yeast protein interaction networks, achieves a coverage of 89% at a false discovery rate of 10% [185]. Omics data and omics interactions have also been used to understand the origin and development of different diseases. The study of endocrine disorders is of special importance. The endocrine system is a 27
Figure 8: Friendly gene interactions identified by means of data mining techniques, organised according to the involved pathways. Reprinted figure with permission from Ref. [172].
network of glands that produce and release hormones that help control many important body functions, including the body’s ability to change calories into energy that powers cells and organs. Endocrine disorders are usually the result of the failure of multiple omics elements, and are therefore well suited to be studied by means of complex networks [186]. Studies include a protein interaction network-based analysis of Juvenile Idiopathic Arthritis (JIA), a common early onset disease encompassing all forms of arthritis, of unknown origin [186]. Additionally, Hepatocellular Carcinoma (HCC) has also been studied through a omics network-based analysis, by identifying clusters of co-expressed proteins between HCC and Metastatic Hepatic Carcinoma (MHCC) [187]. Finally, it is worth citing a few studies proposing different approaches to study relationships between omics networks and diseases. Specifically, text mining has been proposed as a way to predict gene-disease associations, by automatic literature mining based on dependency parsing and support vector machines [188]; the trained system can then be used to classify the new sentences as describing an interaction between a gene pair or not [189]. A new way of creating networks of omics interactions has also been recently proposed, based on the identification of expression deviations from a reference level detected in control subjects, by means of different data mining techniques. These networks, called parenclitic, have been applied to problems like the detection of genes responsible for abiotic responses in plants [190], or the detection of key genes and metabolites in different diseases [191, 192, 193, 194, 195]. 3.6. Hands-on: classification Now that we have a better view of how data mining algorithms can be used to classify complex networks, let us go back to and expand the results presented in Section 2.5. Specifically, we will show how two 28
1 ,0
0 ,8
Ctrl: 5
Alcoh: 18 Transitivity < 0.7175
Ctrl: 5
Alcoh: 9
Transitivity
> 0.7175
Ctrl: 0
Alcoh: 9
Assortativity > -0.0396
Ctrl: 35
Alcoh: 22 Link density
< 0.1257
Ctrl: 1
Alcoh: 8
1 ,0
A lc o h o lic p a tie n ts
0 ,8
T r a in in g e r r o r G e n e r a lis a tio n e r r o r
0 ,6
0 ,6
S c o re
T r a n s itiv ity
Ctrl: 40
Alcoh: 40 Assortativity < -0.0396
C o n tro l s u b je c ts
0 ,4
0 ,4
0 ,2
Link density > 0.1257
0 ,2 Ctrl: 34
Alcoh: 14
-0 ,8
-0 ,4
0 ,0
A s s o r ta tiv ity
0 ,4
0 ,8
0 ,0 D e c is io n T r e e
S V M
S G D
k N N
R a n d o m
F o re s t
Figure 9: Classification of the data obtained in Section 2.5, for networks obtained with a correlation metric. Left and Centre panels respectively depict the result of applying a Decision Tree and a SVM model. Right panel reports the training and generalisation scores obtained through five different algorithms.
commonly used algorithms, Decision Tree and SVM, would interpret the topological features resulting from those analyses. First, let us consider a Decision Tree. As discussed in Section 2.2, this class of algorithms constructs a top-down (or reversed) tree structure, in which each node represents an attribute, and branches different values of those attributes. A graphical representation of the resulting classification model is depicted in Fig. 9 Left. Note that the top (or main) node includes all 40 + 40 subjects. A first selection is subsequently performed, according to the value of the assortativity; for values lower than −0.0396, we have 5 + 18 subjects (respectively control and alcoholic), and thus more alcoholic than control subjects; on the other hand, assortativity values greater than −0.0396 give rise to the complementary situation. How can this model be used to classify? Quite simple: if we have a subject with an assortativity lower than −0.0396, and a transitivity higher than 0.7175, we can conclude that he/she is alcoholic, as we have not seen an instance of a control subject with such values (second node in the lower row). Of course, this is not always that simple: the last node indicates that when the assortativity is higher than −0.0396 and the link density higher than 0.1257, the subject is possibly healthy (although we are not certain). Let us further consider the case of SVMs. Fig. 9 Centre depicts the plane created by transitivity and assortativity 7 , with a black solid line representing the best separation between control subjects and patients (respectively represented by green squares and red circles). Above this line, there are more control subjects than patients, while the opposite occurs below; thus, a new subject could be classified by assessing the position in the plane. In both cases, we can see that the classification is not perfect, although both algorithms do detect some patterns. Using these 80 subjects, we can calculate the effectiveness of the classification, i.e. the training score (training due to the fact that the same subjects are used in the training and in the validation). Results are presented in Fig. 9 Right as black bars, both for the two considered algorithms, and for three additional ones (Stochastic Gradient Descent, kNN and Random Forest). The classification task seems quite successful, especially with the latter algorithm, which yields a score close to a 100%. Nevertheless, one should never forget the problem of validation, as discussed in Section 2.2: what would happen if the algorithm was tested with a brand new subject, not present in the training set? To answer this, Fig. 9 Right also reports the generalisation score (green bars), calculated through a Leave One Out Cross Validation (LOOCV). What conclusions can be drawn from this analysis? The differences in topological features that we observed, depicted in Fig. 5, can indeed be used to classify patients, and different algorithms seem to converge towards a score of 60%. This score is not very high, and essentially useless for clinical applications; but has been obtained without optimising any of the parameters (like the threshold for binarising networks). In the next section we will see how data mining can be used to optimise these parameters and ultimately improve this seemingly disappointing result. 7 Note that the full classification model would require representing a four-dimensional space, quite beyond the possibilities of modern journals!
29
4. Improving network significance As previously introduced in Section 2.1, the analysis of functional networks requires tackling three interconnected problems: the selection of a synchronisation metric, of a threshold, and of a set of topological metrics. This Section explores how data mining can help in performing a guided selection, i.e. how it can provide a series of rules for choosing the best combination of these three elements given a global objective. 4.1. Selecting the synchronisation metric The presence of functional relationships between pairs of nodes (e.g. of sensors in brain networks) is usually assessed through statistical relations between the corresponding time series. Two problems emerge. First, interpreting the meaning of links, i.e. what aspect of the relationship each metric is assessing; and second, electing the most appropriate metric out of the great number of available ones. In neuroscience, this is further complicated by the dynamical nature of brain functional links. Observed activity can be regarded as a sequence of waxing and waning synchronisation and desynchronisation episodes between distant brain regions. Synchronisation facilitates integrative functions, by transiently binding together spatially distributed neural populations, while desynchronisation may allow the brain to flexibly switch from one coherent state to another [196, 42]. In brain functional networks, links are thus unstable objects, whose existence is bounded to specific time frames. In the last decades, this problem has been tackled by means of different statistical approaches, generally based on assessing the differences between the networks obtained through different metrics. For instance, Directed Transfer Function (DTF), its modification known as direct DTF (dDTF) and the Partial Directed Coherence (PDC) have been compared using EEG recordings [197]; unpartialised and partialised crosscorrelations (the second trying to eliminate indirect relationships) [198]; and EEG recordings have been analysed through 9 bivariate and multivariate synchronisation measures, the latter directly ascribing a single value to the synchronisation in a group [199]. In all these cases, differences between networks are studied through p-value analyses, and results indicate that different metrics lead to important differences in the final network structure. An isolated exception is represented by Ref. [200], in which different metrics (nonlinear interdependences, phase-synchronizations, Mutual Information, cross-correlation and the coherence function) appeared to detect similar phenomena in EEG recordings. A step ahead in complexity is provided by those analyses that try to understand how some synchronisation metrics are able to discriminate between different groups of subjects. This has initially been performed through statistical tests. For instance, Ref. [201] characterises the differences between different stages of human sleep, based on scalp EEG and using Synchronisation Likelihood [202] and a non-linear interdependence measure [200]. Differences between sleep stages were assessed through the Variation of Information information criterion [203]. Ref. [204] compared the magnitude square coherence (MSC), cross-correlation (CCOR), normalised Mutual Information (NMI) and normalised joint entropy (NJE) when different stimuli were presented to a group of subjects, ranging in pleasure (valence) and arousal. Finally, Ref. [205] compares four metrics, i.e. Pearson product moment correlation, Spearman rank order correlation, Kendall rank order correlation and Mutual Information, in eyes open and closed EEG recordings. It is worth noticing that this last work explicitly studies the ability of each metric to discriminate between conditions, even if no data mining tools were considered. In recent years, classification models have been included in this task, as for instance in Ref. [206], to discriminate between control and Alzheimer’s patients, both in EEG and MEG recordings. Five metrics were considered: approximate entropy, sample entropy, multiscale entropy, auto-Mutual Information and Lempel–Ziv complexity. The ability to discriminate AD patients from control subjects was evaluated using receiver operating characteristic (ROC) curves. The first two metrics resulted to be the most reliable for classification, being significantly lower in the EEG of AD patients. Furthermore, the sample entropy appeared to be less dependent on the signal length and more consistent across different parameters, confirming its usefulness in this classification task. Additionally, it is worth citing Ref. [207], in which a classification was performed between resting states and video watching tasks. Functional connectivities were measured via the Pearson correlation (PeCo), partial correlation (PaCo), Mutual Information (MI), and wavelet transform 30
0 Control MCI
Motif 1 Z-Score
-20
-40
-60
-80
0,0
0,5
1,0
1,5
2,0
Small-worldness
Figure 10: Optimising the network binarization process using classification scores, in a task of differentiating between control subjects and Mild Cognitive Impairment (MCI) patients. (Left) Best classification score as a function of the link density; black (red) points indicate the score obtained using pairs (triplets) of network features. (Right) Best classification of MCI and control subjects. Reprinted figure with permission from Ref. [161].
coherence (WTC). WTC yielded the best classification performance, suggesting that WTC is a preferable functional connectivity metric for functional brain network study. 4.2. Selecting the threshold Once a synchronisation metric has been selected, a pairwise analysis of the node time series yields a set of weighted cliques, i.e. fully connected graphs whose weights correspond to the synchronisation strength detected between the corresponding time series. The direct analysis of such weighted cliques would prima facie represent the best solution, as they codify all the available information about the system. Alternatively, one may binarise them, i.e. pruning the graphs according to some rule applied to link weights, and assigning unitary weights to surviving links. While pruning always implies some information loss, it also yields important advantages. Let us consider the creation of brain functional networks - even though similar arguments would hold in other contexts. First of all, brain networks are expected to be naturally sparse, as increasing the connectivity would imply a higher physiological cost. Most topological metrics available in network theory have originally been developed for unweighted graphs, for only subsequently been adapted to weighted ones; thus, in the former case the researcher has at his / her disposal a larger set of (better validated) tools. Furthermore, low synchronisation values may just be the result of statistical fluctuations, such that lowly weighted links may be present just because of noise; in such cases, deleting such noisy information can only improve the understanding of the system. Pruning can also help deleting indirect, second order correlations, which do not represent direct dynamical relationships. Finally, network analysis benefits from their graphical representation, which is meaningful only when depicting sparse structures. The rules used to binarise networks can roughly be classified into two families: those that are based on statistical arguments, and those which rely on data mining tools. Of the first family, it is worth considering the deletion of all links whose weights are below a given fix threshold; maintains a given fraction of the strongest links; maintain a fixed node degree; or use a statistical test to select those that are significant - see Ref. [208] for a discussion on the pros and cons of each one of them. Data mining provides two additional options, which we are going to review in the remainder of the section: use a classification problem as a criterion for the binarisation, and combine multiple binarisations into a single representation. The first option does not aim at changing the way networks are binarised, i.e. the process is still performed by fixing either a threshold or a link density; it does use data mining to define a criterion for optimising the process. Ref. [161] proposes the use of a classification task to define the best threshold, and specifically to consider the score obtained in the task as a proxy for the significance of the binarised networks. The process works the following way. First, binarised networks are created using different thresholds, 31
covering the whole spectrum (from very dense networks, to sparse ones); second, these networks are used in a classification problem: the threshold corresponding to the highest classification score will be the optimal one, as it allows to extract the most information from the original system. The results of this process are represented in Fig. 10. While this method yields an optimal criterion, it has two important drawbacks: it is computationally costly, as many sets of networks have to be processed; and it yields a single threshold, so that information across different densities cannot be integrated. This second problem has been tackled in Ref. [209]. Authors propose to split the analysis of a set of networks in different steps. First, as in the method of Ref. [161], multiple thresholds are applied, to generate connectivity networks encoding different levels of details. Afterwards, each set of resulting networks are analysed, and their most relevant features selected by using a recursive feature elimination method based on graph kernel [210, 211] and support vector machine. Lastly, a multikernel SVM is used to fuse all features from multiple thresholded networks, to obtain a global classification model. It is worth stressing the advantage of this method; by using a multiple-kernel learning technique, network properties from multiple thresholded networks are merged together. This allows, in principle, to simultaneously account for different topological metrics at different connectivity levels, e.g. motifs in dense networks and efficiency in sparse ones; and to describe the multiscale complexity observed in many real-world systems [212, 213]. 4.3. Selecting the topological metrics Once a set of binary networks has been obtained, the next and final step involves the extraction of some topological metrics, which can ultimately be used e.g. to feed a classification task. Most studies in which an automatic selection of topological metrics has been proposed, this was done by using a combination of two techniques: support vector machines (SVM) and Fisher’s criterion. The former allows to treat the selection process as a classification task: different sets of features can be tested, and the one yielding the best separation (in terms of classification score between two groups of subjects) is selected. The latter is similar in nature, although it does not explicitly rely on a classification task: if finds a linear combination of features that maximises the distance between the means of the two classes, while minimising the variance within each class. Both methods have been used to optimise the network analysis of different types of neurological signals. For instance, MEG time series were analysed in Ref. [159] through Granger Causality, to discriminate autistic and control subjects, reaching a 87.5% accuracy. Two strategies were compared: in one case using the adjacency matrix alone as input feature; in the second, adding to the adjacency matrix different topological metrics. Results indicate that, while both strategies reach the same classification score, the latter is more stable with respect to the number of features included - see Fig. 11. Additionally, Ref. [160] dealt with mild traumatic brain injury (mTBI) patients, also through a Granger causality approach; and Ref. [161] focused on the diagnosis of Mild Cognitive Impairment. Structural brain connectivity has been tackled by means of functional magnetic resonance imaging (fMRI), in patients with Alzheimer’s disease [133]; whole-brain tractography, to identify graph metrics that best differentiate individuals with Major Depressive Disorder (MDD) from nondepressed controls [141]; and diffusion weighted magnetic resonance imaging (DWI), to classify brain connectivity networks based on sex and kinship [214]. As we end this discussion it is once again useful to recall the work performed in Ref. [209]. By using a multikernel SVM, this paper demonstrates that the selection of topological features and that of thresholds can be carried out simultaneously. The importance of this solution resides in the fact that it tackles all the circle represented in Fig. 2 simultaneously. 4.4. Hands-on: improving significance Let us now go back to the hands-on exercise we started in Sections 2.5 and 3.6, and see how data mining can further be applied to increase our understanding of the system. We shall focus on two (critical) aspects: the selection of an optimal threshold and of the best synchronisation metric (in this case the choice is between correlation and Granger Causality). As discussed in Section 4.2, one of the simplest way to optimise the threshold involves extracting networks for different threshold values, and then compare the associated classification score. Fig. 12 Left presents 32
ommon to both average networks entire head, as shown in Figure 2. ommon pattern from each groups’ wn in Figure 3 are obtained.
Statistical analysis using t-tests showed that the measure characteristic path length (p