Psychological Methods 2007, Vol. 12, No. 3, 247–267
Copyright 2007 by the American Psychological Association 1082-989X/07/$12.00 DOI: 10.1037/1082-989X.12.3.247
Combining Propensity Score Matching and Group-Based Trajectory Analysis in an Observational Study Amelia Haviland
Daniel S. Nagin
RAND Corporation
Carnegie Mellon University
Paul R. Rosenbaum University of Pennsylvania In a nonrandomized or observational study, propensity scores may be used to balance observed covariates and trajectory groups may be used to control baseline or pretreatment measures of outcome. The trajectory groups also aid in characterizing classes of subjects for whom no good matches are available and to define substantively interesting groups between which treatment effects may vary. These and related methods are illustrated using data from a Montreal-based study. The effects on subsequent violence of gang joining at age 14 are studied while controlling for measured characteristics of boys prior to age 14. The boys are divided into trajectory groups based on violence from ages 11 to 13. Within trajectory group, joiners are optimally matched to a variable number of controls using propensity scores, Mahalanobis distances, and a combinatorial optimization algorithm. Use of variable ratio matching results in greater efficiency than pair matching and also greater bias reduction than matching at a fixed ratio. The possible impact of failing to adjust for an important but unmeasured covariate is examined using sensitivity analysis. Keywords: observational study, propensity score, trajectory group
A key aim of empirical research in developmental psychopathology and life course studies is to measure the effect on a course of development of an intervention or event that occurs at a particular time. Ideally, such effects would be estimated with experimental data, in which the intervention is randomly assigned to some participants and denied to others, but many interventions that affect development cannot be randomized,
for ethical or practical reasons. In these situations, inferences must be drawn from observational data. Recalling a suggestion of Dorn (1953), Cochran (1965) argued that the design of an observational study should be organized around the question “How should the study be conducted if it were possible to do it by controlled experimentation?” (p. 236). Certain issues are common to an experiment and an observational study, and these shared issues are brought into focus by thinking about the simpler situation of an experiment. One then tries to reconstruct, to the limited extent possible, the circumstances of the experiment from the observational data. Finally, one tries to address the weaknesses that are present in the observational study but that would have been avoided in an experiment. A similar perspective is discussed in Campbell (1957); Campbell and Stanley (1963); Rubin (1974); Meyer (1995); Shadish, Cook, and Campbell (2002); and Rosenbaum (2002b, 2005a). A treatment applied at a particular time, say at age 14, may affect subsequent development, but current exposure to the treatment may also affect future exposure to the treatment. In many contexts, the effect of current exposure to the treatment on subsequent exposure to the treatment is quite important. To take an extreme instance, the most conspicuous and immediate effect of exposure to a highly addictive substance may be to seek further and continued exposure to that same treatment. The opposite pattern is also possible.
Amelia Haviland, Statistics Group, RAND Corporation, Pittsburgh, Pennsylvania; Daniel S. Nagin, Heinz School, Carnegie Mellon University; Paul R. Rosenbaum, Statistics Department, Wharton School, University of Pennsylvania. This work was supported by grants from the Methodology, Measurement and Statistics Program and the Statistics and Probability Program of the U.S. National Science Foundation and Grant RO1 MH65611-01A2 from the National Institute of Mental Health. It also made heavy use of data collected with the support from Que´bec’s Conseil Que´be´cois de la Recherche en Sciences Sociales and Formation des Chercheurs et Aide a` la Recherche funding agencies, Canada’s National Health Research Development Program and Social Sciences and Humanities Research Council funding agencies, and the Molson Foundation. Correspondence conerning this article should be addressed to Daniel S. Nagin, H. John Heinz III School of Public Policy and Management, Carnegie Mellon University, 4800 Forbes Avenue, Pittsburgh, PA 15213-3890. E-mail:
[email protected] 247
248
HAVILAND, NAGIN, AND ROSENBAUM
For instance, a particular treatment of psychopathology may prove ineffective principally because most patients quickly drop out of that particular treatment. In short, a treatment may tend either to perpetuate itself or to discontinue itself. The ways treatment at one time affects subsequent exposure to the treatment may be an important determinant of its aggregate impact on development. The experimental framework that we adopt tends to emphasize these issues. Our analog is an experiment in which treatments are assigned at a point in time, here age 14, and the continued adherence of participants to their treatment or control condition is one of the outcomes under investigation. This emphasis tends not to be shared by most other methods commonly used to study effects on development over extended periods of time. Researchers conducting an experiment would begin treatment at a particular time, here age 14, and would seek to compare treated and control groups that were similar as groups prior to the start of treatment. In this context, similar means two things: (a) similar with respect to both measured and unmeasured background characteristics or covariates relevant to development describing participants prior to the start of treatment at age 14 and (b) similar with respect to developmental trajectory on outcomes up through the start of treatment at age 14. Alas, without random assignment, it can only be hoped that analytical tools can render the groups comparable in terms of the quantities that were measured. For such measured quantities, we draw on two lines of research in our effort to create comparable groups prior to treatment. One line involves the use of finite mixture modeling to analyze developmental trajectories in a group-based framework (cf. Muthe´n, 2001, 2004; Muthe´n et al., 2002; Nagin, 1999, 2005; Nagin & Land, 1993). The second involves the use of propensity scores, matching, and stratification for causal inference in observational data (cf. Rosenbaum, 2002b; Rosenbaum & Rubin, 1983). Here, the trajectory groups are based on pretreatment measures of the variable that, after treatment, is the outcome variable. Thus, fitting a group-based trajectory model to pretreatment, baseline data permits the comparison of treated and control participants who appeared similar, in terms of developmental trajectory, prior to treatment. As such, the trajectory groups serve as the baseline measure of outcome. Fitting propensity scores using observed pretreatment measures or covariates permits the comparison of treated and control groups that are balanced in terms of these observed covariates. Thus, the propensity score serves to stochastically balance observed covariates as random assignment of treatments would do in an experiment. However, unlike randomization in an experiment, neither propensity scores nor trajectory modeling can control for covariates that were not measured; we examine this inescapable concern with the aid of a sensitivity analysis. Sensitivity analysis is used to examine the possible impact of covariates that were not measured. We illustrate our approach with a case study of the possible effects of joining a gang at age 14 on adolescent
males who had not been in gangs prior to age 14. Because none of the boys had been in gangs before age 14, their levels of violence before age 14 were not affected by gang membership. We examine whether first-time gang membership had an immediate effect on violence at 14 and whether effects persisted from ages 15 to 17. We examine the persistence or lack of persistence of gang membership status. We also examine whether these effects depend on prior trajectory of violent delinquency.
Overview of Approach The approach that we discuss is specifically designed to take advantage of two features of modern longitudinal studies: (a) the very rich set of measurements that profile the psychosocial characteristics of study participants and (b) extended pretreatment measurements of the outcome variable. Our point of departure is recent work by Haviland and Nagin (2005) that tackled the same type of inference problem that we address in this article and also illustrated its recommended approach with the same example we use here. As in this article, group-based trajectory modeling plays a central role in Haviland and Nagin. The method is designed to identify groups of individuals following approximately the same developmental trajectory over a specified period of time (e.g., ages 11 to 13) for the outcome of interest (e.g., violent delinquency). Stated informally, prior to joining a gang, individuals in the same trajectory group appeared to be headed along the same path, at least so far as violence is concerned. In the current article, we combine trajectory groups with other techniques, including matching on propensity scores, to control bias from other covariates besides the baseline measures of the outcome variable. The use of trajectory groups as a basis for inference leads to the estimation of trajectory group–specific treatment effects. This is scientifically important because a key premise of life course theories of development is that the magnitude, including the sign, of treatment effects may depend on a person’s developmental trajectory (Elder, 1985, 1998; Thornberry, Krohn, Lizotte, Smith, & Tobin, 2003). Thus, the trajectory group framework allows for the examination of whether there are differences in treatment effects across substantively interesting groups differentiated by their developmental history. The trajectory groups can also be thought of as latent strata representing the history of the outcome variable. In the example here, the outcome is a longitudinal measure of self-reported violence, so the trajectory groups describe the pattern and trend in violence prior to joining a gang, which are both important predictors of subsequent violence and important predictors of joining a gang. In the spirit of research using propensity scores and matching, Haviland and Nagin (2005) used the trajectory groups and the attendant posterior probabilities of group membership for each individual as a statistical device for creating balance on these critically important covariates. A key limita-
PROPENSITY SCORES AND GROUP-BASED TRAJECTORIES
tion of Haviland and Nagin is that there is no guarantee that their approach will create covariate balance. Although securing good control of developmental trajectory on the outcome prior to treatment, trajectory groups may or may not be balanced on other covariates that may be related to later violence. Among the other covariates in the example are peer-rated popularity and aggression, teacher-rated hyperactivity and opposition, and self-reported number of sexual partners. By contrast, propensity scores and related matching strategies are specifically designed to achieve balance on measured covariates. In the analytical strategy we propose here, trajectory groups control pretreatment trajectories, whereas matching on propensity scores controls imbalances in other measured covariates. In the example, this strategy successfully balances 15 measured covariates and their patterns of missing data, always comparing a gang joiner with a nonjoiner from the same trajectory group. In our analysis, the trajectory groups also help to characterize treated individuals, boys who joined gangs at age 14 for whom treatment effects cannot be estimated, because there are no controls with comparably high levels of violence prior to age 14. In the simplest randomized experiment, participants are assigned to treatment or control groups by the independent tosses of a fair coin, so that every individual has the same chance, namely 1/2, of receiving treatment rather than being a control participant. In contrast, the defining feature of an observational study is that randomization is not used to assign treatments, so some individuals are more likely to receive the treatment than others. For instance, the boys who joined gangs at age 14 did not do so at random, with equal probabilities; in fact, the boys who joined gangs at age 14 tended to be quite different from those who did not, even several years prior to age 14. The propensity score is the conditional probability of receiving the treatment rather than being part of the control group given the observed covariates (Rosenbaum & Rubin, 1983). In the example, the propensity score is the conditional probability of joining a gang at age 14 given the observed covariates, namely, violence prior to age 14, peerrated popularity, mother’s age at the birth of her first child, and so on. If two boys have the same propensity score given observed covariates, say a 0.2 chance of joining a gang at age 14, then these observed covariates will be of no further use in predicting which of these two boys will join a gang at age 14, so for these two boys, there will be no systematic tendency for the observed covariates to be different for the joiner and the nonjoiner. Two key theorems concern propensity scores. Informally, they say (a) matching or stratifying on the propensity score tends to balance the observed covariates used to construct the score, and (b) if there is no bias from unobserved covariates, then, to adjust for the many observed covariates, it suffices to adjust for the unidimensional propensity score. The propensity score is thus a device for removing imbalances in observed pretreatment covariates. Through match-
249
ing or stratification on the propensity score, one compares treated and control groups that appear comparable prior to treatment in terms of observed covariates. In practice, the true propensity score is not known and must be estimated, and checking covariate balance is an important step in checking the specification and estimation of the propensity score. Nontechnical surveys of methods and results about propensity scores are found in Joffe and Rosenbaum (1999) and West and Thoemmes (in press). Rosenbaum and Rubin (1984, 1985), Smith (1997), and Dehejia and Wahba (1999) presented several case studies. McCaffrey, Ridgeway, and Morral (2004) discussed the use of propensity scores in psychology, estimating the scores with boosted regression. The integration of group-based trajectory modeling and propensity scores is composed of a three-stage analysis. The first stage involves estimating a group-based trajectory model for the outcome and participants of interest. In the context of our demonstration analysis, this step involves the estimation of a trajectory model of violent delinquency from ages 11 to 13 for individuals with no gang involvement over this period. In the second stage, each treated individual is matched with one or more untreated individuals. The matching of those who join gangs with those who do not, carried out within a trajectory group, attempts to find nonjoiners who are close on an estimate of the propensity score and on the individual variables that enter the propensity score. We then check the degree of success of the matching strategy in achieving balance between the first-time gang members—the treated—and their matched counterparts who did not join gangs—the controls. In the third stage of the analysis, the treatment effect of the event of interest, gang membership in our case, is analyzed. Specifically, we examine the effect of first-time gang membership at age 14 on violence at age 14 and beyond, within and across trajectory groups. In this article, we use some statistical methods that may be unfamiliar to some readers. To make this material accessible without excessive detail, we provide brief overviews of such methods, a few detailed technical footnotes, and references to sources that provide fuller elaboration. Also, to provide orientation, we begin with an outline of topics to be covered. We start with a brief description of the data used to illustrate our approach. This data set is an exemplar of the type of longitudinal data that our method is particularly well suited to analyze. We next describe the creation of the trajectory groups that form the basis for the first stage of analysis. We then move to a series of sections that form the basis for Stage 2 of the analysis. These sections describe covariates other than baseline trajectories that are important to balance; the creation of the propensity score; conceptual issues in planning the match; the matching method itself, including software options; and methods for empirically assessing the success of the match. This is followed by another series of sections corresponding to Stage 3 of the analysis, which concerns analyzing the effect of treatment.
250
HAVILAND, NAGIN, AND ROSENBAUM
In these sections, we describe methods used to test for whether treatment status is associated with changed outcomes, treatment integrity analysis, and sensitivity analysis.
Trajectory Groups and Propensity Scores: Forming Groups That Appeared Comparable Before Treatment Example: Joining a Gang in Montre´al The data used in the case study are the product of the Montre´al Longitudinal–Experimental Study of Boys. The 1,037 male participants in this study were in kindergarten at its outset in the spring of 1984. They were next assessed in 1988 and then again annually until 1995, when their average age was 17 years. The sample was drawn from 53 schools in the lowest socioeconomic areas of Montre´al, Canada.1 To control for cultural effects, we included boys in the longitudinal study only if both their biological parents were born in Canada and their biological parents’ mother tongue was French. This resulted in a homogeneous White, Frenchspeaking sample. Wide-ranging measurements of potentially important covariates such as social and psychological function were made on the basis of assessments by parents, teachers, and peers; self-reports of the boy himself; and administrative records from schools and the juvenile court. These measurements included data on the boys’ behavior across many domains (e.g., sexual activity and delinquency in adolescence) and social functioning (e.g., peer popularity). See Tremblay, Desmarais-Gervais, Gagnon, and Charlebois (1987) for further details on this study. A total of 580 individuals in the Montre´al Longitudinal Study of Boys reported no involvement with gangs from ages 11 through 13 and also had no more than one missing assessment of their violent delinquency and gang involvement over this period.2 The self-reported violent delinquency of these individuals was used to estimate the trajectories. Of these individuals, 68 joined gangs for the first time at age 14. The self-reported data on annual involvement in violent delinquency and participation in delinquent groups, which we hereafter refer to as gangs, form the core of the analyses we report in this article. Queries on involvement in violent delinquency and gangs in the prior year were initiated in 1989, when the boys were 11 years old. Participants were asked about the frequency of their involvement in seven different types of violent delinquency within the past year: threatening to attack someone, fist fighting, attacking an innocent person, gang fighting, throwing objects at people, carrying weapons, and using weapons. These items were each coded on a 4-point Likert-type scale (0 ⫽ never, 1 ⫽ once or twice, 2 ⫽ sometimes, 3 ⫽ often) and summed to form an overall scale of violent delinquency. This scale was used to estimate the trajectory model over the period t ⫽ 1 to T ⫺ 1. In estimating the treatment effect of gang mem-
bership at time T, we excluded the item pertaining to gang fighting. Gang membership status in the prior year was based on the participant’s response to the question “During the past 12 months, were you part of a group or a gang that committed reprehensible acts?”3
Creating Trajectory Groups: The Trend Before Treatment Self-reported data on violent delinquency and gang membership are available from ages 11 to 17. As described in the prior section, a group-based trajectory model was estimated over the ages 11 to 13 for boys with no gang membership over this period. We then examined the effects of first-time gang membership at age 14 on violence at ages 14 to 17. Focusing on joining a gang at age 14 gave us several years of baseline data about violence and other matters so we could match joiners and controls who were comparable before age 14. It also allowed us to examine outcomes over several years. An alternative but substantially more complex design would use risk set matching, in which not just 14-year-olds but joiners at any age are matched to controls who have not yet joined gangs at that same age, and both joiners and controls are followed through time (see Li, Propert, & Rosenbaum, 2001; Lu, 2005). Risk set matching would pair people who are at risk of joining a gang at any age and follow them forward in time, so matched sets start at different ages and are observed for different periods. The trajectory model described violence at ages 11, 12 and 13, before any of these boys had joined gangs, and had three groups, identified by subscript s ⫽ 1, 2, 3. The trajectories were linear over ages a ⫽ 11, 12, and 13, and the parameter in these linear trajectories was the logarithm4 1
Because the 1,037 study subjects were recruited from 53 schools, there is a possibility of school-based dependencies in the data on these subjects. However, we found no evidence of such dependency in respondent reports of their violent delinquency from ages 11 to 17. Specifically, on the basis of an analysis of variance, neither kindergarten school nor class within that school was significantly related to respondent reports of their violent delinquency at any age. 2 Prior to age 14, 282 boys were involved in gangs and 128 had more than one missing assessment. At age 14, an additional 59 boys were missing either their gang membership status or their assessment of violent delinquency. 3 The original version of the question as administered in French was “Au cours des 12 derniers mois, as tu fait partie d’un groupe des jeunes (gang) qui fait des mauvais coups?” 4 As is commonly done, the model for the Poisson expected count is log-linear because (a) lines that are not horizontal are eventually negative, so the expectation sa ⱖ 0 cannot itself be linear, and (b) log(sa) is the natural parameter in the natural parameter exponential family representation of the Poisson distribution.
PROPENSITY SCORES AND GROUP-BASED TRAJECTORIES
of the expectation sa of a Poisson variable,5 log(sa) ⫽ s ⫹ s ⫻ a, where s is the slope in group s. Strictly speaking, the violence scale is not a count, but its behavior resembles a Poisson random variable in several ways. It is right skewed and, within trajectory group, the mean and variance of the scale at each age are about equal. The model is estimated without random effects for two reasons. First, given our treatment of violence counts as Poisson conditional upon latent group and age, the approximate equality of the mean and variance within group by age suggests that there is no need to account for further within-group variation. Second and just as important, our intention is to use the trajectory groups to identify latent strata in the data of individuals following approximately the same developmental trajectory of violent delinquency. Adding random effects to the model will increase the heterogeneity of the group, which is contrary to the very purpose of using the trajectory groups as a statistical device for stratification. The top half of Table 1 reports the estimates from the threegroup model. Group 1, which we call the low-violence group, was estimated to make up 46.3% of the population. The estimates of violence for this group declined only very slightly with age, and the slope coefficient estimate underlying this decline was not significantly different from zero at the ␣ ⫽ .05 level. The second group, which we call the declining group, followed a trajectory in which the expected rate of violence declined with age. For this group, the estimated slope coefficient was negative and significantly different from zero at the ␣ ⫽ .01 level. This group was estimated to make up 47.8% of the population. The final group was composed of a small contingent of individuals, estimated to be 6.0% of the population, whose rate of violence was high and nearly constant. We called this the chronic group. The bottom half of Table 1 reports a cross-tabulation of gang joining at age 14 with trajectory group membership Table 1 Trajectory Model Estimates Based on Violence at Ages 11–13 Parameter
Low (s ⫽ 1)
Trajectory model Group Probability 0.463 Violence rate at 11, s,11 0.31 Violence rate at 12, s,12 0.28 Violence rate at 13, s,13 0.26 Total Gang joiner Not a joiner Percentage joining
Declining (s ⫽ 2) 0.478 1.88 1.53 1.24
Trajectory groups 297 254 21 38 276 216 7.0 14.7
Chronic (s ⫽ 3) 0.060 4.66 4.35 4.05 29 9 20 31.0
Note. Three trajectory groups were formed, low violence (n ⫽ 297), declining (n ⫽ 254), and chronic (n ⫽ 29). The top half of the table describes the model, specifically the violence rates by group and age. The bottom half of the table indicates the subsequent frequency of gang joining at age 14.
251
from ages 11 to 13, where a boy is assigned to the group for which his posterior probability is highest. Observe that there is a pronounced association of trajectory group membership from ages 11 to 13 with gang membership at age 14: Past violence predicts future gang joining. This association exemplifies the self-selection problem that our approach is designed to overcome.
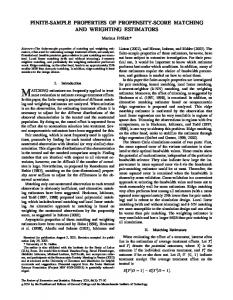
The Importance of Covariates Besides the Trend Before Treatment Trajectory groups control an important subset of covariates, namely, the trend in the outcome measured before treatment, but there are typically many other covariates to consider as well. Our aim was to match, within trajectory group, each first-time gang joiner with one or more of his counterparts who did not join at 14 but who had similar covariates prior to age 14. These covariates include variables that are known to be correlated with violence and include violence scores at ages 10, 11, 12, and 13; peerrated popularity at age 11; the age of the boy’s mother at the birth of her first child; peer-rated aggression at age 11; teacher-rated hyperactivity at age 11; self-reported number of sexual partners at age 13; teacher-rated opposition at age 11; a rough IQ measure; and teacher-rated physical aggression at age 11.6 Figure 1 depicts the covariates prior to matching, together with the two-sided significance level from Wilcoxon’s rank sum test. If this had been a randomized experiment in which the boys in the Montre´al study had been selected at random to join a gang at age 14, 1 covariate in 20 would be expected to yield a significance level of .05 or less. In Figure 1, 10 of the 12 covariates have significance 5
Because just three periods of data were used to estimate the trajectory model, trajectory models defined by higher order polynomials were not estimated. The Bayesian information criterion (BIC) was used to select the number of trajectory groups in the model. The BIC values for the three- and four-group models were about equal. We used the three-group model for two reasons. The first was parsimony; the second concerned the instability of the four-group model. The four-group model split the declining group in the three-group model without materially altering the other two groups. Haviland and Nagin (2005) found that when the model was repeatedly estimated across bootstrapped samples, the variability of the parameter estimates of the three-group model was consistent with the sampling variability implied by the maximum-likelihood estimates of their standard errors. By contrast, the parameter estimates for the two groups carved from the declining group in the three-group model were very unstable across the bootstrap samples. 6 Violence at age 10 was not used in estimating the trajectory model because it measured frequency at age 10 and all prior years, whereas the later year violence measurements are only for that year. For this reason, the frequency reported at age 10 might reflect a cumulative total over several years and might be elevated relative to later ages without reflecting a higher rate of violence.
HAVILAND, NAGIN, AND ROSENBAUM Violence Age 11, P=.0028
Violence Age 12, P=.044
8 Joiners
Potential Controls
Joiners
6 4
Violence Joiners
Mother’s Age, P=.020
Potential Controls
Joiners
Aggression, Age 11, P=.0081
Joiners
Potential Controls
Joiners
Opposition, Age 11, P=.034
4 3
Potential Controls
Joiners
IQ, P=.89
Potential Controls
Aggression, Age 11, P=.27
Potential Controls
6 Joiners
Potential Controls
5 4 3 2 0
1
Teacher Rated Aggression
8 6 2 0
0 Joiners
4
IQ Test Measure
10
8 6 4 2
Teacher Rated Opposition
6 4 2 0
Number of Partners
12
8
2 0
Joiners
10
Sex Partners, Age 13, P=.0024
Potential Controls
1
Teacher Rated Hyperactivity
2 1 0 -1
Peer Rated Aggression
30 25
-2
-2
15
20
Age at First Birth
1 0 -1
Popularity
2
35
3
Potential Controls
Hyperactivity, Age 11, P=0.017
3
Popularity, Age 11, P=.0015
Potential Controls
0
0
0
0
2
2
2
2
4
4
6
Violence
8
6 4
Violence
8
10
12 10 8 6
Violence
Violence Age 13, P=.0032
12
14
Violence Age 10, P=.0087
10
252
Joiners
Potential Controls
Joiners
Potential Controls
Figure 1. Boxplots of 12 covariates before matching for gang joiners at age 14 and for potential controls who did not join at age 14. The p values are from Wilcoxon’s two-sided rank sum test. Because of discreteness, two quartiles are sometimes equal.
levels less than .05. Before joining gangs, joiners were more violent than nonjoiners; were less popular with their peers; were more aggressive, hyperactive, and oppositional; had more sexual partners; and had mothers whose age at the birth of their first child was younger.
Creating the Propensity Score: The Propensity to Join a Gang at Age 14 As a first step in matching the gang joiners with comparable nonjoiners, we estimated a propensity score using the original 12 covariates in Figure 1 plus some others derived from these covariates. The complete list of covariates is described in greater detail later. The propensity score, which measures the conditional probability of joining a gang at age 14 given the covariates, was estimated using a single logit model, which worked well here and in several other published examples (Rosenbaum & Rubin, 1984, 1985). Mc-
Caffrey, Ridgeway, & Morral (2004) illustrated a different way of estimating the propensity score with the aid of boosting. Figure 2 depicts the estimated propensity scores for joiners and potential controls in each of the three trajectory groups. In the low-violence and declining trajectory groups, there is a substantial difference between joiners and potential controls, but there is also a fair amount of overlap in the distributions of joiners and potential controls, so credible matches would seem to be available. By contrast, in the chronic group, the distributions exhibit limited overlap. The median propensity score among participants in the chronic group who join gangs was above the maximum among the nonjoiners, and the lower quartile among the joiners was above the upper quartile among the nonjoiners. Indeed, the median propensity score for the 9 joiners in the chronic group is just slightly above the maximum propensity score
PROPENSITY SCORES AND GROUP-BASED TRAJECTORIES Group 2
Group 3
Joiners
All Others
1.0 0.8 0.6 Prob(Join) 0.4 0.0
0.2
0.4 0.2 0.0
0.0
0.2
0.4
Prob(Join)
Prob(Join)
0.6
0.6
0.8
0.8
1.0
1.0
Group 1
253
Joiners
All Others
Joiners
All Others
Figure 2. Boxplots of estimated propensity scores by trajectory group. Group 1 is the low-violence group, Group 2 is the declining group, and Group 3 is the chronic group. Prob(Join) ⫽ the probability of joining a gang.
for the other 571 boys in the sample. Whether or not they joined a gang, the boys in the chronic group tended to have very high estimated probabilities of gang membership compared with the estimates for the other two groups— even the median for the 20 nonjoiners in the chronic group is above the median for the joiners in the low-violence and declining groups, and half of the joiners in the chronic group are quite different from everyone else. These results indicate that the propensity for gang joining in the chronic group is materially higher than in the low-violence and declining groups, particularly for those individuals who actually joined gangs. More important, the results suggest that it would be difficult to find good matches for the gang joiners in the chronic group. This indeed turns out to be the case. All attempts to find good matches for the gang joiners in the chronic group failed dismally. One could try to skirt this problem by running a regression to adjust for the covariate difference between joiners and nonjoiners in the chronic group and hoping for the best. However, for this group, the regression would largely consist of an extrapolation between joiners and nonjoiners whose covariate distributions exhibit limited overlap. It is remarkable how rare it is for an investigator to check whether a covariance adjustment model is an interpolation of
substantially overlapping covariate distributions or an extrapolation of largely nonoverlapping covariate distributions. We concluded that these data do not permit credible estimation of the effect of gang membership for the individuals in the chronic trajectory. Half of these gang joiners were unlike anyone else in the study prior to age 14, and so there is no evidence in the data about what would have happened to individuals like this if they had not joined gangs. This was disappointing, because even though this group consists of only a few individuals, in many ways the chronic group is quite important from a policy and scientific standpoint. Thus, we estimated the violence facilitation effect of gang membership only for the numerous but less violent individuals in the lowviolence and declining groups, which hereafter are also referenced by the indices s ⫽ 1 and s ⫽ 2, respectively. This is a key point: The stratification into trajectory groups provided a natural definition of the subpolulations in which comparable boys may be compared. Although investigators sometimes define the region of overlap on covariates using the propensity score, such a region may lack a clear, substantive interpretation. In contrast, trajectory groups are defined by the outcome under study, and so they form a highly interpretable way to define the region of overlap.
HAVILAND, NAGIN, AND ROSENBAUM
254
Planning the Matching: Conceptual Issues About Efficiency The primary role of matching in observational studies is to remove systematic biases due to imbalances in observed covariates (Cochran, 1965, p. 237). Systematic biases are biases that do not diminish in magnitude as the sample size increases. As a consequence, these biases dominate the mean squared error in large samples. If there is a systematic bias in an estimator due to observed covariates, then, as the sample size increases, the 95% confidence interval becomes shorter, but the short interval is centered around the wrong value. In large samples, systematic bias is all-important: There is no point in having a very stable estimate of the wrong quantity. In practice, of course, one does not want to be wasteful of statistical efficiency. In this section, we discuss conceptually how the number of controls matched to each joiner affects the standard error. The structure of a matched sample strongly affects both bias and variance. Smith (1997) and Ming and Rosenbaum (2000) showed the following two results. 1.
There are substantial gains in bias reduction from discarding some controls, yet there is little loss in efficiency from doing so, provided multiple controls are matched to each joiner.
2.
There are substantial gains in bias reduction from permitting the number of matched controls to vary from one joiner to another, yet there is little loss in efficiency from doing so if the imbalance is not extreme.
To provide a sense of these issues, in the current section, we perform efficiency calculations for one matched set and for two matched sets. In the Appendix, we illustrate precise efficiency calculations in the general case. To clarify efficiency considerations, consider a simple model used in the paired t test (see Rosenbaum & Rubin, 1985; Smith, 1997). There are two measurements in a pair, one treated, one control. The outcome is the sum of three pieces: (a) one pair effect for both individuals in a pair, which creates dependence between their two outcomes; (b) a constant treatment effect for the one treated outcome; and (c) two independent normal residual errors with the same constant residual variance 2. In the paired t test, the pair effects are removed by taking difference scores, each difference score having variance 22, where 2 is the variance of the residuals, not the variance of the outcomes. An alternative but mathematically equivalent model omits the pair effects but allows correlation between the two errors; however, capturing the dependence by a pair effect allows us to investigate the impact of matching with more than one control. Here, the ith gang joiner at age 14 in trajectory group s is matched not to 1 control but to msi controls where msi is greater than or equal to 1. Under the simple model, the outcome is the sum of three pieces: (a) one matched set effect for all msi ⫹ 1 individuals in a matched set, which creates
dependence among their msi ⫹ 1 outcomes; (b) a constant treatment effect for the one treated outcome; and (c) msi ⫹ 1 independent normal residual errors with the same constant residual variance 2. We use this simple model for efficiency calculations in the current section and in the Appendix, but we do not use it for inference in later sections. If one subtracts from the outcome of the ith joiner in trajectory group s the average outcome of msi controls, then this difference has variance 2(1 ⫹ 1/msi), where 2 is the residual variance, not the variance of the outcomes. For example, with a matched pair, msi ⫽ 1, the variance is 2(1 ⫹ 1/1) ⫽ 22 as in the paired t test. Table 2 shows how the variance multiplier, 1 ⫹ 1/msi, changes as the number of controls msi changes. Notice that the multiplier is bounded between 1 and 2: For matched pairs, msi ⫽ 1 and the multiplier is 2, but if each treated participant were matched to infinitely many controls, the multiplier would drop to 1. In fact, using 2 controls rather than 1, msi ⫽ 2, yields a multiplier of 1.5, halfway to msi ⫽ ⬁. The distance is halved again, to 1.25, by using 4 rather than 2 controls. By contrast, the gain from using 10 controls rather than 5 controls is much smaller. The key point here is that if the sample size permits the use of more than 1 control per treated participant, then substantial gains in efficiency are to be had using 2 controls, and meaningful gains in efficiency are achieved from msi ⫽ 4, but for much larger values of msi, the gains are no longer large. Moreover, as theory suggests and as Smith (1997) showed in a case study, it becomes harder and harder to find good matches as msi increases. Use of a large value of msi may yield a biased comparison with a negligible gain in efficiency. Table 2 describes one matched set with one joiner and msi matched controls. Consider, now, two matched sets, where joiner i is matched to msi controls and joiner j is matched to msj controls. The estimate of the treatment effect from these two matched sets is the average of their two treated-minus-averagecontrol differences. That estimate has variance (2/4)[(1 ⫹ 1/msi) ⫹ (1 ⫹ 1/msj)]. For a fixed total number of controls, msi ⫹ msj, the term in brackets is again a variance multiplier, and it is minimized at msi ⫽ msj. Should we therefore insist that these two joiners have the same number of controls, msi ⫽ msj? Perhaps many controls have covariates similar to joiner i but few controls have covariates similar to joiner j. Then we could Table 2 Elementary Efficiency Comparisons With Various Numbers of Controls Matched to Each Treated Participant Variance multiplier 1⫹
1 msi
Controls msi 1
2
3
4
5
10
20
50
⬁
2.00 1.50 1.33 1.25 1.20 1.10 1.05 1.02 1.00
Note. The table displays the multiplier to the variance when a single treated participant is matched to 1, 2, 3, . . . controls. Notice that adding a second control takes the variance multiplier halfway to what would be obtained with infinitely many controls.
PROPENSITY SCORES AND GROUP-BASED TRAJECTORIES
obtain much closer matches if we allowed msi ⬎ msj, but would this greatly increase the variance? Table 3 shows the efficiency in two pairs, i and j, with a total of msi ⫹ msj ⫽ 7 controls shared between them. For instance, in the first column, msi ⫽ 1 and msj ⫽ 6. In Table 3, the variances are fairly stable, especially if both pairs contain at least 2 controls. The worst variance in Table 3, namely 0.79, is only 23% bigger than the best variance, namely 0.65. If both matched sets have at least 2 controls, then the worst in Table 3 is less than 5% higher than the best. In short, the most efficient allocation has msi constant (i.e., the same number of controls for each treated participant), but the efficiency changes only slowly as the msi values are allowed to vary when the total number of controls ⌺imsi is fixed. Ming and Rosenbaum (2000) also showed in theory and in an example that one can achieve much greater bias reduction by allowing the msi to vary. It is easy to see why this is so in the current context. The most violent boys are the ones most likely to join a gang. If a nonviolent boy, say i, joins a gang, then there will be an abundance of similar nonviolent controls available to match to i, so msi should be set somewhat higher. However, if an extremely violent boy, j, joins a gang, there will be comparatively few similar controls available to match to j, so msj should be set somewhat lower. As shown in Table 3, setting msi ⫽ 5 and msj ⫽ 2 would be nearly as efficient as setting msi ⫽ 4 and msj ⫽ 3, but the former would produce better matches given the types of boys who join gangs. Tables 2 and 3 show the cases of one matched set and two matched sets, but the same issues arise with more than two matched sets, as described in the Appendix. Three general principles can be offered: 1.
Having two controls for each participant, msi ⫽ 2, is much more efficient than matched pairs, msi ⫽ 1.
2.
Very large numbers of controls, msi, yield negligible gains in efficiency.
3.
With a given total number of controls, ⌺msi, some variation in the number of controls, msi, does not greatly harm efficiency.
Table 3 Efficiency in Two Pairs With a Total of 7 Controls
冋冉
msi msj msi ⫹ msj
1 4
1 ⫹
冊 冉
1 1 ⫹ 1⫹ msi msj
冊册
1 6 7
2 5 7
3 4 7
4 3 7
5 2 7
6 1 7
0.79 0.68 0.65 0.65 0.68 0.79
Note. The table shows the variance multiplier for the average of two matched sets, with a total of 7 controls shared between them. Notice that an imbalance of 2 ⫹ 5 ⫽ 7 barely raises the variance above the optimal 3 ⫹ 4 ⫽ 7. Unequally matched set sizes do little harm for a fixed total number of controls, providing every set has at least 2 controls.
255
Although we illustrate precise efficiency calculations in the Appendix, a reader would rarely go greatly astray by simply applying the three general principles and the numerical insights in Tables 2 and 3. From Table 1, there are 276/21 ⫽ 13.1 nonjoiners for each joiner in Group 1 and 216/38 ⫽ 5.7 nonjoiners for each joiner in Group 2. After some theoretical calculations described in the Appendix and some preliminary efforts at matching, we decided to match each joiner in Group 1 to between 2 and 7 controls, with an average of 5 controls, and each joiner in Group 2 to between 1 and 6 controls, with an average of 3 controls. The potential controls we did not use were quite unlike the gang joiners prior to age 14, so using those potential controls might substantially bias estimates of effects, with negligible gains in efficiency.
Optimal Matching: Method and Evaluation of Comparability Matching Method: Separate Propensity Scores, Minimum Distance Matching The matching was performed separately within two of the trajectory groups, the low-violence group (s ⫽ 1) and the declining group (s ⫽ 2), using the matching ratios discussed at the end of the previous section. The matching attempted to balance the covariates listed in Table 4. The 12 covariates in Figure 1 are identified by an asterisk in Table 4. We cannot know for certain to which trajectory group a participant belongs, but the trajectory model gives a conditional probability given the data of membership in each group. In addition to the 12 covariates just mentioned, another variable in Table 4 is the estimated conditional probability of being in the declining group given membership in either the low-violence or the declining group. After deciding to omit the chronic group from further analysis, we also decided to estimate a separate propensity score model for each trajectory group. This decision permits different selection mechanisms to operate in these two trajectory groups. Unlike the chronic group, the low-violence and declining groups were large, so separate propensity scores could be estimated for each of these groups. The propensity score was estimated using a logit model to predict whether a participant would join a gang at age 14 from the other covariates in Table 4, and the logit of the propensity score is used in most calculations. For low-violence and declining trajectory groups together, the mean of each covariate X at age 14 for the 59 joiners is MXt, where t denotes the treated group. The mean for the 492 potential controls is MXp, where p denotes the potential control group. Generally, the gang joiners were more violent than potential controls at ages 10, 11, 12 and 13; were less popular with their peers; had higher posterior probabilities of membership in the declining trajectory group; and of course had higher propensity scores.
HAVILAND, NAGIN, AND ROSENBAUM
256
Table 4 Covariate Imbalance Before and After Matching for 15 Covariates and 7 Missing Value Indicators Covariate
dX
dXm
Logit Propensity Score 1 Logit Propensity Score 2 Peer-rated popularity, Age 11* Pr (Low兩Low or Declining) Violence, Age 11* Mother’s age at first birth* Peer-rated aggression, Age 11* Violence, Age 10* Violence, Age 12* Teacher rating of hyperactivity, Age 11* Violence, Age 13* Number of Sexual Partners, Age 13* Teacher rating of opposition, Age 11* Intelligence score* Teacher rating of physical aggression, Age 11* Number of sexual partners missing Intelligence score missing Physical aggression missing Violence age 13 missing Mother’s age missing Popularity missing Aggression rating missing M Maximum
0.96 0.79 0.47 0.38 0.26 0.26 0.25 0.24 0.23 0.22 0.21 0.21 0.19 0.07 0.03 0.27 0.16 0.15 0.14 0.13 0.09 0.09 0.26 0.96
0.21 0.18 0.18 0.02 0.04 0.11 0.05 0.02 0.03 0.09 0.02 0.06 0.20 0.22 0.20 0.15 0.06 0.15 0.11 0.17 0.02 0.02 0.10 0.22
Note. Absolute standardized difference in covariate means, before and after matching. Covariates are presented in order by the standardized bias before matching. The mean and maximum of the 22 ⫽ 15 ⫹ 7 absolute standardized differences appear at the foot of the table. Asterisks identify the covariates that are displayed in Figure 1.
Some of the covariates in the upper portion of Table 4 had missing values, and their associated missing value indicators are listed in the lower portion of Table 4. For instance, the covariate number of sexual partners was missing for 5% of joiners and 1% of potential controls. By refusing to respond to a question, a boy may reveal something about himself. The fact that a boy did not respond is observable; what the boy would have said had he responded is not. A convenient feature of matching on propensity scores is that it can incorporate and thereby adjust for the refusal to respond. If one includes missing value indicators as variables in the model for the propensity score, as we did,7 then the propensity score tends to balance the observed values of the covariates and the pattern of missing value indicators (see the appendix of Rosenbaum & Rubin, 1984). In contrast, the propensity score cannot be expected to balance the unobserved covariate values themselves. For instance, the propensity score would tend to balance the observed values of number of sexual partners and the frequency of missing values, but it cannot be expected to balance the missing response to the query about the number of sexual partners.
Within each trajectory group, we defined a distance between each joiner and each potential control. The distance had two components. First, the distance was the Mahalanobis distance computed from the covariates in Table 4, including the relevant group’s logit propensity score but excluding the missing value indicators. The Mahalanobis distance is analogous to the sum of squared differences in values of the several covariates, but it makes allowances for unequal variances and for covariances among the covariates (Rubin, 1980). Second, if two individuals differed on their logits of the propensity score by more than 0.2 times the standard deviation of the logit of the propensity score, then a large penalty was added to this distance, specifically, a penalty of 200. The value of 200 was chosen because it is vastly larger than any of the Mahalanobis distances. Large penalties are a standard device for effectively constraining an optimization problem without formally introducing constraints. Penalties are sometimes easier to implement computationally, as is true here. Specifically, if the constraint makes the optimization problem infeasible, then the use of penalties will permit small violations of the constraints. In this study, all but 7 of the 219 actual matches avoided the penalty and thereby respected the constraint.
Software Options: R or SAS We define ns as the number of treated participants in trajectory group s, s ⫽ 1, . . . , S, so that n⫹ ⫽ ⌺ns is the total number of treated participants in all groups to be matched. In the example, S ⫽ 2, and n1 ⫽ 21 and n2 ⫽ 38, so n⫹ ⫽ 59 is the total number of gang joiners. We selected the controls to minimize the total of the distances, that is, of the total of the m1⫹ ⫽ 105 distances in the low-violence group and the total of the m2⫹ ⫽ 114 distances in the declining group. This is a combinatorial optimization problem (Gu & Rosenbaum, 1993; 7
We used the approach suggested by Rosenbaum and Rubin (1984, appendix) in estimating propensity scores with missing values of some covariates. In that approach, the “missingness” of a covariate is itself taken as information useful in predicting treatment assignment, so it belongs in the propensity score. In this sense, missing data play a different role in propensity scores than in, say, regression to predict an outcome like violence. If a covariate had a substantial number of missing values, we included it in the propensity score as two variables, the observed covariate itself and a separate binary indicator, 1 ⫽ missing, 0 ⫽ not missing. When a missing value indicator is included along with a covariate as predictors in a logit model, the fitted propensity scores are unaffected by the numerical values used in place of missing values in the covariate, because the fitted coefficients adjust to compensate; we used the covariate’s mean. Although this mean substitution does not affect the propensity scores themselves, it does have a small effect on the Mahalanobis distance described below, and we excluded missing values when evaluating covariate balance, so this use of the mean does not affect balance measures.
PROPENSITY SCORES AND GROUP-BASED TRAJECTORIES
Rosenbaum, 1989, 1991a). It is not an elementary optimization problem because one control may be the closest control to two different joiners, so the joiners are in competition with each other for the best controls. We define ms⫹ ⫽ ⌺ns i⫽1 msi as the number of matched controls in a specific trajectory group s, s ⫽ 1, 2, in our example. There are several practical ways to solve the optimization problem within standard statistical packages. The input to all such packages is a matrix of distances, here Mahalanobis distances plus some penalties. In this matrix, the treated participants are the rows and potential controls are the columns. Hansen’s (2004) optmatch package performs optimal matching in R and is available free with R. The popular statistical software package R is available free from http://www.r-project.org/. After installing and starting R, to obtain the optmatch package, go to the Packages menu in R, choose the Load package feature, select optmatch from the list of packages, type library(optmatch) at the R command prompt, and type help(fullmatch) for instructions. Hansen’s optmatch package is the fastest matching package. It uses the auction algorithm developed by Bertsekas (1981). The fullmatch command of the optmatch package returns an optimal match when supplied with a distance matrix and minimum (␣s) and maximum (s) matched set sizes, such as (␣1, 1) ⫽ (2, 7) or (␣2, 2) ⫽ (1, 6) as defined in the Appendix. These choices of (␣s, s) were found in the Appendix to provide very good efficiency, yet they also permitted adequate bias reduction. (Alternatively, Hansen’s R code is also available from his Web page, http://www .stat.lsa.umich.edu/⬃bbh/. Fortran code for Bertsekas’s algorithm is available at his Web page, http://web.mit.edu/ dimitrib/www/auction.txt.) The OR (operations researchers) module in SAS has a routine, Proc Assign, which can also perform optimal matching with variable numbers of controls. Proc Assign is designed to do pair matching, with one joiner matched to one control. Ming and Rosenbaum (2001) proposed a technique so that Proc Assign and other assignment algorithms can be used to match treated participants to variable numbers of controls. This approach involves recoding the distance matrix, making it larger, so if a joiner can have four controls, then that joiner appears as four rows of the distance matrix, and some additional pseudo-control columns are added to remove extras. Use of Proc Assign is a reasonable alternative for individuals who prefer programming in SAS to R. Bergstralh, Kosanke, and Jacobsen (1996) also provide a macro to aid SAS users, which calls Proc Netflow rather than Proc Assign. In R, the function mahalanobis will compute the Mahalanobis distance between one treated participant and all of the controls, so calling the function once for each treated participant produces a matrix of Mahalanobis distances for matching. Penalties may be added to some of these distances to impose constraints on the matching. Software options for estimating the trajectory groups include
257
a SAS procedure called Proc Traj (Jones & Nagin, 2007; Jones, Nagin, & Roeder, 2001) and two general purpose, stand-alone packages, Mplus (http://www.statmodel.com) and Latent Gold (http://www.latentclass.com).
Comparability Before Treatment: Covariate Balance Before and After Matching When conducting an experiment, researchers create treated and control groups that were comparable before treatment in an effort to discern the effects caused by the treatment. As just noted, before joining a gang at age 14, the gang joiners were very different from the boys who did not join gangs at age 14. Was matching successful in producing matched sets of joiners and controls who were comparable prior to age 14 with respect to the covariates in Table 4? In this section, the matched sample is evaluated in terms of comparability or covariate balance. The measures of balance are simple and traditional, and they have been in use for some time (e.g., Rosenbaum & Rubin, 1985). For any one covariate X, MXt and MXp are the means and sXt and sXc are the standard deviations of X for all 59 joiners and all 492 potential controls, respectively, before stratification and matching. We also compute an overall standard deviation, 2 2 sX ⫽ 冑共sXt ⫹ sXc 兲/2, the square root of the equally weighted average of the two variances for 59 joiners and 492 potential controls. Because we use every joiner, matching does not alter the mean MXt of X for joiners. Each treated participant or gang joiner i in stratum s is matched to msi controls, j ⫽ 1, . . . , msi. The values of a covariate X have a subscript t or c for treated or control group, a subscript s for the stratum, a subscript i to identify the treated participant, and a subscript j for controls to distinguish the msi controls matched to treated participant i. Thus, treated participant i in stratum s has value Xtsi of the covariate, and the msi controls matched to this treated participant have values of the covariate Xcsij, j ⫽ 1, . . . , msi. Denote by Mcsi 䡠 the mean of the msi values of the covariate X for the controls matched to treated participant i, and denote by MXc the unweighted mean of these means, that is, 1 M csi . ⫽ m si
冘 msi
j⫽1
冘冘 S
n
s 1 X csij and MXc ⫽ M . n⫹ s⫽1 i⫽1 csi
(1)
One hopes to see covariate balance after matching, specifically, that Xtsi ⫺ Mcsi . is centered near zero or that MXt ⫺ MXc is near zero. Table 4 reports two absolute standardized measures similar to Cohen’s d. One standardized measure, dX, contrasts covariate values for treated participants with covariate values of all of the potential controls. The other standardized measure, dXm, contrasts covariate values X for treated participants with the covariate values of all of the matched controls. Recall that MXp is the mean of X for all potential controls, and MXc is defined in Equation 1 for matched controls. Then dX and dXm are given by
HAVILAND, NAGIN, AND ROSENBAUM
258 dX ⫽
兩M Xt ⫺ M Xp兩 兩MXt ⫺ MXc 兩 and dXm ⫽ , sX sX
in which the denominators are the same. Because the denominators of dX and dXm are the same, a comparison of dX and dXm shows the extent to which matching has made the means closer. Aside from the missing value indicators, the covariates in Table 4 are sorted by the standardized bias dX before matching. Because the two propensity scores were defined separately in the two trajectory groups, the various measures for them are calculated only from individuals in the relevant trajectory group. Before matching, the treated and control groups are almost a full standard deviation apart on the propensity score, almost half a standard deviation apart on peerrated popularity, almost 40% of a standard deviation apart on the posterior probability of membership in the declining trajectory group, and roughly 25% of a standard deviation apart on violence at ages 10, 11, 12, and 13. For most covariates in Table 4, the balance improved after matching, particularly when the bias before matching was substantial. In Table 4, the standardized bias after matching is less than 5% of a standard devia-
tion for violence scores at ages 10, 11, 12, and 13. As we have previously argued, balance on prior violence levels between gang joiners and their matched controls is particularly important when generating a credible estimate of the violence facilitation effect of gang membership. Thus, we are heartened that matching resulted in near perfect balance on these covariates. Also, we particularly note that matching on trajectory groups in addition to propensity scores has produced excellent balance on violence scores. Haviland and Nagin (2007) empirically examined the contribution of matching inside trajectory groups and found the contribution to be substantial. Figure 3 depicts the covariates themselves, before and after matching, for the four covariates in Table 4 with the largest standardized biases before matching. Note that before matching, the distribution of each of these covariates across the non– gang members differs appreciably from that of the gang members. In contrast, after matching and stratifying by trajectory group, the distributions for the gang and non– gang member are very similar. These results are another encouraging sign that the matching had substantial success in bringing into balance
Peer Rated Popularity
1 0
Popularity
-2
-1
0.6 0.4 0.2
-3
0.0
Propensity Score
0.8
2
3
1.0
Propensity Score
Joiners
Matched
Unmatched
Joiners
10 2
4
Violence
6
8
0.8 0.6 0.4 0.2
0
0.0
Probability
Unmatched
Violence Age 11
1.0
Prob(Group 2 | 1 or 2)
Matched
Joiners
Matched
Unmatched
Joiners
Matched
Unmatched
Figure 3. Boxplots of the four covariates with the largest initial bias: group-specific propensity scores, peer-rated popularity, conditional probability of trajectory group s ⫽ 2 given groups s ⫽ 1 or s ⫽ 2, and violence at age 11. Prob ⫽ probability.
PROPENSITY SCORES AND GROUP-BASED TRAJECTORIES
Matched Controls
Joiners
Matched Controls
10 8 0
2
4
Violence
6
8 0
2
4
Violence
6
8 0
2
4
Violence
6
8 6 Violence 4 2 0
Joiners
Age 17
10
Age 16
10
Age 15
10
Age 14
259
Joiners
Matched Controls
Joiners
Matched Controls
Figure 4. Boxplots of violence outcomes: Violence scores from ages 14 to 17 for 59 gang joiners at Age 14 and 219 matched controls.
covariates that in the unmatched data were substantially out of balance.8 Although the missing value indicators at the bottom of Table 4 also show improved balance overall, much of this occurred in the low-violence group, where there was more freedom to pick controls. There was little improvement in the missing indicators in the declining group, in part because the Mahalanobis distance emphasized the actual covariates and the missing indicators were included only indirectly through the propensity score.
Analysis of Outcomes of Treatment Direct Analysis of Outcomes: Violence and Change in Violence, Ages 14 to 17 Did the treatment affect the outcomes? Are gang joiners more violent? The matching produced 59 matched sets, each comprising 1 boy who joined a gang at age 14 matched to 1 or
more similar boys who did not join gangs at age 14. How violent were these boys between ages 14 and 17? Figure 4 8
As a methodological aside, the boxplots for the 59 joiners and the 273 unmatched controls in Figure 3 are conventional boxplots. A joiner might be matched to between 1 and 7 controls, but an appropriate, directly adjusted analysis gives equal weight to the 59 joiners. Therefore, for each covariate, we created a weighted empirical distribution for the matched controls. In the weighted distribution, if a joiner had 1 matched control, then that control received Weight 1, but if the joiner had 2 matched controls, then each one received Weight 1/2, and so on, up to 7 matched controls, each with Weight 1/7. The expectation of this weighted empirical distribution is MXc in Equation 1, as displayed in Table 4. Alternatively, if one computed MXc in Equation 1 not from the covariate Xcsij itself but rather from the binary variable indicating whether Xcsij ⱕ x, then the result is the weighted empirical distribution evaluated at x. In Figure 3 and in several later boxplots, the quartiles for matched controls are computed from this weighted empirical distribution.
HAVILAND, NAGIN, AND ROSENBAUM
260
Table 5 Comparison of Levels of Violence and Changes in Violence Among Gang Joiners at Age 14 Years and Matched Controls Age (years)
No. of sets
Level of violence: p value
10 11 12 13 M 10 to 13
59 57 58 57 59
.488 .671 .209 .600 .631
14 15 16 17 M 14 to 17
59 53 48 50 59
.0017 .0089 .411 .556 .015
Change in violence: p value
95% confidence interval for level of violence
Covariate
Outcome .0074 .0159 .509 .606 .023
0.25, 1.00 0.14, 1.16 ⫺0.25, 0.63 ⫺0.30, 0.51 0.08, 0.79
Note. Two-sided significance levels from the Hodges–Lehmann aligned rank test, testing no effect on the level or the change in violence. Violence measures at ages 10 –13 are pretreatment covariates; they address the comparability of joiners and controls at baseline. Change in violence is the difference between violence at ages 14, 15, 16, or 17 and the mean violence for ages 10 to 13. The confidence interval is for the effect on the level of violence.
depicts boxplots of the violence scores for the 59 gang joiners at age 14 for ages 14 –17. Also shown are the weighted empirical distributions for matched controls, defined in footnote 8, at ages 14, 15, 16, and 17. For the sample as a whole, the plots suggest a pronounced upward shift in violence at ages 14 and 15. By age 16, the differences between the gang joiners at age 14 and their matched controls seem to have largely dissipated. Could these differences be due to chance? We obtained confidence intervals by inverting the standard nonparametric test for matched sets. With matched pairs rather than matched sets, a common statistical test of no treatment effect is Wilcoxon’s signed-ranks test. Wilcoxon’s test is more than 95% efficient with normal data and much more efficient than the t test with outliers or long-tailed distributions (see Lehmann, 1998). The extension of the signedranks test to matching with multiple controls is the aligned rank test of Hodges and Lehmann (1962), which is described in detail in Lehmann’s (1998, pp. 138 –141) textbook. This test centers each matched set by subtracting its mean from each outcome, then ranks these aligned outcomes over all sets and sums the ranks for the treated participants.9 The aligned rank test was used to test the null hypothesis of no difference in a comparison of the level of violence for the joiner in a set matched to the levels of violence of several controls. Table 5 displays the results for the sample as whole. Prior to age 14, when none of the boys were in gangs, there is not a significant difference in level of violence among the boys who would join at age 14 and their matched controls. After age 14, two outcomes are examined: (a) the level of violence at a given age and (b) the
change in the level of violence at a given age when compared with the average for this boy from ages 10 to 13. For the
9 Calculating the aligned rank statistic involves two steps, aligning within the matched sets and ranking across matched sets. In alignment, the mean of the 1 ⫹ msi responses in matched set si is subtracted from each of the 1 ⫹ msi observations in set si, so every matched set now has mean zero. These ⌺(1 ⫹ msi) aligned responses are then ranked from 1 to ⌺(1 ⫹ msi), and the sum of the ranks for the joiners is the aligned rank statistic. As shown in Hodges and Lehmann (1962) and Lehmann (1998), it is the natural generalization of Wilcoxon’s signed-ranks test when msi ⬎ 1 for some si. Instead of testing no effect, one can test the hypothesis that the there is an additive effect, say H0: ⫽ 0, where is the unknown additive increase in, say, violence due to joining a gang at age 14, and 0 is a specific number. To test H0: ⫽ 0, subtract 0 from the violence score of each joiner and then apply the aligned rank test of no effect to these adjusted responses. A nonparametric test can be inverted to yield both a confidence interval and a point estimate; see Lehmann (1998), Noether (1985), or Hollander and Wolfe (1999) for discussion. A confidence interval for is formed by inverting the hypothesis test; that is, the two-sided 95% confidence interval is the set of 0 not rejected by the test at the two-sided .05-level aligned rank test. The value ˆ of that yields a two-sided p value of 1.00 is known as the Hodges–Lehmann (Hodges & Lehmann, 1963) point estimate. With matched pairs, if the paired t test were inverted in this way, it would yield the usual confidence interval for the t test and the Hodges–Lehmann estimate would be the sample mean difference. Rosner (1982) proposed an extension of the t test to matching with multiple controls, but it is not robust and is less commonly used than the aligned rank test.
PROPENSITY SCORES AND GROUP-BASED TRAJECTORIES
sample as a whole, at ages 14 and 15, the joiners at age 14 were significantly more violent than their matched controls, and the changes in their violence from baseline were significantly greater than the changes for their matched controls. In contrast, at ages 16 and 17, these differences between joiners at age 14 and their matched controls were not significant. In Table 5, a 95% confidence interval for an additive effect of gang joining at age 14 on the subsequent level of violence is obtained by inverting the aligned rank test.10 Do the effects of the treatment differ by trajectory group? Table 6 displays the results by trajectory group. Specifically, Table 6 reports inferences about the effects of joining a gang at age 14 on the level of violence at subsequent ages, shown separately for the low-violence (s ⫽ 1) and declining (s ⫽ 2) trajectory groups, again using the Hodges–Lehmann aligned rank test.11 The patterns in Table 6 are intriguing, but the sample sizes within groups are small—there are only 21 joiners in the low-violence group—and so definitive statements about treatment effects are not possible.
Persistence of the Treatment: Gang Membership, Ages 14 to 17 How persistent is the treatment? Do joiners stay in gangs? Do controls stay out of gangs? Tables 7 and 8 describe these changes in gang membership over time, ages 14 to 17.12 By definition, the joiners are all in gangs at age 14 and the controls are not. A year later, as shown in Table 7, only 39% of the joiners are still in gangs, whereas 10% of the controls have joined gangs. By age 17, only 20% of the joiners at age 14 are still in gangs, and 16% of their matched controls are
Table 6 Violence Outcomes Within Trajectory Groups Age (years) and group
p
95% CI
14 Low (s ⫽ 1) Declining (s ⫽ 2)
.008 .033
0.16, 1.13 0.04, 1.21
.034 .086
0.00, 1.40 0.00, 1.41
.044 .753
0.00, 1.16 ⫺0.88, 0.57
.070 .520
0.00, 1.58 ⫺0.95, 0.33
15 Low (s ⫽ 1) Declining (s ⫽ 2) 16 Low (s ⫽ 1) Declining (s ⫽ 2) 17 Low (s ⫽ 1) Declining (s ⫽ 2)
Note. The outcome is the level of violence at specific ages. The table shows a comparison of 21 joiners and 105 matched controls in the lowviolence trajectory group and 38 joiners and 114 matched controls in the declining trajectory group using the aligned rank test. Two-sided signficance levels for testing no effect and 95% confidence intervals (CI) for an additive effect were formed by inverting the test. For certain technical issues, see footnote 11.
261
now in gangs. These frequencies at age 17 do not differ significantly using the Mantel–Haenszel test for binary outcomes in multiply matched sets. (See Fleiss, Levin, & Paik, 2003, p. 250, for discussion of the Mantel–Haenszel test.) Does the persistence of the treatment vary by trajectory group? Table 8 describes the changes in gang membership separately in the two trajectory groups. The immediate decline in gang membership at age 15 is greater in the low-violence group than in the declining group, but 25% of joiners in the low-violence group are in gangs at age 17, as opposed to 17% in the declining group; however, this difference is not statistically significant by Fisher’s exact test.13 Also, fewer controls subsequently join gangs in the low-violence group than in the declining group. In principle, differences in the persistence in gang membership across 10
Rubin’s (1979) simulations found that regression adjustments of matched samples were more robust to model misspecification than regression alone but were sometimes more efficient than matching alone. To see if that was true here, we applied the method of covariance adjustment in Rosenbaum (2002a, §7), in which the aligned rank test is applied to residuals from a robust regression of violence on the 12 covariates in Table 4 marked with an asterisk. The specific method of robust estimation was m-estimation with the Splus default settings. For an additive effect on the level of violence at age 14, the covariance adjustment yielded a 95% confidence interval of 0.25, 1.02; at age 15, the 95% confidence interval was 0.12, 1.14; for the average level of violence for ages 14 to 17, the interval was 0.02, 0.76, similar to the values found in Table 5. In this particular instance, matching alone, without covariance adjustment, seems to have adequately controlled for the covariates. 11 The reader will note that several confidence intervals end exactly at zero. Many boys had a violence score of zero in at least 1 year. As a rank statistic, the aligned rank statistic takes discrete steps as the parameter being tested is varied, which explains, for instance, the significance level of .034 in the low-violence group at age 15 together with a confidence interval of 0.00, 1.40, which ends sharply at zero. This says that an additive effect of zero is not plausible and is rejected as too small at the .034 level but that any positive effect is not rejected at the .05 level. Similarly, in the declining-trajectory group at age 15, a zero effect is not rejected at the .05 level, because the significance level is .086, but any negative effect is rejected at the .05 level. In observational studies, a robust confidence interval that avoids the discontinuity of the aligned rank test may be based on m-tests and m-estimates; see Rosenbaum (2007). 12 In these tables, the percentages for controls are found by averaging over the controls matched to each joiner and averaging those averages, in parallel with the definition of MXc. 13 In detail, the low-violence group had 20 matched sets with violence data on both a 14-year-old joiner and a 14-year-old control, and in 25%, or 5/20, of these sets, the joiner was in a gang at age 17, so in the low-violence group, each joiner is 5% of the group, whereas for the declining group, the ratio was 17%, or 5/30, and the two-sided p value from Fisher’s exact test was .49.
HAVILAND, NAGIN, AND ROSENBAUM
262
Table 7 Gang Membership at Ages 14 to 17 for Joiners at Age 14 and Matched Controls Age (years) Gang status at age 14
14
Joiners in gangs (%) Matched controls in gangs (%) Mantel–Haenszel p value Matched sets
100 0 59
15
16
17
39
25
20
10 ⬍.001 56
11 .027 48
16 .42 50
Note. The percentage for controls is a direct adjustment, that is, the average over matched sets of the average gang membership among controls in each set. Two-sided p values are derived from the Mantel–Haenszel test without continuity correction.
the groups might account for differences in the persistence of the violence facilitation effect across groups, but neither difference was statistically significant. Again, caution should be exercised in interpreting these results given the small numbers of gang joiners within each trajectory group.
Treatment Integrity Analysis: The Violence of Boys Who Remain in Gangs Does the degree of persistence in the treatment determine the effectiveness of the treatment? What is the effect of remaining in a gang, as opposed to joining one? Table 7 describes an important but common event in longitudinal experiments and observational studies. As time passes, the integrity of the treated and control groups degrades as participants enter and leave the groups. In the language of randomized clinical trials, Table 7 displays noncompliance, that is, the tendency over time for those who joined gangs at age 14 to quit and for matched controls to join gangs. The noncompliance analysis for randomized experiments in Greevy, Silber, Cnaan, and Rosenbaum (2004) uses the randomly assigned treatment as an instrument for the received treatment. This analysis gives appropriate inferences providing the assignment is randomized, even if noncompliance is nonrandom and biased (see also Imbens & Rosenbaum, 2005). In a randomized experiment, the initial random assignment to treatment or control group is untainted by self-selection bias. Unfortunately, it is often true that the effect of the treatment is determined by the treatment received, not the treatment assigned, and the treatment received may be affected by self-selection bias. The noncompliance analysis in Greevy et al. is directed at this situation. Applying the noncompliance analysis to the current context in which randomization was not used would mean that if the matching had in fact matched comparable joiners and controls at age 14, then the noncompliance analysis would be appropriate even if later decisions to exit or enter gangs were nonrandom. For instance, it would not be surprising if subsequent violence, inside or outside of gangs, was related
to gang exit or entry, but this would not invalidate the instrumental variable analysis. Were gang joiners and matched controls actually comparable at age 14? Table 4 suggests than joiners and matched controls were comparable in terms of the covariates in that table, but whether they are also comparable in terms of unmeasured covariates is a matter of speculation. We applied the treatment integrity (or noncompliance) analysis from Greevy et al. (2004) in the following way. As in that article, we defined an indicator of gang membership at age a, for a ⫽ 14, 15, 16, 17, using exponential smoothing. Exponential smoothing creates a current status at each age that reflects the degree of persistence in gangs up to the current time, giving greatest weight to the recent past. We define an indicator variable Gia ⫽ 1 if boy i was in a gang at age a, Gia ⫽ 0 otherwise. Then at age a ⫽ 14, Gi,14 ⫽ 1 for joiners and Gi,14 ⫽ 0 for controls, but for a ⬎ 14, there is some switching, as indicated in Table 7. We now define ˜ i,14 ⫽ Gi,14 for age our smoothed persistence in gangs as G ˜ i,a ⫽ ␣Gi,a ⫹ (1 ⫺ ␣)G ˜ i,a ⫺1 for ages greater than 14 and G ˜ i,a defined to be 14, specifically a ⫽ 15, 16, 17, with G ˜ i,a⫺1 is missing. The investigator missing if either Gi,a or G chooses the decay parameter ␣, which must satisfy 0 ⱕ ␣ ⱕ 1, with higher values of ␣ representing more rapid decay. If ˜ i,a ⫽ Gi,a simply indicates whether a boy is in ␣ ⫽ 1, then G a gang at age a; this is the transient model of treatment effect, because only current gang membership matters for ˜ i,a ⫽ Gi,14 simply indicates violence. If ␣ ⫽ 0, then G whether a boy joined a gang at age 14; this is the permanent model, because treatment effects at age 14 are modeled as lasting until age 17. The permanent model turns out to be implausible in the example, as suggested by Table 5. If 0 ⬍ ␣ ⬍ 1, then past gang membership is modeled as exerting diminishing influence as the years pass. For instance, with ␣ ⫽ 1/2, a boy who was in a gang for the first 2 years, ˜ i,14 ⫽ 1, Gi,14 ⫽ 1, Gi,15 ⫽ 1, Gi,16 ⫽ 0, Gi,17 ⫽ 0, has G ˜ i,15 ⫽ 1, G ˜ i,16 ⫽ 1/2, G ˜ i,17 ⫽ 1/4. We call the model with G ␣ ⫽ 1/2 the lingering model. In each model, the effect of
Table 8 Gang Membership at Ages 14 to 17 for Joiners at Age 14 and Matched Controls, by Trajectory Group Age (years) Participants
14
15
16
17
Low-violence trajectory group Joiners at age 14 in gangs (%) 100 29 Matched controls in gangs (%) 0 12
17 5
25 9
Declining trajectory group Joiners at age 14 in gangs (%) 100 46 Matched controls in gangs (%) 0 8
30 15
17 20
Note. The percentages for controls are directly adjusted, as in Table 6: Each value is the average over joiners of the percentage of that joiner’s controls who are in gangs.
PROPENSITY SCORES AND GROUP-BASED TRAJECTORIES
joining a gang at age 14 on violence at age a is modeled as ˜ i,a. In the lingering model, the hypothetical boy just G described would have increments in violence at ages 14, 15, 16, and 17 of, respectively, , , /2, and /4. Notice that the value of ␣ does not matter when there is no effect,  ⫽ 0, so tests of no effect yield the same answer for all ␣. For each ␣, we obtain point estimates and 95% confidence intervals for  by inverting the aligned rank test.14 For all ␣, when testing no effect of gang membership, H0:  ⫽ 0, this gives the .015 significance level in Table 5 for the average level of violence, ages 14 to 17. Table 9 shows the point estimate of  under each model, together with the 95% confidence interval. On the basis of the pattern seen in Table 5, the permanent model with ␣ ⫽ 0 does not look plausible: The difference in violence between joiners at age 14 and matched controls seems to diminish with increasing age, yet this model views them as permanent. Plots of residuals (not shown) from the three noncompliance models, as in Greevy et al. (2004), also suggest that the permanent effect model, ␣ ⫽ 0, provides an inferior fit when compared with the lingering (␣ ⫽ 1/2) or transient (␣ ⫽ 0) models, the residuals of which exhibit little pattern. In a much larger study, we would explore whether these results differed by trajectory group. However, in the current study, the group-specific confidence intervals for ages 15 to 17 in Table 6 all include zero effect, consistent with the null hypothesis of no effect of gang membership.
Sensitivity to Bias From an Unobserved Covariate This is not a randomized experiment, so some of the comparisons could be biased. How sensitive are conclusions to potential biases of various magnitudes? The analysis above suggests that the matching was quite successful in balancing the measured covariates in Table 4, but there is the inevitable concern that some important covariate may not have been measured. The analysis in Table 5 would be correct in a randomized experiment in which one boy in each matched set was picked at random for treatment, but this analysis would not be correct if an important unmeasured covariate had not been controlled by matching. Here, we ask how such an unobserved covariate might alter the
analysis in Table 5. Brief nontechnical introductions to sensitivity analysis are found in Rosenbaum (1991b, 2005b), with abundant details in Rosenbaum (2002b). The method used here is described in detail in Gastwirth, Krieger, and Rosenbaum (2000), so only a brief description is given here. Suppose that an unobserved binary covariate that takes values u ⫽ 1 or u ⫽ 0 was associated with a ⌫ ⱖ 1–fold increase in the odds of joining a gang at age 14. In other words, within a matched set, a boy with u ⫽ 1 might be ⌫ times more likely to join a gang than another boy with u ⫽ 0. What is the largest possible one-sided significance level for the aligned rank test allowing for the impact of a failure to control for the unobserved covariate u? Table 10 gives the upper bound on the one-sided significance levels for no effect, testing against increased violence among gang joiners, for several values of ⌫. In an experiment, randomization ensures ⌫ ⫽ 1, so that one would obtain the analysis in Table 5.15 The bounds on significance levels in Table 10 are sharp bounds, not conservative bounds, in the sense that there exists some unobserved covariate strongly related to violence at the given age that would yield these significance levels. The increase in violence at age 14 is insensitive to a 50% increase in the odds of joining a gang (⌫ ⫽ 1.5) associated with u ⫽ 1, as the maximum possible significance level of .036 is still less than the conventional .05. A slightly larger bias (⌫ ⫽ 1.6) could just barely explain the association between gang joining and gang violence, in the specific sense that that the effect may no longer be significant at the conventional .05 level. The results at age 15 are more sensitive to unobserved bias than the results at age 14. In this study, the ostensible effect of gang joining on violence at age 14 is not sensitive to small biases but is sensitive to biases of moderate size.
Concluding Remarks We began this article with the observation that a key aim of empirical research in developmental psychopathology and life course studies is measuring the effects of therapeutic interventions or important life events on behavioral trajectories. We also observed that the use of experimental As in Greevy et al. (2004), to test H0:  ⫽ 0, we subtracted ˜ i,a from violence at age a; averaged all of these adjusted values 0G for each boy over ages a ⫽ 14, 15, 16, 17; and applied the aligned rank test to these adjusted averages, comparing joiners at 14 with their matched controls (see Greevy et al., 2004, for detailed discussion and references to earlier work). The confidence interval is the set of hypotheses not rejected in a two-sided, .05-level test, and the point estimate is the Hodges–Lehmann (Hodges & Lehmann, 1963) estimate. 15 For technical reasons, the sensitivity analysis is best viewed as one sided. If one doubles the values for ⌫ ⫽ 1 in Table 10, one obtains the corresponding two-sided significance levels in Table 5. 14
Table 9 Effects of Gang Membership on Level of Violence Under Three Noncompliance Models Model
␣
ˆ
95% CI
Transient Lingering Permanent
1
1.10 0.77 0.46
0.29, 1.86 0.20, 1.31 0.11, 0.81
1 2
0
Note. As noted in the text, the permanent model fits poorly, whereas the transient and lingering models appear to fit equally well and produce qualitatively similar estimates of effect. CI ⫽ confidence interval.
263
HAVILAND, NAGIN, AND ROSENBAUM
264
Table 10 Sensitivity to Unobserved Biases: Sharp Upper Bounds on the One-Sided p Value for Testing No Effect on Level of Violence at Ages 14 and 15 ⌫
Age 14
Age 15
1.0 1.3 1.4 1.5 1.6 1.7
.00084 .012 .021 .036 .056 .082
.0045 .037 .059 .088 .124 .166
Note. No bias of magnitude ⌫ ⫽ 1.5 can produce a p value above .036 for violence at age 14, but a bias of ⌫ ⫽ 1.5 could produce a p value of .056 ⬎ .05. Small unobserved biases cannot explain the observed association between gang joining and violence, but moderately large biases could explain it.
control to infer these effects was often impractical or unethical. In this article, we presented an approach for inferring such effects from observational data that attempts to recreate some key ingredients of a well-designed randomized experiment. The approach we have taken has certain strengths and limitations that have been mentioned intermittently but are summarized here.
Transparency As in an experiment, we compared ostensibly comparable participants under alternative treatments. In the example, we compared boys who appeared similar at age 14, some of whom joined gangs at age 14, and compared their outcomes over ages 14 to 17. We had multiple baseline measures of the violence outcomes over time, and we used three groups to distinguish boys whose levels and trends of violence were different before age 14. Although any statistical analysis has technical aspects, the main findings were already apparent in simple boxplots and tables of percentages: (a) Figure 1 showed the joiners and nonjoiners were very different prior to age 14 before matching; (b) Figure 3 and Table 4 showed the matched joiners and controls were similar prior to age 14; (c) Figure 4 depicted the short-lived increase in violence for joiners over ages 14 to 17; (d) Table 7 showed gang membership to be highly transient for most boys. Cox (1958) wrote that in an experiment, “simplicity . . . is a very important matter which must be constantly borne in mind” (p. 11). With a little effort, our analysis recovered in an observational study much of the simplicity found in a good experiment.
Weaknesses Open to View Perhaps paradoxically, a key strength of our analysis is that its most important weaknesses are straightforwardly open to public view and to critical discussion, and these weaknesses can be appreciated without technical tools or
terminology. Our focus on comparing comparable boys under alternative treatments and our demonstration that the boys were comparable in terms of the measured covariates immediately call attention to the most important weakness, namely, the possibility that boys differed prior to age 14 in important ways that we did not adequately measure. This weakness is certainly possible, perhaps likely, and it was examined in a sensitivity analysis, which found that small omissions would not alter conclusions but that the omission of a moderately important covariate could alter conclusions. Claims of comparability before treatment and diverging outcomes after treatment are open to critical discussion from widely varied perspectives. For instance, such claims are sometimes enriched or corrected with the aid of ethnographic techniques applied to matched individuals, such as in Rosenbaum and Silber, 2001. In that example, quantitative data from Medicare were used to form matched pairs, and for a few pairs, hospital charts were examined and described in a narrative fashion, so gaps in the Medicare data became clearer. Another weakness open to view in the present study is that we were unable to find comparable controls for a small group of boys who were extremely and chronically violent prior to age 14, so we made no estimates of gang effects for these boys, because the joiners in this group were clearly unlike anyone else; see Figure 2. A linear model would have produced estimates for such boys not by comparing comparable joiners and controls but rather by extrapolation from an incomparable group of much less violent controls; moreover, it would have hidden this extrapolation from public view, providing no indication that such an extrapolation had taken place. The hazards of such extrapolation are developed in detail by LaLonde (1986) and Dehejia and Wahba (1999).
Keeping Time in Order Both intended outcomes and persistence in treatment are outcomes of initial treatment. In the example, both violence and gang membership at age 15 are outcomes of the treatment, namely, joining a gang or not joining a gang at age 14, and our analysis views them both as outcomes. A key finding in the example was that gang membership was highly transient. Most joiners at age 14 soon quit; many controls at age 14 subsequently joined; if a boy was in a gang at age 17, it was typically not because he joined a gang at age 14. In our experimental analog, these issues are transparent and present no conceptual or technical difficulties. In contrast, some methods for longitudinal data would view gang membership throughout time as an external, ancillary, or exogenous time-varying treatment and violence throughout time as an outcome. If adjustments are made for an outcome of treatment as if it were a covariate measured before treatment, then estimates of treatment effects are often biased; see Rosenbaum (1984). As is seen from Rob-
PROPENSITY SCORES AND GROUP-BASED TRAJECTORIES
ins, Greenland, and Hu (1999) and the ensuing discussion, issues of this sort can creep into longitudinal analyses that intend to avoid them. The method we used here and the more general strategy of risk set matching (Li et al., 2001; Lu, 2005) both stress a transparent experimental analog in which covariates are established prior to the start of treatment, outcomes are identified subsequent to the start of treatment, and persistence in treatment is an outcome, often an important outcome. Psychological research on life course development can be divided into two distinct literatures. One aims to document and understand individual differences in developmental trajectories. The ultimate purpose of this literature is to develop empirically verified theory of the predictors and consequences of alternative trajectories of development. Research in this tradition relies primarily on prospective longitudinal studies such as that used in this article, and statistical inference is most commonly based on regressionbased statistical procedures. Another literature, which is more clinically or policy oriented, aims to identify interventions or programs that can alter trajectories for the better. For this type of research, randomized experiments are the preferred statistical methodology. Our objective in this article was to demonstrate a form of analysis based on groupbased trajectory modeling and propensity scores matching that more closely aligns the statistical methods used in these two literatures.
References Bergstralh, E. J., Kosanke, J. L., & Jacobsen, S. L. (1996). Software for optimal matching in observational studies. Epidemiology, 7, 331–332. Bertsekas, D. P. (1981). A new algorithm for the assignment problem. Mathematical Programming, 21, 152–171. Campbell, D. T. (1957). Factors relevant to the validity of experiments in social settings. Psychological Bulletin, 54, 297–312. Campbell, D. T., & Stanley, J. C. (1963). Experimental and quasi-experimental designs for research. Chicago: Rand McNally. Cochran, W. G. (1965). The planning of observational studies of human populations. Journal of the Royal Statistical Society, Series A, 128, 234 –266. Cox, D. R. (1958). Planning of experiments. New York: Wiley. Dehejia, R. H., & Wahba, S. (1999). Causal effects in nonexperimental studies: Reevaluating the evaluation of training programs. Journal of the American Statistical Association, 94, 1053–1062. Dorn, H. F. (1953). Philosophy of inferences from retrospective studies. American Journal of Public Health, 43, 677– 683. Elder, G. H., Jr. (1985). Perspectives on the life course. In G. H. Elder, Jr. (Ed.), Life course dynamics (pp. 23– 49). Ithaca, NY: Cornell University Press.
265
Elder, G. H., Jr. (1998). The life course as developmental theory. Child Development, 69, 1–12. Fleiss, J. L., Levin, B., & Paik, M. C. (2003). Statistical methods for rates and proportions. New York: Wiley. Gastwirth, J. L., Krieger, A. M., & Rosenbaum, P. R. (2000). Asymptotic separability in sensitivity analysis. Journal of the Royal Statistical Society, Series B, 62, 545–555. Greevy, R., Silber, J. H., Cnaan, A., & Rosenbaum, P. R. (2004). Randomization inference with imperfect compliance in the ACE-inhibitor after anthracycline randomized trial. Journal of the American Statistical Association, 99, 7–15. Gu, X. S., & Rosenbaum, P. R. (1993). Comparison of multivariate matching methods: Structures, distances and algorithms. Journal of Computational and Graphical Statistics, 2, 405– 420. Hansen, B. B. (2004). Full matching in an observational study of coaching for the SAT. Journal of the American Statistical Association, 99, 609 – 618. Haviland, A., & Nagin, D. S. (2005). Causal inference with groupbased trajectory models. Psychometrika, 70, 1–22. Haviland, A., & Nagin, D. S. (2007). Using group-based trajectory modeling in conjunction with propensity scores to improve balance. Journal of Experimental Criminology, 3, 65– 82. Hodges, J. L., & Lehmann, E. L. (1962). Rank methods for combination of independent experiments in the analysis of variance. Annals of Mathematical Statistics, 33, 482– 497. Hodges, J. L., & Lehmann, E. L. (1963). Estimates of location based on ranks. Annals of Mathematical Statistics, 34, 598 – 611. Hollander, M., & Wolfe, D. A. (1999). Nonparametric statistical methods (2nd ed.). New York: Wiley. Imbens, G., & Rosenbaum, P. R. (2005). Robust, accurate confidence intervals with a weak instrument: Quarter of birth and education. Journal of the Royal Statistical Society, Series A, 168, 109 –126. Joffe, M. M., & Rosenbaum, P. R. (1999). Propensity scores. American Journal of Epidemiology, 150, 327–333. Jones, B. L., & Nagin, D. S. (2007). Advances in group-based trajectory modeling and an SAS procedure for estimating them. Sociological Methods & Research, 35, 542–571. Jones, B., Nagin, D. S., & Roeder, K. (2001). A SAS procedure based on mixture models for estimating developmental trajectories. Sociological Research and Methods, 29, 374 –393. LaLonde, R. J. (1986). Evaluating the econometric evaluations of training programs with experimental data. American Economic Review, 76, 604 – 620. Lehmann, E. L. (1998). Nonparametrics: Statistical methods based on ranks. Saddle River, NJ: Prentice Hall. Li, Y. P., Propert, K. J., & Rosenbaum, P. R. (2001). Balanced risk set matching. Journal of the American Statistical Association, 96, 870 – 882. Lu, B. (2005). Propensity scores with time dependent covariates. Biometrics, 61, 721–728. Marshall, A. W., & Olkin, I. (1979). Inequalities. New York: Academic Press. McCaffrey, D. F., Ridgeway, G., & Morral, A. R. (2004). Propen-
266
HAVILAND, NAGIN, AND ROSENBAUM
sity score estimation with boosted regression for evaluating causal effects in observational studies. Psychological Methods, 9, 403– 425. Meyer, B. D. (1995). Natural and quasi-experiments in economics. Journal of Business and Economic Statistics, 13, 151–161. Ming, K., & Rosenbaum, P. R. (2000). Substantial gains in bias reduction from matching with a variable number of controls. Biometrics, 56, 118 –124. Ming, K., & Rosenbaum, P. R. (2001). A note on optimal matching with variable controls using the assignment algorithm. Journal of Computational and Graphical Statistics, 10, 455– 463. Muthe´n, B. O. (2001). Second-generation structural equation modeling with a combination of categorical and continuous latent variables: New opportunities for latent class–latent growth modeling. In A. Sayers & L. Collins (Eds.), New methods for the analysis of change (pp. 291–322). Washington, DC: American Psychological Association. Muthe´n, B. (2004). Latent variable analysis: Growth mixture modeling and related techniques for longitudinal data. In D. Kaplan (Ed.), Sage handbook of quantitative methodology (pp. 345– 368). Thousand Oaks: CA: Sage. Muthe´n, B., Brown, C. H., Masyn, K., Jo, B., Khoo, S.-T., Yang, C.-C., et al. (2002). General growth mixture modeling for randomized preventive interventions. Biostatistics, 3, 459 – 475. Nagin, D. S. (1999). Analyzing developmental trajectories: A semi-parametric, group-based approach. Psychological Methods, 4, 139 –177. Nagin, D. S. (2005). Group-based modeling of development. Cambridge, MA: Harvard University Press. Nagin, D. S., & Land, K. C. (1993). Age, criminal careers, and population heterogeneity: Specification and estimation of a nonparametric, mixed poisson model. Criminology, 31, 327–362. Noether, G. E. (1985). Elementary estimates: An introduction to nonparametrics. Journal of Educational Statistics, 10, 211–221. Robins, J. M., Greenland, S., & Hu, F.-C. (1999). Estimation of the causal effect of a time-varying exposure on the marginal mean of a repeated binary outcome [article and subsequent commentary]. Journal of the American Statistical Association, 94, 687– 712. Rosenbaum, P. R. (1984). The consequences of adjustment for a concomitant variable that has been affected by the treatment. Journal of the Royal Statistical Society, Series A, 147, 656 – 666. Rosenbaum, P. R. (1989). Optimal matching in observational studies. Journal of the American Statistical Association, 84, 1024 –1032. Rosenbaum, P. R. (1991a). A characterization of optimal designs for observational studies. Journal of the Royal Statistical Society, Series B, 53, 597– 610. Rosenbaum, P. R. (1991b). Discussing hidden bias in observational studies. Annals of Internal Medicine, 115, 901–905. Rosenbaum, P. R. (2002a). Covariance adjustment in randomized experiments and observational studies. Statistical Science, 17, 286 –327.
Rosenbaum, P. R. (2002b). Observational studies (2nd ed.). New York: Springer-Verlag. Rosenbaum, P. R. (2005a). Observational study. In B. S. Everitt & D. C. Howell (Eds.), Encyclopedia of statistics in behavioral science (pp. 1451–1462). New York: Wiley. Rosenbaum, P. R. (2005b). Sensitivity analysis in observational studies. In B. S. Everitt & D. C. Howell (Eds.), Encyclopedia of statistics in behavioral science (pp. 1809 –1814). New York: Wiley. Rosenbaum, P. R. (2007). Sensitivity analysis for m-estimates, tests, and confidence intervals in matched observational studies. Biometrics, 63, 456 – 464. Rosenbaum, P., & Rubin, D. (1983). The central role of the propensity score in observational studies for causal effects. Biometrika, 70, 41–55. Rosenbaum, P., & Rubin, D. (1984). Reducing bias in observational studies using subclassification on the propensity score. Journal of the American Statistical Association, 79, 516 –524. Rosenbaum, P., & Rubin, D. (1985). Constructing a control group using multivariate matched sampling methods that incorporate the propensity score. American Statistician, 39, 33–38. Rosenbaum, P. R., & Silber, J. H. (2001). Matching and thick description in an observational study of mortality after surgery. Biostatistics, 2, 217–232. Rosner, B. (1982). A generalization of the paired t-test. Applied Statistics, 31, 9 –13. Rubin, D. B. (1974). Estimating causal effects of treatments in randomized and nonrandomized studies. Journal of Educational Psychology, 66, 688 –701. Rubin, D. B. (1979). Using multivariate matched sampling and regression adjustment to control bias in observational studies. Journal of the American Statistical Association, 74, 318 –328. Rubin, D. B. (1980). Bias reduction using Mahalanobis metric matching. Biometrics, 36, 293–298. Shadish, W. R., Cook, T. D., & Campbell, D. T. (2002). Experimental and quasi-experimental designs for generalized causal inference. Boston: Houghton Mifflin. Smith, H. (1997). Matching with multiple controls to estimate treatment effects in observational studies. Sociological Methodology, 27, 325–353. Thornberry, T., Krohn, M., Lizotte, A., Smith, C., & Tobin, K. (2003). Gangs and delinquency in developmental perspective. Cambridge, UK: Cambridge University Press. Tremblay, R. E., Desmarais-Gervais, L., Gagnon, C., & Charlebois, P. (1987). The Preschool Behavior Questionnaire: Stability of its factor structure between culture, sexes, ages, and socioeconomic classes. International Journal of Behavioral Development, 10, 467– 484. West, S. G., & Thoemmes, F. (in press). Equating groups. In P. Alasuutari, J. Brannen, & L. Bickman (Eds.), Handbook of social research methods. London: Sage.
PROPENSITY SCORES AND GROUP-BASED TRAJECTORIES
267
Appendix Detailed Efficiency Calculations
Expanding on the discussion of Tables 2 and 3, this Appendix contains a new result on efficiency of matched designs. There are S strata, with ns treated participants, i ⫽ 1, . . . , ns, n⫹ ⫽ ⌺sS ⫽ 1 ns treated participants in total, and Ls potential controls in stratum s, with Ls ⱖ ns, s ⫽ 1, . . . , S. From Table 1, S ⫽ 2, n1 ⫽ 21, n2 ⫽ 38, n⫹ ⫽ 59, L1 ⫽ 276, and L2 ⫽ 216. The ith treated participant in stratum s will be matched to msi ⱖ 1 controls from stratum s, with no control s used twice. Write m ⫽ (m11, . . . , mS,nS)T, ms⫹ ⫽ ⌺in⫽ 1 msi, T and m⫹ ⫽ (m1⫹, . . . , mS⫹) . Each joiner in stratum s will be matched to at least ␣s ⱖ 1 controls and at most s ⱖ ␣s controls with ms⫹ controls used in total in stratum s. Write ␣ ⴝ (␣1, ␣2, . . . , ␣S)T,  ⴝ (1, . . . , S)T. Clearly, one must choose ms⫹ and (␣s, s) so that ns ⱕ ms⫹ ⱕ Ls and ns␣s ⱕ ms⫹ ⱕ nss, s ⫽ 1, . . . , S; if this is true, say that (␣, , m⫹) is possible. Our strategy is to choose (␣, , m⫹) so that even in the worst case, the loss of efficiency is not large. As in Tables 2 and 3, we use the simple model for efficiency calculations; see the discussion of those tables for specifics. Consider the difference between the outcome of the ith treated participant and the average of this participant’s msi matched controls. The average of the n⫹ differences has variance (m) ⫽ (2/n⫹2)⌺s,i(1 ⫹ 1/msi). As in (msi) 3 ⬁; Table 2, there is a nonzero asymptote as min s,i 2 specifically, (m) 3 /n⫹, not to zero, so little is gained in (m) by increasing the msi beyond a certain point. Write s ⫽ ms⫹/ns where x is the greatest integer less than or equal to x and x is the least integer greater than or equal to x. The closest matches on covariates are obtained by taking ␣s ⫽ s ⫽ 1, ms⫹ ⫽ ns, and s ⫽ 1. The smallest standard errors are obtained by taking ms⫹ ⫽ Ls, ␣s ⫽ s ⫽ ms⫹/ns, s ⫽ ms⫹/ns, or specifically in the current study, m1⫹ ⫽ 276, (␣1, 1) ⫽ (13, 14) and m2⫹ ⫽ 216, (␣2, 2) ⫽ (5, 6), but matching in this way would have forced us to match violent joiners to nonviolent controls. Using Proposition 1 below, we decided on a matched design with (␣1, 1) ⫽ (2, 7), m1⫹ ⫽ 5 ⫻ n1, (␣2, 2) ⫽ (1, 6), and m2⫹ ⫽ 3 ⫻ n2. Using Proposition 1, the smallest possible standard error when using all controls as uniformly as possible is 87% of the standard error of the worst design with the (␣, , m⫹) we used. The minimum distance-matching algo-
rithm did not actually select the worst design for efficiency, and the actual ratio of standard errors was 89%. We used fewer than half of the available controls (most of whom were quite nonviolent and therefore not useful for comparison), and we did not match in uniform ratio, but the resulting loss of efficiency was quite small; specifically, the loss was only about 11% of the length of a confidence interval (which is proportional in length to the standard error). Details of this calculation follow. Write ᏹ␣,,m⫹ for the set of possible values for the vector m of matched set sizes; that is, m 僆 ᏹ␣,,m⫹ if and only if m is an n⫹ dimensional vector with positive integer coordinates msi such that ␣s ⱕ msi ⱕ s, i ⫽ 1, . . . , ns, and ms⫹ ⫽ ⌺ni s⫽ 1 msi for s ⫽ 1, . . . , S. Two elements of ᏹ␣,,m⫹ are of particular interest, specifically m and m ˜ . Informally, m is as nearly constant as possible, whereas m ˜ is as dispersed as possible. Define m by the rule if ms⫹/ns is an integer, then m si ⫽ ms⫹/ns for i ⫽ 1, . . . , ns; otherwise, if ms⫹/ns is not an integer, then m si ⫽ s ⫹ 1 for i ⫽ 1, . . . , ms⫹ ⫺ sns and m si ⫽ s for i ⫽ (ms⫹ ⫺ sns) ⫹ 1, . . . , ns. With ␣s ⬍ s, define m ˜ as follows: Let s ⫽ (ms⫹ ⫺ ns␣s)/(s ⫺ ␣s), and let m ˜ si ⫽ s for i ⫽ 1, . . . , s, m ˜ si ⫽ ms⫹ ⫺ (s ⫺ ␣s)s ⫺ ␣s(ns ⫺ 1) for i ⫽ s ⫹ 1, and m ˜ si ⫽ ␣s for i ⫽ s ⫹ 2, . . . , ns. If ␣s ⫽ s ⫽ ms⫹/ns, then m ˜ si ⫽ ␣s. For any possible choice of ␣, , m⫹, Proposition 1 determines the minimum and maximum standard errors, 冑共m兲. Using Proposition 1, one can select ␣, , m⫹, so the worst possible loss in efficiency is controlled. Proposition 1. For possible ␣, , m⫹, ˜ 兲 ⫽ max 共m兲. 共m 兲 ⫽ min 共m兲 and 共m m僆ᏹ ␣,,m⫹
m 僆 ᏹ␣,,m⫹
Proof. The contribution to (m) from each stratum s is a symmetric and convex function (or Schur convex function) of (ms1, . . . , ms,ns). The result then follows Proposition 4.C.1 of Marshall and Olkin (1979, p. 132), which is originally due to J. H. B. Kemperman. Received January 5, 2006 Revision received January 24, 2007 Accepted February 12, 2007 䡲