UCRL-JRNL-220200
Comment on "Methodology and results of calculating Central California surface temperature trends: evidence of human-induced climate change?" by Christy et al. (2006)
C. Bonfils, P. Duffy, D. Lobell March 29, 2006
Journal of Climate
This document was prepared as an account of work sponsored by an agency of the United States Government. Neither the United States Government nor the University of California nor any of their employees, makes any warranty, express or implied, or assumes any legal liability or responsibility for the accuracy, completeness, or usefulness of any information, apparatus, product, or process disclosed, or represents that its use would not infringe privately owned rights. Reference herein to any specific commercial product, process, or service by trade name, trademark, manufacturer, or otherwise, does not necessarily constitute or imply its endorsement, recommendation, or favoring by the United States Government or the University of California. The views and opinions of authors expressed herein do not necessarily state or reflect those of the United States Government or the University of California, and shall not be used for advertising or product endorsement purposes.
Updated October 14, 2003
Comment on “Methodology and results of calculating Central California surface temperature trends: evidence of human-induced climate change?” by Christy et al. (2006)
Céline Bonfils1,*, Philip B. Duffy1,2, David B. Lobell2 1
2
School of Natural Sciences, University California, Merced, CA, 95344.
Energy and Environment Directorate, Lawrence Livermore National Laboratory, Livermore, CA 94550.
* Author for correspondence: Céline Bonfils Lawrence Livermore National Laboratory P.O. Box 808 L-103 Livermore, CA 94550 Tel: (925) 423-9923 Fax: (925) 423-4908 Email:
[email protected]
Submitted March 24, 2006
1
Understanding the causes of observed regional temperature trends is essential to projecting the human influences on climate, and the societal impacts of these influences. In their recent study, Christy et al. (2006, hereinafter CRNG06) hypothesized that the presence of irrigated soils is responsible for rapid warming of summer nights occurring in California’s Central Valley over the last century (1910-2003), an assumption that rules out any significant effect due to increased greenhouse gases, urbanization, or other factors in this region. We question this interpretation, which is based on an apparent contrast in summer nighttime temperature trends between the San Joaquin Valley (~ +0.3 ± 0.1 ºC/decade) and the adjacent western slopes of the Sierra Nevada (-0.25 ± 0.15 ºC/decade), as well as the amplitude, sign and uncertainty of the Sierra nighttime temperature trend itself. We, however, do not dispute the finding of other Sierra and Valley trends.
Regarding the veracity of the apparent Sierra nighttime temperature trend, CRNG06 generated the Valley and Sierra time-series using a meticulous procedure that eliminates discontinuities and isolates homogeneous segments in temperature records from 41 weather stations. This procedure yields an apparent cooling of about -0.25 ± 0.15 ºC/decade in the Sierra region. However, because removal of one of the 137 Sierra segments, from the most elevated site (Huntington Lake, 2140m), causes an increase in nighttime temperature trend as large as the trend itself (of +0.25 ºC/decade, CH06), and leads to a zero trend, the apparent cooling of summer nights in the Sierra regions seems, in fact, largely uncertain.
2
We have analyzed summer nighttime temperature trends from five widely used gridded meteorological datasets (UW1, Maurer et al. 2002; UW2, Hamlet and Lettenmaier, 2005; VEMAP, Kittel et al. 1996; CRU2.0, Mitchell et al. 2004, and CRU2.1, Mitchell and Jones, 2005) for the period 1910-2000 (CRU2.0, CRU2.1) or for the longest period of coverage within 1910-2000 (UW1 : 1949-2000 ; UW2 : 1915-2000 ; VEMAP : 1910-1993). Additionally, we have also analyzed the 1910-2000 temperature trends from stations of United States Historical Climatology Network (USHCN), using observations that have been adjusted for biases induced by changes in instrumentation and station location and that contains estimated values for missing and outlier observations (Karl et al., 1990). While the datasets are not truly independent because they include many of the same observations, the differences in resolution (1/8º for UW1 and UW2, 1/2º for the others) and the diverse processing and aggregation techniques applied make it valuable to analyze them all. For instance, UW1, compiled from unadjusted National Weather Service Cooperative Observer stations data, is less suitable for longterm trends analysis than its extended version, UW2, that includes adjustments in temporal inhomogeneities (Hamlet and Lettenmaier, 2005). All gridded datasets show that summer nights temperatures are rising in Central Valley (Fig 1a.), at a rate that is significant (except for VEMAP) and comparable to the one found in CRNG06. Nevertheless, in contrast to CRNG06, none of the gridded datasets shows a nighttime cooling signal in the adjacent Sierra. Rather, temperature minima are found to be rising in the mountains as fast as in the Valley region. Similar results are found using USHCN observations. Using UW1, 1949-2000 temperatures are decreasing at the location of five weather stations selected by CRNG06 (including
3
Huntington Lake), but rising at the location of half of these sites, at a rate similar or much faster than the one found in the Valley. Observational errors arising from changes in instrument, location, or local time of measurement are unlikely to be as carefully detected and corrected in the gridded datasets as by CRNG06. However, the sign of biases resulting from observational errors should vary randomly from station to station. If this sort of bias were prevalent, therefore, trends calculated from gridded datasets should be much noisier than those of CRNG06, whereas in reality they are spatially smooth. Moreover, our confidence in the nighttime warming trend in the Sierra region is increased by the strong consistency existing across datasets. Such consistency is not always seen. For instance, while significant decreases in summer maximum temperatures are prevalent in Central Valley, and in agreement with CRNG06 (likely related to radiative cooling over irrigated areas, as suggested in CRNG), there is no such consensus in the Sierra Nevada (Fig. 1b). CRNG06 assume that any difference in temperature trends between the Central Valley and Sierra regions, if confirmed, must be due to irrigation in the Valley. Yet other factors can cause regional trend differences. Regional model simulations, for example, show greater warming response to increased CO2 in the mountains, even though these simulations do not represent irrigation or other forms of land-use change (Duffy et al, 2006). Other spatially heterogeneous forcings (due to e.g. aerosols or urbanization) could cause the trend differences. In the Central Valley, the population growth, the urban development (Bereket et al., 2005) and an increase in dirt and asphalt roads to access agricultural fields might also be at the origin of some increases in nighttime surface
4
temperature in the Valley. The magnitude of the changes attributed to such anthropogenic effects are, however, still unknown. One way to study the effect of irrigation on California climate, while avoiding potential biases induced by elevation, different climatological regimes, and other spatially heterogeneous forcings, is to focus on the seasonality in observed temperature trends in the Valley alone, since irrigation is more common in summer months. For instance, CRNG06 found a strong seasonality in daytime temperature trends in San Joaquin Valley. The largest cooling, which occurs during summer while trends in other seasons are small, suggests again a transfer of heat from the irrigated soils to the lower atmosphere via evapotranspiration (CRNG06). The seasonality in minimum temperatures is quite different, however. Minimum temperatures rose during all four seasons in the Valley, most rapidly during autumn. The uncertainties in these trends are such that the warming rate could have been identical in all seasons, obfuscating completely the potential signature of irrigation on California nighttime summer climate.
In summary, while a cooling of summer daytime temperatures due to irrigation in California's Central Valley seems plausible, the interpretation that irrigation explains the rise in nighttime temperature is premature. Neither the results from gridded or stations meteorological datasets, nor the seasonality of the trends can support this hypothesis. According to the used observational datasets, the rise in minimum temperatures, occurring from the western coast to the eastern mountains and affecting all elevations (Fig. 1a), rather suggests a large-scale influence on California climate, which does not exclude climate responses to local-scale changing surface conditions (irrigation,
5
urbanization). A valuable hypothesis, disregarded by the authors, is that various humaninduced factors (greenhouse warming, urbanization and irrigation) act in concert to rise the temperature of summer nights in Central Valley, while irrigation mitigates greenhouse warming of Central Valley during the day.
Datasets: UW1 and UW2 gridded meteorological datasets were obtained from the Surface Water Modeling group at the University of Washington from their web site at http://www.hydro.washington.edu/Lettenmaier/gridded_data/.
CRU2.0
and
CRU2.1
gridded datasets were developed by the Climate Research Unit (CRU) of the University of East Anglia. VEMAP dataset was developed through the Vegetation/Ecosystem Modeling and Analysis Project Phase 2. USHCN dataset has been developed to assist in the detection of regional climate change (Karl et al. 1990) and commonly used for trends studies in the United States.
Acknowledgments: The work of CB and PD was supported by the State of California through the Public Interest Energy Research Program. The work of DBL was performed under the auspices of the U.S. Department of Energy by University of California, Lawrence Livermore National Laboratory under Contract W-7405-Eng-48.
6
7
References : Bereket, L., D. Fabris, J.E. Gonzalez, S. Chiappari, S. Zarantonello, N.L. Miller, and R. Bornstein, 2005: Urban heat islands in California's Central Valley. Bull. Am. Meteorol. Soc., 86, 1542–1543. Christy, J. R., W. B. Norris, K. Redmond, and K. P. Gallo, 2006: Methodology and results of calculating Central California surface temperature trends: evidence of humaninduced climate change? J. Climate, in press. Duffy, P. B., R. W. Arritt, J. Coquard, W. Gutowski, J. Han, J. Iorio, J. Kim, L.-R. Leung, J. Roads, and E. Zeledon, 2006: Simulations of present and future climates in the western U.S. with four nested regional climate models. J. Climate, in press. Hamlet, A. F., and D. P. Lettenmaier, 2005: Production of temporally consistent gridded precipitation and temperature fields for th continental U.S.. J. Hydrometeorology, 6, 330– 336. Karl, T. R., C. N. Williams, Jr., F. T. Quinlan, and T. A. Boden, 1990: United States Historical Climatology Network (HCN) Serial Temperature and Precipitation Data. Environmental Science Division, Publication No. 3404, Carbon Dioxide Information and Analysis Center, Oak Ridge National Laboratory, Oak Ridge, TN, 389 pp. Kittel, T. G. F., N. A. Rosenbloom, C. Kaufman, J. A. Royle, C. Daly, H. H. Fisher, W. P. Gibson, S. Aulenbach, D. N. Yates, R. McKeown, D. S. Schimel, and VEMAP 2 Participants, 2001: VEMAP 2: U.S. Monthly Climate, 1895-1993, Version 2. Data set available on-line [http://www.daac.ornl.gov] from Oak Ridge National Laboratory Distributed Active Archive Center, Oak Ridge, Tennessee, U.S.A.
8
Maurer, E. P., A. W. Wood, J. C. Adam, D. P. Lettenmaier, and B. Nijssen, 2002: A long-term hydrologically-based data set of land surface fluxes and states for the conterminous United States. J. Climate, 15, 3237–3251. Mitchell, T. D., T. R. Carter, P. D. Jones, M. Hulme, and M. New, 2004. A comprehensive set of high-resolution grids of monthly climate for Europe and the globe: the observed record (1901–2000) and 16 scenarios (2001–2100). Tyndall Working Paper 55, Tyndall Centre, UEA, Norwich, UK. http://www.tyndall.ac.uk/. Mitchell, T. D., and P. D. Jones, 2005: An improved method of constructing a database of monthly climate observations and associated high-resolution grids. Int. J. Climatol., 25, 693–712. Santer, B. D., T. M. L. Wigley, J. S. Boyle, D. J. Gaffen, J. J. Hnilo, D. Nychka, D. E. Parker, and K. E. Taylor, 1999: Statistical significance of trends and trend differences in layer-average atmospheric temperature time series. J. Geophys. Res. 105, 7337–7356.
9
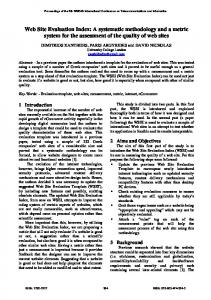
Fig. 1 caption : Observed June-July-August average minimum (upper panels) and maximum (lower panels) temperature trends (ºC/decade) in California calculated from five meteorological gridded datasets and USHCN. Trends were calculated using a least-squares approach, over the period as defined in the text. For the five gridded datasets, regions in gray show trends that are not significantly different from zero (p