Avian species diversity was highest in the preclimax fir forest during the ... During the drought of 1977 the spruce avifauna appeared more stable, so .... (usually on skis or snowshoes) around the plots in either late morning or early afternoon.
BIRD
COMMUNITIES
COMMUNITY
ALONG
STRUCTURE
A MONTANE AND
SERE:
ENERGETICS
KIMBERLY G. SMITH 1 AND JAMESA. MACMAHON Departmentof Biologyand EcologyCenter, UMC 53, Utah State University, Logan, Utah 84322 USA
ABSTRACT.--We examined 11 of 24 ecosystemattributes that Odum (1969) proposed would change during successionin avian communities in meadow, aspen, fir, and spruce forests in northern Utah and southern Idaho. A total of 71 bird specieswas observedduring the 30-month study, of which 43 were known to breed. Yearly energeticrelationshipswere calculatedfor the breedingbird populationsusingan avian community energetics model. In the different avian communities, the ratios of annual secondary
production/community respiration,secondaryproduction/biomass present,and secondaryproduction/consumptionall tended to decreasewith increasingplant succession;biomasspresent?'unit energy flow" tended to increase. All of thesetrends are consistentwith those postulatedby Odum for the entire ecosystem.These energeticsratios differed in 1977 from those in 1976 and 1978 due to a severedrought. They also fluctuated greatly during the courseof a year. Avian speciesdiversity was highestin the preclimax fir forestduring the breedingseasonand fluctuated widely in the nonbreedingseason.Speciesequitability tended to be relatively high in all avian
communities, although it wasslightly lowerduringthenonbreeding season. Notrendswerefo•ndin male body sizes, mean clutch size, and mean length of incubation period (a crude measure of
parental investment).Thus, for the bird communities,we reject the postulatedtrendsof increased speciesdiversity, equitability, and organismsize in the climax, quantity to quality production, and r- to K-selection.During the drought of 1977 the spruceavifauna appeared more stable, so we cannot reject Odum's hypothesizedtrend of increasedstability in the climax. We conclude that the vegetational characteristicsof a given sere will in most casesdetermine the avian population responsealong that sere;this in turn will influence the correspondenceof the avian communities to Odum's postulates. Incorporating these avian results with other studies within our subalpine sere, some of Odum's hypothesizedtrends are supported while others are not, suggestingthat successionalrelationships are more complicated than would follow from
Odum's relatively simple model. Received20 February 1980, accepted9 June 1980.
ODUM (1969: Table 1) proposed trends in 24 ecosystemattributes that change as successionproceedsfrom early (pioneer) to late (mature or climax) stages.He divided theseecosystemattributes into six groups:community energetics,community structure, life history, nutrient cycling, selectionpressure, and overall homeostasis.The trends Odum proposedwere based on the following premisesconcerningsuccession: "i) It is an orderly processof community developmentthat is reasonablydirectional and, therefore, predictable; ii) It results from the modification of the physical environment by the community . . .; iii) It culminates in a stabilized ecosystemin which maximum biomass(or high information content) and symbiotic function between organisms are maintained per unit available energy flow" (Odum 1969: 262; seealso Odum 1971:251-267). This viewpoint has been widely criticized (seereview in Connell and Slatyer 1977). Connell and Slatyer stated that Odum's scheme is based on analogy, not evidence, and Engleberg and Boyarsky (1979) argued that even the analogy is a poor one. Few studies have attempted to test the proposed attributes simultaneouslyon an ecosystem-widebasis. During 1975-1978 a study was undertaken to test empirically as many of Odum's 24 attributes as possiblein a relatively simple subalpine sere. Data were collected on as many aspectsof the plant and animal communities that were related to Odum's 'Present address: Bodega Marine Laboratory, University of California, Bodega Bay, California 94923 USA.
8
The Auk 98:8-28. January1981
January1981]
MontaneAvian CommunityStructure
9
TABLE 1. Eleven attributes proposedby Odum (1969) that were tested by examining the spruce-fir avifauna along a subalpine sere. Ecosystemattribute
Predictedtrend (Odum 1969)
Community energetics Production/respiration
Approaches 1 High to low Low to high High to low
Production/biomass
Biomass/unit energy flow Net community production Community structure Total organic matter Speciesdiversity--variety Speciesdiversity--equitability
Low to high Low to high Low to high
Life history Size of organism
Small to large
Selection pressure Growth form Production Overall
r- to K-selection
Quantity to quality
homeostasis
Stability
Poor to good
postulates as possible. Preliminary results encompassing both plants and animals
(including invertebrates) have been reported in MacMahon (1980), and a detailed study of the herbivorous mammals along the sere is reported by Andersen et al. (1980). Here we report a portion of the results concerningthe subalpine avifauna (see also MacMahon 1980; Smith 1980, 1981). Historically, successionaltheory has focused on botanical characteristics of seres (see review in MacMahon 1980), and, although many studies have been conducted on avian communities in successional stages, few of these have addressedaspectsother than speciesdiversity and
biomass. By incorporating resultsfrom 3 yr of field work with published values on avian life history characteristics, we are able to address 11 of the 24 proposed ecosystem trends (Table 1). Of the remaining 13 trends, some cannot be tested adequately by studying the avian community alone (e.g. food-web structure), some do not apply to the bird community (e.g. mineral cycles,role of detritus), and others are so nebulous that they may be inherently untestable (e.g. internal symbiosis, entropy, information). METHODS
Study area.--The study was conductedin the Bear River Mountains of northern Utah and southern Idaho. The subalpineregionis generallycharacterizedby disturbance-createdmeadowsinitiating a fourstage successionalsequenceleading through stands dominated by aspen (Populus tremuloides) to subalpine fir (Ables lasiocarpa) forestsand climaxing in Engelmann spruce(Picea engelmannii) or spruce-fir dominated forests.A detailed descriptionof the successionalpathways in this region of the Rocky Mountains can be found in Schimpf et al. (1980).
Studysites thatmaximized thevegetative distinctiveness ofeachseralstage werechosen. Themeadow, aspen, and fir plots were within 1 km of each other in Franklin Basin (elevation = 2,550 m), Franklin
County, Idaho (42ø02'N, 111ø38'W).The spruceplot was located20 km to the southin the Utah State University SchoolForest(2,600 m), Cache-RichCounties,Utah (41ø52'N, 111ø30'W).The meadowplot containedprimarily grassesand forbs with a few isolatedsagebrush(Artemisia tridentata) lessthan 0.5 m tall. The entire meadow was about 2 km'• and containedsomepermanentlyflowing water. The aspen stand was composedalmost entirely of aspen trees, with fewer than 20 fir trees and no spruce. During the summer the lush forbs and shrub understorygrew to a height greater than 1 m. While the fir plot was dominated by fir, it also contained aspen, spruce, and an occasional Douglas fir (Pseudotsuga menziesii). The relatively sparse ground cover consistedmostly of grassesand forbs, reaching a height of lessthan 0.5 m. The spruceplot containedlarge, old (>300 yr) sprucetrees with numerousfirs and
10
SMITH AND M•AcM•LHON
[Auk, Vol. 98
only an occasionalaspen. Little or no understoryexistedon this plot, but there were considerablenumbers of dead and fallen trees. A more complete analysis of the vegetative characteristics of each plot is presentedin Smith (1981) and the climatic, edaphic, and biotic aspectsof the sere are summarizedin Schimpf et al. (1980). The years 1976 and 1978 were similar climatically; one of the worst droughts of this century occurred in 1977 (Richardson 1977). For example, snow pack in a meadow near the spruce plot was comparable between 1976 and 1978, but the ground was bare in April 1977 when more than 200 cm would have been expected.This drought had profoundeffectson the avian community(K. Smith MS) and provided a natural experiment that we used to make inferencesabout the stability of the ecosystem. Field studies.•In early June 1976, four 10-ha study plots were established,one in each seral stage.
Numberedand letteredwoodenstakes(0.4 m) wereplacedwithin eachplot in a grid systemwith a 50-m spacing. These plots were censusedfrom June 1976 through December 1978, with some casual observations made betweenJanuary 1976 and the start of censusing.A modifiedWilliams spot-maptechnique was used during the breedingseason(June-August)whereby the plots were censusedby walking along the grid in a randomlydetermineddirectionfrom a randomlydeterminedstartingpoint and by stopping for 5 rain at every other stake (100 m). All birds seenor heard during the courseof the censuswithin 25 m of the observer (always KGS) were recorded on a scale map of the plots. The international censusing guidelines(International Bird Census Committee 1970) were followed as closely as possible.Usually censuseswere begun 0.5 h before sunriseand lasted 3.5 h; afternoon and evening censusesalso were conductedduring the breedingseason.Approximately10 censuses/plot were made during each breeding season.
During the nonbreedingseason(September-May), the censusesconsistedof approximately 2-h trips (usually on skis or snowshoes)around the plots in either late morning or early afternoon. Although few speciesare presentin the winter, this techniquewas effective in determiningthe density of the species present,becausethe birds tendedto be conspicuous and localized. The plots were censusedin every month possible(-25 of 30 months).During somemonths, the plots were inaccessibledue to weather, road conditions, and snowmobilefailure. The censusresultswere supplementedduring the summersof 1976 and 1977 by mist-nettingbirds in the three forested plots. Weights of most specieswere obtained in this manner. Census results were further supplementedwith observationsmade while engagedin other researchon the avian communities during which more than 100 h were spent on each forestedplot during the three summers.Some supplementalobservationsalsowere made during the winter. By supplementingthe censusresults,we hoped to reduce any bias due to employingdifferent censusmethodsand intraseasonaldifferencesin bird detectability(e.g. J•rvinen et al. 1977). A total of 71 specieswas observedon the plots over the course of the study, of which 43 were known to breed (see Appendix). Data analysis.--The avian community energeticsmodel (BIRD II) developed by Innis and Wiens (1977) was used to calculate various energeticrelationshipswithin each seral community. An earlier version of the model (Wiens and Innis 1974) has been used to determine avian community energetic relationshipsin northwesternconiferousforests(Wiens and Nussbaum 1975), coastalseabird communities (Wiens and Scott 1975), and the grasslandsof North America (Wiens 1977). The model requiresapproximately 30 input variables and parameters, some based on field data (e.g. population sizes, times of arrival, times of departure)and othersthat were gleanedfrom the literature (primarily from the Bent Life History series)(e.g. average clutch size, number of clutches,length of incubation). A completelist of input valuesis availableupon request.Detailsof the assumptions,structure,and input/outputvalues used in the model are discussedfully in Wiens and Innis (1974) and will not be dealt with here (seealso Wiens and Nussbaum 1975, Wiens 1977), exceptfor the estimationof consumption. One important change between the two BIRD models is the manner in which the estimate of consumption is obtained. In the earlier model, a weight of 0.40 existenceenergy was added to the estimate of existenceenergy to accountfor consumptiondue to various activities (Wiens and Innis 1974). In the model we used, the weight factor is variable and distributed accordingto a sine function (seeInnis and Wiens 1977 for details). We used a minimum weight of 0.10 and a maximum weight of 0.25 existence energy, values used in Innis and Wiens (1977). We feel that this addition to our estimate of existence energy to account for activities is important, but it is impossibleto assessthe biologicalreality of our choice of weighting factors. Two changeswere made in BIRD II at the suggestionof Wiens (pets. comm.). The cost associated with molting was deletedfrom the model, becauseit is unclear what, if any, are the costsof molting (e.g. see Dolnik and Gavrilov 1979). Second, the equations that are used for estimating the energy demandswere replacedby a set of equations(Kendeighet al. 1977)that integratephotoperiod,ambient temperature, and body weight. From theseequations,the energy requirementsfor passetinesand non-
January198l]
MontaneAvian CommunityStructure
11
passerineswere calculatedat 0øC and 30øC for 10-h and t5-h days. Linear interpolation was then used to obtain the energy demand for the proper combination of temperature and day length. This procedure
is documentedin Innis and Wiens (1977), but the equations reported therein are incorrect. Weekly average temperatures(1976-1978) calculatedfrom data obtained in a meadow near the spruceplot by a continuously recording hygrothermograph and maximum deviation from 12-12 h photoperiod at the study area latitude were entered as input variables for use in these energy demand equations. A total of 43 specieswas included in the avian community energeticsmodel (Appendix). An additional 28 species,each observedlessthan 5 times during the 3 yr of observation,were not includedin this analysis. Becausethe model requiresdensity expressedas individuals/km2, censusresultson the tO-ha plots were multiplied by t0 for hummingbirds, woodpeckers,and passetines,which is justified because the plots were chosen to maximize the distinctivenessof the different seres. Numbers of raptors, owls, and grousewere estimated with considerationfor territory size and population densitiesin general in northern Utah (pers. obs.). Few community energeticsstudies (e.g. Alatalo 1978) have included this nonpasserinecomponent of the avifauna; we have included it in our analysis, becausethese speciesmay be important in terms of avian community energetics. Calculations of biomass, production, consumption, and respiration were made at 1-day intervals for each seral stage in each year. Production, of course, refers to secondaryproduction, in this casethe cost associatedwith egg production and the growth of nestlings and fledglings. Fledglings are defined as young birds that are out of the nest but still in the care of the parents;juveniles are self-sufficient.Within the constraintsof the model, no production occurs outside of the breeding seasonwithin the adult component.Although this may not be realistic (e.g. fat deposition),it probably has little effect on the estimation of production. Species diversity (H') and equitability (J') were calculated for each month based on census data collectedfrom June 1976 through October 1978. All speciesobservedduring censusingwere used in this analysis. Simpson'sindex, Hurlbert's index, and speciesdiversity calculatedas H all gave similar conclusionsas those obtained with H' [see Peet (1974) for equations and discussionof indices]. Similarity of avifaunas between seral stageswas calculated for each year, usingJaccard Analysis (MacMahon and Trigg 1972): Similarity-
2w
a+b
x tOO,
where w is the number of speciesthat the two seral stagesshare in common, and a + b is the total number of speciesobserved in both seral stages. Total biomassand size of organismswere estimatedbased on the bird weight data obtained from mistnetting. In a few cases, weights of the rarer species,e.g. raptors, were obtained from the literature. Unless otherwise noted, average weights were calculated disregarding sex and the seral stage in which the birds were captured. Growth form and production quality were analyzed based on natural history data obtained from the literature.
•ESULTS
Community energetics.--Results of the avian community energeticsmodel estimations are summarized in Table 2. Annual consumption was very low in the
meadow, because only three species bred there. In the predrought year of 1976, consumptionby the aspen bird community was 78 and 97% of the fir and spruce communities, respectively. The drought of 1977 affected the aspen birds to a greater degree than it did the other two forested plots (see below): consumption by the aspen birds was reduced to about 30% in 1977 and about 40% in 1978 of both the fir and
spruce communities. In the fir avian community, consumption was consistently
higher than in the sprucefor all 3 yr (24, 9, and 2%, respectively). Respiration accounted for the greatest proportion of consumption, with more energy lost through excretion than was spent in production (Table 2). Note that production in the aspen was slightly less than that in the fir and greater than that in the spruce bird community in 1976, but much less than production in the other two in 1977 and 1978. Production was highest in the fir stage in 2 of the 3 yr. The
12
SMITHANDMAcMAHoN
•5Mc5
v
[Auk,Vol. 98
•d
January1981]
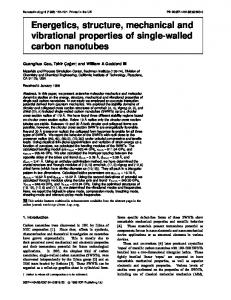
MontaneAvianCommunity Structure • MEADOW :i:i:i:i:i:!: AS P E N ?///,•, F I R I SPRUCE
12
10
1976 Fig. 1.
13
1977
1978
Annual avian biomasspresentduring 1976, 1977, and 1978 in four seral stages.
percentageof total annual consumptionallocated to reproductiondecreasedalong the sere, i.e. higher in the meadow and aspen and lower in the fir and spruce. Less than 0.5% of the total annual consumption was allocated to egg production, and about 5-6% was allocated to the nestlings. As expected, adults and juveniles accounted for most of the biomasspresent on the plots, with nestlingsand fledglings contributing less than 5% of the total avian biomasspresent on the forested plots. The fir plots consistentlysupported more avian biomass (Fig. 1) than the climax spruce forest in all 3 yr (39, 63, and 5%). If we equate biomass present to total organic matter, the hypothesis that the climax forest supports the highest avian biomass does not appear to be correct. Using data from Table 2, it is possible to examine the trends in community
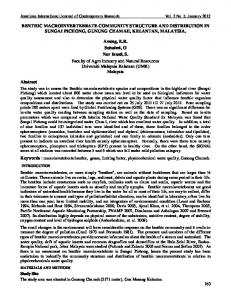
energeticslisted in Table 1. Total annual secondaryproduction/respiration (P/R) generally decreasedfrom meadow to sprucein all 3 yr (Fig. 2A), as did total annual secondaryproduction/annualbiomasspresent(P/B) (Fig. 2B). Total annual biomass present/"unitenergy flow" (= production + respiration, Odum 1969) (B/E) tended 0.08
0.12B.
2-00
0.04
0,06
• i.oo
o.00
000
m000
o.o• o.o,
, .oo o.•o
• FI R ß SPRUCE
Fig. 2. Annual avian energeticsrelationshipsduring 1976, 1977, and 1978 in four seral stages.A. Arian secondaryproduction/aviancommunityrespiration;B. Avian secondaryproduction/avianbiomass present;C. Avian biomasspresent/unitenergyflow; D. Avian secondaryproduction/aviancommunity consumption;E. Arian community consumption/arianbiomasspresent.
14
SMITH AND MACMAHON --
1976
....
1977
[Auk, Vol. 98
........ 1978 o.oolo
O. 0000
0.0005
....
0.0000
0.00•0 i• FIR
0.0015
\
0.0010
0.0005 ] 0 0000 '
Fig. 3.
J'F'H'A
--
I'I J'J'A'S'O'N'D'
0.0020
SPRUCE
o.om5
o.oo, o
0.0005
.',
O. 0000
J
F
M
A
M
J
J
A
S
0
N
D
Daily avian secondaryproduction/aviancommunity respirationduring 1976, 1977, and 1978
in four seral stages.
to increase through the course of succession(Fig. 2C). All three of these trends generally are in accordancewith those suggestedby Odum (1969). Another proposedtrend was a decreasein net community production with successional development. It has already been shown that total secondaryproduction did not follow this trend (Table 2), being low in the meadow and high in the spruce forest. This is merely a function of the increasingnumber of speciesand individuals. The percent of annual consumption allocated to production was greatest in the meadow and aspen (Table 2), which is in accordancewith the hypothesizedtrend. Because Odum was more interested in net primary production, total annual secondaryproduction/consumption (P/C) would seemto be the measureof net secondary production. The trend in this ratio is in agreement with that postulated (Fig. 2D). [Note the similarity between P/B and P/C (Fig. 2B and 2D).] Salt (1957) argued that the climax should support more biomasson a given energy budgetthan could earlier seralstagesand proposedusingconsumingbiomass/standing crop biomassto examine this phenomenon. We have chosento examine the ratio of annual consumption/biomass present(C/B), which should decreasewith succession. This trend is generally supported (Fig. 2E). This relationship is the inverse of B/E (Fig. 2C). Because more than 70% of the breeding speciesare migratory (seeAppendix) and the number of speciesencountered on the study plot outside of the breeding season is quite low, an analysis of the above ratios on a daily basis is informative, as the values for most ratios fluctuate widely over the courseof the year. Daily P/R (Fig. 3) peaked sharply in the early successionalstagesand tended to be relatively more spread out in the later seral stages.Within the constraintsof the model, this ratio is zero outside of the breeding season.The secondpeak evident in someseral stages is due to production associatedwith secondclutches. The spruce P/R distribution was significantly different from the aspen (Kolmogorov-Smirnov test, P < 0.05) and the fir (P < 0.01) only in 1977, and the meadow distribution was significantly different from all other stages in all years (P < 0.01) for this and all other daily energetics relationships (Figs. 3-6).
Daily P/B (Fig. 4) also peaked sharply in the meadow stage; other stageswere
January 1981]
Montane ArianCommunity Structure •
1976
c•
•0'$0 l •
0,40 ß
a30.
30
....
1977
........
1978
MEADOW
0.00
0'$0 0.40 0.20
ASPEN
0,30
• 0.201