Techniques Using MATLAB. Sukhjinder ... classical problem in image processing
and computer vision. ..... Flow chart of various algorithm steps for DSIHE [9,.
Volume 2, Issue 3, March 2012
ISSN: 2277 128X
International Journal of Advanced Research in Computer Science and Software Engineering Research Paper Available online at: www.ijarcsse.com
Comparative Study and Implementation of Image Processing Techniques Using MATLAB Sukhjinder Singh* M Tech research scholar PTU GZS Campus, Bathinda-151001 (India)
[email protected]
R. K. Bansal
Savina Bansal
Faculty, Department of ECE PTU GZS Campus, Bathinda-151001 (India)
Director, BHSBIET Lehragaga-148031(India)
Abstract: - Image enhancement aims at improving the quality of image for better visualization. This paper presents three methods of image enhancement: - GHE, LHE an d DS IHE that improve the visual quality of images. In this paper, we implement and examine the effect of above mentioned techniques based on objective and subjective image quality parameters (like PSNR, NAE, S C, AE and MOS ) to measure the quality of gray scale enhanced images. A comparati ve analysis is also being carried out. For handling gray-level images, Histogram Equalization (HE) methods (like GHE and LHE) tend to change the mean brightness of an image to middle level of the gray-level range limiting their appropriateness for contrast enhancement in consumer electronics. The DS IHE methods seem to overcome this disadvantage as they tend to preserve both, the brightness and contrast enhancement, though at the cost of naturalness of the input image. Keywords: - Contrast enhancement, histogram equalization, PS NR, NAE, MOS , SC, AE, image enhancement, visual quality.
I. INTRODUCTION Sight is one of the most powerful senses used by human to perceive their environment. Large parts of the routine cerebral activit ies of hu man beings include receiving as well as analyzing images. In fact, more than 99% of the activity of human brain is involved in processing images fro m the visual cortex [9]. A visual image is rich in info rmation and can save thousand words. Many real world images are acquired with low contrast and unsuitable for human eyes to read, such as medical and industrial X-ray images [13]. Image enhancement is a classical problem in image processing and computer vision. The image enhancement is widely used for image processing and as a preprocessing step in speech recognition, texture synthesis and many other image/video processing applications [5, 6]. Various image contrast enhancement algorithms are proposed in literature wh ich includes gray scale manipulation, filtering and HE. The main purpose of image enhancement is to bring out details that are hidden in an image or to increase contrast in a low contrast image [8]. The rest of the paper is organized as follows: - Section II describes image enhancement. In the next section, HE will be reviewed. Section IV, V and VI lists GHE, LHE and DSIHE respectively. Section VII provides
implementation of various Histogram Processing Techniques (HPTs). Sect ion VIII describes subjective and objective image quality measures used in the work. Experimental results and discussion are presented in Section IX. II.
IMA GE ENHA NCEM ENT
Image enhancement is basically improving the interpretability or perception of information in images for human viewers and providing better input for other automated image processing techniques. The principal objective of image enhancement is to modify attributes of an image to make mo re suitable for given tas k and a specific observer. During this process, one or more attributes of an image are modified. The choice of attributes and the way they are modified are specific to a given task. Moreover, observer-specific factors such as the human visual system and the observer’s experience will introduce a great deal of subjectivity into choice of image enhancement methods. Image enhancement is used in the following cases:- removal of noise fro m image, enhancement of dark image and highlight the edges of the objects in an image. The result is more suitable than the original image for certain specific applications. Processing techniques are very much problem-oriented. For examp le,
Volume 2, Issue 3, March 2012 the best technique for enhancement of X-ray image may not be best for enhancement of microscopic images [8]. There exist many techniques that can be used to enhance an image without spoiling it. The enhancement methods can be broadly divided into the following two categories : spatial do main methods and frequency domain methods. Spatial do main methods are operated directly on pixels whereas frequency domain methods operate on the Fourier transform of an image. III.
HISTOGRAM EQUA LIZATION
Histogram of a d iscrete gray-level image represents the frequency of occurrence of all the gray levels in the image. Histogram based techniques are the most popular digital image processing techniques which can be used for image enhancement owing to their simp licity and effectiveness besides being economical. Histogram based techniques for image enhancement, are mos tly based on equalizing the histogram of the image which increase the dynamic range corresponding to the image. It can be categorized into two methods [7]:- Global Histogram Equalization (GHE) and Local Histogram Equalization (LHE). IV.
GLOBA L HE
Global Histogram Equalization (GHE) [3, 7, 11] is one of the popular methods used to enhance the contrast of image. In GHE, the histogram of whole input image is first obtained, then the Cumu lative Distribution Function (CDF) is calculated and gray transfer function is derived fro m the CDF. Though it is simple, it doesn’t take account of local image informat ion and often cause some contrast losses in small regions. GHE has been widely used in many areas such as medical and radar imaging. Although this global approach is suitable for overall enhancement, it fails to adapt the local brightness features of the input image and shifts the mean intensity to middle intensity level, regardless of input mean intensity. GHE is rarely used in consumer electronics such as digital cameras because it may produce undesirable distortions such as: excessive brightness change, noise-artifacts, gray-level saturation and unnatural enhancement. V.
LOCAL HE
To overcome the shortcoming of GHE, a Local Histogram Equalization (LHE) method has been developed. In this method, a contextual region is first defined [10, 13], a histogram of that region is obtained, and then its grey level transfer function is derived from its CDF. Thereafter, the center pixel of the region is histogram equalization using this function. The center of rectangular
© 2012, IJARCSSE All Rights Reserved
www.ijarcsse.com region is then moved to adjacent pixel and the histogram equalization is repeated. This method allows each pixel to adapt to its neighboring region, so that high contrast can be obtained for all locations in the image. This method is also known as Adaptive Histogram Equalization (AHE). However, since LHE (or A HE) must be performed for every pixel in the entire image, the computation comp lexity is very high [10]. Hence, LHE can remove the local brightness problem; however the overlapping slid ing mask mechanis m makes the LHE co mputationally expensive. VI.
DUA LISTIC SUB-IMA GE HE
Some researchers [1-7] have focused on the improvement of HE by decomposing the image into two or more sub-images and equalizing them separately. In contrast, major d ifference among these methods is the criteria they use to decompose the input image into two or more sub-images. Dualistic Sub-Image Histogram Equalization (DSIHE) method decomposes the original image into two sub-images based on median [12] of original image’s brightness and then equalizes the histograms of sub-images separately. It claims that if the separating level of histogram is the median of the original image’s brightness, it will yield the maximu m entropy after two independent sub-equalizat ions. VII.
IMPLEM ENTATION
The techniques mentioned above are compared based on subjective as well as objective parameters in this work. The algorithmic steps involved in these techniques are outlined below:A. GHE Method Algorithm Steps:The Histogram of digital image X={X (i, j)}, with L discrete intensity levels denoted by {𝑋0 , 𝑋1, … … . . , 𝑋𝐿 −1 }, is defined as: 𝑋𝑘 = 𝑛𝑘 , for 𝑘 = 0, 1, … , 𝐿 − 1........ (i) Where Xk is the k th intensity value and n k is the number of pixels in the image with intensity rk. For an M × N image, a normalized histogram known as Probability Density Function (PDF) is defined by:𝑝 𝑋𝑘 =
𝑛𝑘 𝑀𝑁
, for 𝑘 = 0, 1, … , 𝐿 − 1……. (ii)
Where p(Xk) gives an estimate of the probability of occurrence of gray level Xk in an image. Based on the PDF, the Cu mulative Density Function (CDF) is defined as:-
Page | 245
Volume 2, Issue 3, March 2012 𝑘
𝑐 𝑋𝑘 =
𝑝 𝑋𝑗 , for k = 0, 1, … , 𝐿 − 1 … (𝑖𝑖𝑖) 𝑗 =0
GHE enhances X={X (i, j)}, by using CDF as its transformation function. This transformation functio n, f (Xk), is defined as:𝑓 𝑋𝑘 = 𝑋0 + (𝑋𝐿 −1 − 𝑋0 )𝑐(𝑋𝑘 )…….. (iv) Then the output image produced by GHE, Y={Y (i, j)} can be expressed as:𝑌 = 𝑓(𝑥)………………….. (v) 𝑌 = 𝑓{(𝑋(𝑖, 𝑗)|∀𝑋(𝑖, 𝑗) ∈ 𝑋}……….. (vi) Although GHE successfully increases the contrast in the image, this method does not put any constrain in preserving the mean brightness. B. LHE Method Algorithm Steps:1) Calcu late number of rows and columns in an input image i.e. size of an image. Also obtain number of bins for the histograms used in building image transform function i.e. dynamic range. 2) Pre-process the inputs obtained in step 1 to determine real clip limit fro m the normalized value. If necessary, pad the image before splitting it into regions. 3) Process each contextual region (tile) thus producing gray level mappings: Extract a single image region, make a histogram for this region using the specified nu mber of bins, clip the histogram using clip limit, and create a mapping (t ransformat ion function) for th is region. 4) Interpolate gray level mappings in order to assemble final LHE image: Ext ract cluster of four neighboring mapping functions, process image reg ion partly overlapping each of the mapping tiles, ext ract a single pixel, apply four mappings to that pixel, and interpolate between the results to obtain the output pixel; repeat over the entire image.
www.ijarcsse.com Let an image X (i, j) is segmented by a section with gray level of X=Xm and the two sub-images are XL and XU [12], so we have:𝑋 = 𝑋𝐿 ∪ 𝑋𝑈 ……………… (vii) Here 𝑋𝐿 = (𝑋(𝑖, 𝑗)|𝑋 𝑖, 𝑗 < 𝑋𝑚 ∀ 𝑋(𝑖, 𝑗) ∈ 𝑋) and 𝑋𝑈 = (𝑋(𝑖, 𝑗)|𝑋 𝑖, 𝑗 ≥ 𝑋𝑚 ∀ 𝑋(𝑖, 𝑗) ∈ 𝑋). It is obvious that sub-image XL is composed by gray level of {𝑋0 , 𝑋1, … , 𝑋𝑚 −1 }, while sub-image XU is co mposed of {𝑋𝑚 , 𝑋𝑚 +1 , … … . . , 𝑋𝐿 −1 }. The aggregation of original image’s gray level distribution probability is decomposed into {𝑝0 , 𝑝1 , … … . . , 𝑝𝑚 −1 } and {𝑝𝑚 , 𝑝𝑚 +1, … … . . , 𝑝𝐿 −1 } correspondingly. The corresponding CDF will be :𝐶𝐿 𝑋𝑘 = 𝐶𝑈 𝑋𝑘 =
𝑘
1
𝑝 𝑖 =0 𝑖 ,
𝑝 1
𝐿 −1
𝑝 −1
𝑖 =𝑚
𝑘 = 0,1, … 𝑚 − 1 … (𝑣𝑖𝑖𝑖 ) 𝑝𝑖 , 𝑘 = 𝑚, 𝑚 + 1, … 𝐿 − 1
… (ix) Based upon CDF, t ransform functions of two sub image’s histogram are equalized below:𝐹𝐿 𝑋𝑘 = 𝑋0 + 𝑋𝑚 −1 − 𝑋0 𝐶𝐿 𝑋𝑘 , 𝑘 = 0, 1, … , 𝑚 − 1… (x) 𝐹𝑈 𝑋𝑘 = 𝑋𝑚 + 𝑋𝐿 −1 − 𝑋𝑚 𝐶𝑈 𝑋𝑘 , 𝑘 = 𝑚, 𝑚 + 1, . . . , 𝐿 − 1 … (𝑥𝑖) At last result of dualistic sub-image histogram is obtained after the two equalized sub-images are composed into one image. Suppose Y (i, j) denotes the processed image then:𝑌 = 𝑌 𝑖. 𝑗
= 𝐹𝐿 𝑋𝐿 ∪ 𝐹𝑈 𝑋𝑈 ……. (xii)
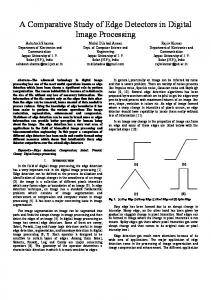
𝑋0 + 𝑋𝑚 − 𝑋0 𝐶𝐿 𝑋𝑘 .. (xiii) 𝑋𝑚 +1 + 𝑋𝐿 −1 − 𝑋𝑚 +1 𝐶𝑈 𝑋𝑘 Flow chart of various algorith m steps for DSIHE [9, 11] is shown in Figure 1.1. 𝑜𝑟 𝑌 𝑖, 𝑗 =
C. DSIHE Method Algorithm Steps:Dualistic Sub-Image Histogram Equalizat ion (DSIHE) first decomposes an input image into two sub-images based on the median of the input image [1]. One of the sub image is set of samples less than or equal to the med ian whereas the second one is the set of samples greater than the med ian. Then the DSIHE equalizes the sub images independently based on their respective histograms . Fig. 1.1:- Flow chart for DSIHE
© 2012, IJARCSSE All Rights Reserved
Page | 246
Volume 2, Issue 3, March 2012 VIII.
www.ijarcsse.com
PERFORMA NCE ANA LYSIS
Image Quality Measurement (IQM) is vital in the development of image processing algorithms such as enhancement, deblurring, denoising etc. as it can be used to evaluate their performances in terms of quality of processed image.
In fact, in image enhancement system, the tru ly definit ive measure of image quality is perceptual quality. The enhanced image quality is specified by Mean Opinion Score (M OS), which is result of perception based subjective evaluation [14]. The meanings of the 5-level grading scales of MOS are: - 5-pleasant or excellent, 4good, 3-acceptable, 2-poor quality and 1-unaceptable. MOS is defined as follow:𝑠 1 𝑀𝑂𝑆 = i𝑃𝑖 ,………………………..… (𝑥𝑖𝑣 ) 𝑆 𝑖 =0
Where i is an image score; Pi is image score probability and S is number of observer. B. Objective Quality Measurements 1) Peak Signal-to-Noise Ratio (PSNR) PSNR is the evaluation standard of the reconstructed image quality, and is important feature. The small value of PSNR means that image is poor quality. PSNR is defined as follow:2552 𝑀𝑆𝐸
…………… (xv)
Where 255 is maximu m possible value that can be attained by the image signal. Ideally it is infinite. Practically it is in the range of 25 to 40 d B. Mean Square Error (MSE) is defined as:𝑀
𝑀𝑆𝐸 =
𝑁
1
| 𝑋 𝑖. 𝑗 − 𝑋 ^ 𝑖, 𝑗 |2 . . (𝑥𝑣𝑖)
𝑀𝑁
𝑗 =1 𝑖 =1
Where M X N is size of original image; X (i, j) and X^ (i, j) are the orig inal image and enhanced image respectively. 2) Normalized Absolute Error (NAE) The large the value of NA E means that image is poo r quality.NA E is defined as:𝑁𝐴𝐸 =
𝑀 𝑖 =1
𝑁 ^ 𝑗 =1 |𝑋 𝑖 .𝑗 −𝑋 (𝑖,𝑗 )| 𝑀 𝑁 𝑖=1 𝑗 =1 |𝑋 𝑖.𝑗 |
… … (xvii)
3) Structural Content (SC) The large value of SC means that image is a poor quality. SC is defined as follows:-
© 2012, IJARCSSE All Rights Reserved
𝑆𝐶 =
𝑁 2 𝑗 =1 |𝑋(𝑖 ,𝑗 )| 𝑁 ^ 2 𝑗 =1 |𝑋 𝑖.𝑗 |
………. (xviii)
4) Average Difference (AD) This measure shows the average difference between the pixel values and is defined as follows:𝐴𝐷 =
𝑀 𝑖 =1
𝑁 ^ 𝑗 =1 |𝑋 i.j −𝑋 (i,j)|
MN
…….. (xix)
Ideally it should be zero.
A. Subjective Quality Measurement
𝑃𝑆𝑁𝑅 = 10𝑙𝑜𝑔
𝑀 𝑖=1 𝑀 𝑖 =1
IX.
RESULTS AND DISCUSSION
Various image enhancement techniques such as histogram equalizat ion (like GHE, LHE) and mu ltihistogram equalizat ion (like DSIHE) are imp lemented using MATLAB platform and compared based on prior knowledge on the Histogram Equalization. The performance of all these image enhancement techniques is analyzed for a set of real t ime images and results are presented in Appendix 1A (Table 1.1-1.2) and 1B (Fig 1.21.7) and. The comparat ive study of Histogram Equalization based methods shows that the images requiring higher brightness preservation are not handled well by both GHE as well LHE. These are somewhat better enhanced by DSIHE technique which provides maximal brightness preservation. Though these methods provide good contrast enhancement, they also result in more annoying side effects depending on the variation of gray level distribution in the histogram. LHE technique achieves better quality through qualitative visual inspection (like MOS) and quantitative accuracies of PSNR, NA E, SC and AD as compared to other methods. In subsequent work, for the enhancement purpose more images can be taken from d ifferent application fields so that it becomes clearer that for wh ich application wh ich particular technique is better both for Gray Scale Images and color Images. Particu larly, for color images there are not many performances measurement parameter considered. So, new parameters can be considered for the evaluation of enhancement techniques. New co lor models can also be chosen for better comparison purpose. Optimization of various enhancement techniques can be done to reduce computational complexity as much as possible. REFERENCES [1] Chao Wang and Zhongfu Ye, “Brightness Preserving Histogram Equalizat ion with Maximu m Entropy: A Variational Perspective”, IEEE Transactions on Consumer Electronics, Vol. 51, No. 4, pp.1326-1334, November 2005.
Page | 247
Volume 2, Issue 3, March 2012
www.ijarcsse.com
[2] Chen D. and Ramli R., “Preserving Brightness in Histogram Equalizat ion Based Contrast Enhancement Techniques”, Co mputer Journal of Digital Signal Processing, Vol. 14, No. 5, pp. 413-428, 2004. [3] David Menotti et al., “Multi-Histogram Equalization Methods for Contrast Enhancement and Brightness Preserving”, IEEE Transactions on Consumer Electronics, Vol. 53, No. 3, pp. 1186-1194, August 2007. [4] Dr. Muna F. Al-Samaraie and Dr. Nedhal Abdul Majied Al Saiyd “Medical Co lored Image Enhancement Using Wavelet”, Ubiquitous Computing and Co mmun ication Journal, Vo l. 6, pp.1-8, November 2005.
[8] Rafael C. Gon zalez, Richard E. Woods, “Digital Image Processing”, 2nd edition, Prentice Hall, 2002. [9]
Rajesh Garg et al., “Histogram Equalization Techniques for Image Enhancement”, IJECT, Vol. 2, Issue 1, pp. 107-111, March 2011.
[10]
Stephen M.Pizer et al.,“Adaptive Histogram Equalization and Its Variations”, Computer Vision, Graphics, and Image Processing, Vo l. 39, pp.355368, 1987.
[11] Sunita Dhariwal, “Co mparative Analysis of Various Image Enhancement Techniques”, IJECT, Vo l.2, Issue 3, pp. 91-95, September 2011.
[5] Hasanul Kabir et al., “Brightness Preserving Image Contrast Enhancement Using Weighted Mixture of Global and Local Transformat ion Functions”, The International Arab Journal of Information Technology, Vo l. 7, No. 4, pp. 403-410, October 2010. [6] Ho jat Yeganeh et al., “A Novel Approach for Contrast Enhancement Based on Histogram Equalization” International Conference on Co mputer and Co mmunicat ion Engineering, ICCCE, pp. 256 – 260, 13-15 May, 2008. [7] Hyunsup Yoon et al., “Image Contrast Enhancement based Sub-histogram Equalization Technique without Over-equalization Noise”, World Academy of Science, Engineering and Technology, Vol. 50, pp.176-182, 2009.
[12] Vinay Ku mar and Himani Bansal, “Perfo rmance Evaluation of Contrast Enhancement Techniques for Dig ital Images”, IJECT Vo l.2. Issue 1, pp. 23-27, March 2011. [13] WANG Zhiming and TAO Jianhua, “A Fast Implementation of Adaptive Histogram Equalizat ion”, International Conference on Signal Processing, ICSP, 2006. [14] Ratchakit Sakuldee and Somkait Udo mhunsakul, “Objective Performance of Co mpressed Image Quality Assessments”, International Journal of Electrical and Co mputer Engineering, vol. 2, no. 4, pp. 258-267, 2007.
APPENDIX 1 A IMA GE QUA LITY M ETERICS (IQM ) FOR IMA GE ENHANCEM ENT TECHNIQUES
Table 1.1:- For Image-1
IQM HPTs GHE LHE DSIHE
PSNR
NAE
NAE
AD
25.4987 25.6152 24.996
0.28146 0.26598 0.32442
1.42728 1.40393 1.62861
44.3106 40.842 54.9133
© 2012, IJARCSSE All Rights Reserved
Page | 248
Volume 2, Issue 3, March 2012
www.ijarcsse.com Table 1.2:- For Image-2
IQM HPTs GHE LHE DSIHE
PSNR
NAE
NAE
AD
26.9501 28.8908 26.6975
0.356505 0.117071 0.359612
0.969931 1.03166 1.07279
5.5082 17.4332 23.8343
APPENDIX 1B COMPARISON OF ORIGINA L AND ENHANCED IMA GES
Fig. 1.6:- Original and DSIHE Images-1 Fig. 1.2:- Original and GHE Images-1
Fig. 1.3:- Original and GHE Images-2
Fig. 1.4:- Original and LHE Images-1
© 2012, IJARCSSE All Rights Reserved
Page | 249
Volume 2, Issue 3, March 2012
www.ijarcsse.com
Fig. 1.5:- Original and LHE Images-2 Fig. 1.7:- Original and DSIHE Images-2
© 2012, IJARCSSE All Rights Reserved
Page | 250