Comparing Efficiency and Costs of Cloud Computing Models Daniel Gmach
Jerry Rolia
Ludmila Cherkasova
HP Labs Palo Alto, CA, USA
[email protected]
HP Labs Palo Alto, CA, USA
[email protected]
HP Labs Palo Alto, CA, USA
[email protected]
Abstract—Public and private clouds are being adopted as a costeffective approach for sharing IT resources. Customers acquire and release resources by requesting and returning virtual machines to the cloud. Different service models are proposed for virtual machine resource management. Some public cloud providers follow a t-shirt model for VM resource sizing. A second approach for resource management is based on a time share model. This paper compares the two approaches from the perspective of resource usage for both the service provider and workload owner. Using data from 312 customer applications, we show that the t-shirt model requires 40% more infrastructure than when a finer degree of resource sharing based on time varying resource shares is permitted. Keywords:resource sharing, virtualization, virtual machine sizing, cloud service models, data center efficiency
I.
INTRODUCTION
Organizations are increasingly obtaining some or all of their IT resources through service providers that host public and private clouds. When IT resources are obtained as-aservice from such clouds then fees must be charged for the resources. Most providers offer a fixed set of static configurations/sizes for VMs. The customer is charged on a per-VM/hr basis with greater charges for VMs with more resources. We refer to this as t-shirt sizing. The larger the VM you need to acquire the more you pay. Some resource providers only offer a static t-shirt sizing, where a workload is allocated a fixed number of VMs to satisfy the application’s demand. This static approach may result in significant resource overprovisioning, and hence higher resource costs. More advanced resource management approaches support a dynamic time varying number of VMs such that the customer only pays for what is needed. With this model, customers can manage their costs by acquiring and releasing VMs according to their own specific load patterns. In effect, a customer can change their “wardrobe of resources” based on need. This paper questions the efficiency of the t-shirt sizing model for both the static and dynamic resource management approaches as compared to a finer degree of resource sharing. These approaches charge customers on a per hour basis for resources they may not fully use. The service provider must pass the costs of unused resources to the customers. In this work, we assume the costs are passed onto customers and note that ad-hoc over-booking (over-assignment) of resources can lead to additional performance risks for customers.
Enterprise environments have historically improved utilization by offering finer control over the sharing of resources using a dynamic time share model. For example, operating systems have offered resource management support for resource groups with controlled time varying capacity. The CPU allocation for each group may adapt to load. We refer to this as time share sizing. Workloads with complementary demand patterns are identified and assigned to share a server. Based on this approach, automated workload consolidation methods can be used to find and assign workloads with complementary demand patterns to servers to improve utilization while reducing the likelihood of service level violations [6]. Current virtualized environments offer a fast, live virtual machine migration that can be used to moveVMs from servers with too much load to servers with smaller load if necessary. Time share sizing can be used to complement t-shirt sizing. Using data from 312 customer applications we show that a service provider must have more hardware to support customers with t-shirt sizing alone than if a finer degree of resource sharing and workload management is also employed. The costs for extra hardware must ultimately be borne by customers monetarily or in terms of performance risks. This paper is organized as follows. Section II presents several examples of t-shirt sizing as offered by infrastructure as a service cloud vendors today. Section III describes time share sizing in more detail. Section IV presents a study that compares the hardware requirements of the two approaches followed by related work in Section V. Summary and concluding remarks are offered in Section VI along with a description of our next steps. II.
T-SHIRT RESOURCE MANAGEMENT
This section describes t-shirt model infrastructure-as-aservice offerings and resource management methods. We consider t-shirt offerings similar to from Amazon Elastic Computing Cloud. Amazon refers to its VMs as instances. In general instances can be acquired and released on demand. Pricing is per hour, whether the full hour is used or not and regardless of CPU utilization. Each instance has an OS and application image, a certain number of virtual CPUs, and a certain amount of memory and disk space. Bandwidth charges are extra. There are micro, small, large, and extra large instances. Finally, there are also special instances such as high memory, high CPU instances, and instances for high performance computing.
The price per hour is roughly proportional to the quantity of resources in the instance. Amazon also offers auto-scaling and load balancer services that can be configured to add/remove instances based on a customer application’s needs. A. T-shirt Model Resource Management Resource management for the t-shirt model is straightforward. Each VM instance and each server has a size in terms of CPU and memory. An additional VM instance can be placed on a server if there are sufficient available CPU and memory resources. B. T-shirt Costs The total cost of a resource pool includes the acquisition costs for facilities, physical IT equipment and software, power costs for operating the physical machines and facilities, and administration costs. In this paper, we focus on server costs alone. Typically, acquisition costs are considered with respect to a three year time horizon and reclaimed according to an assumed rate for each costing interval. In our case study consider a three week costing interval and apportion costs based on a three year time horizon for the IT infrastructure. The cost of a resource pool is the product of the number of servers required for the pool and the cost per server. The resource pool has a certain capacity in terms of CPU and memory. For the static t-shirt resource management approach the cost per hour of a VM corresponds to its portion of the pool’s capacity according to its specified capacity attributes, e.g., one half a core and 2 GB of memory. For the dynamic tshirt resource management approach fewer servers are required for the pool so that the costs per VM we compute are reduced. III.
TIME SHARE MODEL
This section describes resource management for the time share model. The approach we describe is an integrated closed loop approach with management actions that occur at multiple time scales. The approach is more complex than resource management for the t-shirt model both in terms of resource allocation and in terms of apportioning costs. A. Time Share Resource Management For time share resource management, we employ a consolidation engine that minimizes the number of servers needed to host all workloads while satisfying their time varying resource demand requirements. The workload consolidation engine arranges VM workloads within a resource pool based on resource requests. The consolidation engine operates in configurable planning intervals, e.g., every four hours, and dynamically initiates workload migrations at the start of each interval consolidating servers such that their predicted resource demands will be met. In each interval it will consolidate workloads onto a minimum set of servers and power down unused servers to save power and associated cooling costs as described in [11]. B. Time Share Costs When multiple virtual machines with different resource requirements are deployed on the servers in a resource pool, one of the challenging questions to address is how to design a chargeback model and apportion the cost of the server
resources among the hosted workloads. A common sense approach for establishing the cost of providing a service is to extend the usage-based model, i.e., from virtualization layer monitoring information one can derive average resource usage per workload for a costing interval, e.g., three weeks, and then the physical server costs can be split up respectively. Currently, many service providers employ such simplified usage–based accounting models [1─4]. However, the relationship between workloads and costs is actually more complex. Some workloads may have a large peak to mean ratio for demands upon server resources. We refer to such workloads as bursty. A pool that aims to consistently satisfy the demands of bursty workloads will have to limit the number of workloads assigned to each server. This affects the number of servers needed for a resource pool. Further, server resources are rarely fully utilized even when workloads are tightly consolidated and all servers are needed. Even though many services can be assigned to a server, some portion of the resources remain unused over time. The amount of unused resources may depend on workload placement/consolidation choices and these choices may change frequently. The costs of such unallocated resources must be apportioned across workloads, but it should be done in a fair and predictable way. For the time share approach we use a novel model introduced and analyzed in [11]. IV.
CASE STUDY
The goal of this case study is to compare the quantity of infrastructure and per-workload costs incurred for both the tshirt and time share models. We consider the following cases: Static t-shirt sizing with a small set of fixed size VMs. The number of VMs per workload is chosen to satisfy the workload’s peak demand. Dynamic t-shirt sizing. The number of fixed size VMs can vary over time on an hourly basis. Static time share sizing with a fixed number of VMs that have time varying capacity. Only one consolidation is performed. It aims to minimize the number of servers while minimizing service level violations. Dynamic time share sizing with a fixed number of VMs that have a time vary capacity. Consolidation with automated workload migration is performed every 4 hours to reduce the peak number of servers and to minimize service level violations. The case study makes several simplifying assumptions. We assume that all workload demands are known in advance. For tshirt sizing this lets us know exactly how many instances are needed. For time share sizing this yields consolidation workload placements that are known to avoid service level violations. We note that in real systems workload prediction methods [5] and additional unallocated server headroom [14] are often used to overcome unexpected rises in demand. Furthermore, we assume that the workloads we consider can be partitioned in a way that they are supported by multiple VM instances. We do not consider additional resource demands introduced by the operating system or the virtualization layers or by inter-instance communication when partitioning a workload across many VM instances. These overheads are likely to negatively affect the t-shirt model more than the time share model so our assumptions are unlikely to affect our conclusions.
To evaluate the effectiveness of the VM sizing approaches for cloud, we obtained three weeks of workload trace data for 312 workloads from one HP customer data center. The workloads are described and characterized in detail in [11]. We define CPU capacity and CPU demand in units of CPU shares. A CPU share denotes one percentage of utilization of a processor with a clock rate of 1 GHz. A scale factor adjusts for the capacity between servers with different processor speeds or architectures. For example, the servers with 2.2 GHz CPUs in our case study were assigned 220 shares. We note that the scaling factors are only approximate; the calculation of more precise scale factors is beyond the scope of this paper. The memory usage is measured in GB. We consider the following resource pool configuration: each server consists of 24 x 2.2GHz processor cores, 96 GB of memory, and two dual 10 Gb/s Ethernet network interface cards for network traffic and virtualization management traffic, respectively. For the t-shirt sizing cases we chose four instance configurations—small, medium, large, and extra large. A small instance has 2048 MB main memory and has half a physical CPU assigned, which corresponds to 110 CPU shares. The medium, large and extra large instances have twice, four times and eight times the amount of resources assigned, respectively. We note that the considered physical servers are able to run 48 small instances, 24 medium, 12 large, or 6 extra large instances. For the time share cases each workload is associated with a single instance. The instance is given a time varying capacity that is sufficient to handle its CPU and memory load. A. Static T-shirt Sizing For the static t-shirt cases, for each workload, the number of required instances is chosen based on the workload’s peak CPU and memory demands over the three weeks. For example, a workload with peak resource demands of 300 CPU shares and 4GB of memory requires three small instances. In general, the last instance is never fully utilized. The larger the instance size the more likely it is that overall resource utilization will be low. Using small, medium, large and extra large instances required 84, 87, 95, and 111 servers, respectively. The static approach does not really share resources and represents a worst case scenario as there is no benefit achieved from statistical multiplexing. The larger the instance size that is used, the more wasted resources there are in the resource pool. B. Dynamic T-shirt Sizing For the dynamic t-shirt cases we adjust the number of instances on an hourly basis. Computing resources are often rented by the hour in public clouds. That means, when renting a VM the consumer often pays for the hour, whether the VM is used for the full hour or not. The number of required instances for each workload per hour is determined by the peak resource demand of the workload in that hour as explained for the static t-shirt model. We assume that additional instances can be firedup and removed dynamically during run-time. A close analysis of the data shows that the difference between the peak and mean CPU shares for each workload is 44% of the average
demand. This large difference suggests there may be gains to be made by sharing resources.
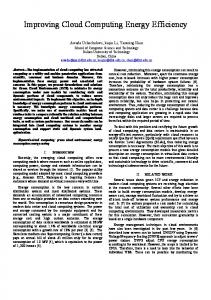
Figure 1. Number of active servers for the three weeks
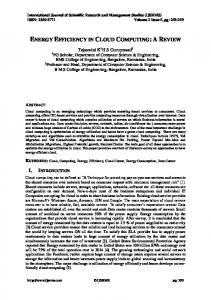
Figure 1 shows the numbers of servers needed per hour when the workloads under study exploit different VM instance sizes. The difference between peak and mean for all cases is smallest for the extra large instance case (10.4%) and greatest for the small instance case (31.9%). Not surprisingly, with the small t-shirt size the required physical infrastructure is better able to follow the load than with larger instances sizes. One may argue with the single size approach across all the workloads, which we demonstrated in the above evaluations. The criticism may come from the two simplifying assumptions. First, many large enterprise workloads can’t realistically have a large number of small instances without incurring too much overhead. Moreover, there are workloads that are not horizontally scalable at all, i.e., it might be impossible to serve the workload’s demands by using multiple small instances, and the workload should be allocated large/extra large VMs. Second, some small workloads should be hosted in the smaller sized VMs. To deal with these issues we make the assumption that if possible a workload should have 4 or fewer instances. We now introduce a mixed case where each workload uses the smallest instance size such that it does not have more than four instances. However, several workloads needed 5 extra large instances. The difference in mean and peak number of required servers for the cases over the three week period are shown in Figure 2. The smaller the instance size the bigger the difference between peak and mean. The mixed case has a slightly higher peak number of servers and slightly lower average number of servers than the large instance case. Though we assume it is infeasible for all the workloads to use small instances, allocation of resources associated with small instances yields the lowest peak and average number of servers. Finally, in Figure 2 we see that the dynamic mixed case uses almost half of the resources (40 servers) compared to the static small instance case, which required 84 servers. The static allocation of VMs is not an effective way to improve resource utilization and is not considered further. C. Time Share For the time share cases each workload is associated with a single instance. The instance has a time varying CPU capacity and memory sufficient to handle its load. For the static time
share case workloads are consolidated onto a number of servers once for the three week interval such that the likelihood of service violations is negligible. For the dynamic time share case, the consolidation is repeated every 4 hours; again, such that the likelihood of service violations is negligible and such that we minimize VM migrations. As we will see, this later case requires much fewer resources. However, it does require a more complex management infrastructure with automated support for VM migration. The number of hosts needed for the time share approach is the maximum number of hosts needed for the consolidation exercise. Figure 2 introduces results for the two time share cases. Recall for the time share case, workloads are consolidated once for the three week period. For the time share (4 hours) case the workloads are consolidated every 4 hours. The results of Figure 2 show that the time share case has a lower peak, and slightly higher average number of servers than the small instance case. It uses at peak 11% fewer servers than the small instance case and 40% fewer servers than the more realistic mixed case. This is because the time share case utilizes resources at the finest level of granularity. The peak and average for the time share case are the same because consolidation and workload placement only take place once for the three week period. The time share 4 hour case uses 60% fewer servers than the mixed case. It also uses significantly fewer resources than the small instance case because workload migration enables additional opportunities to exploit the benefits of statistical multiplexing. V.
RELATED WORK ON ON SIZING INFRASTRUCTURE AND COSTING EXERCISES
Cloud computing has emerged as a new and alternative approach for providing computing services. There are a variety of service models and pricing schemes employed by the cloud service providers. This can make it difficult for customers to compare the cloud computing services and select an appropriate solution. Recently, there have been efforts to analyze cloud service provider models and perform comparison studies. Garfinkel [7] and Walker [8] devote their attention to the performance analysis of Amazon AWS [1]. Some other industry reports [9][10] present a comparison of cloud service features across different companies such as Amazon and Rackspace. Ward [12] highlights the differences between public (AWS) and private cloud offerings (Ubuntu Enterprise Cloud). The interesting related discussion is offered in [13], where the authors discuss QoS issues and advanced resource allocation mechanisms (resembling the time-share approach that we promote in this paper) proposed as an efficient management solutions in private clouds. The authors discuss what would it take to make these mechanisms available in public clouds. VI.
SUMMARY AND CONCLUSIONS
The goal of this work has been to compare the impact of the granularity at which resources are offered to workloads upon the quantity of servers needed to support the workloads. Many infrastructure providers support t-shirt sizing, i.e., a certain number of fixed capacity VM configurations. Historically,
enterprise computing environments have exploited a finer degree of resource sharing for CPU and memory that we refer to as time share sizing. Our results have shown that a time share resource management approach uses 40% fewer servers to support the workloads in our cases study than the dynamic mixed t-shirt sizing case. This assumed a management method that re-consolidated workloads every three weeks. Such a process could be governed manually by operations staff. We also showed that if an automated consolidation process is employed every 4 hours then 60% fewer servers would be required than the dynamic mixed t-shirt sizing case. However, this requires additional management software complexity.
Figure 2. Capacity required for Time-share approach
REFERENCES [1] [2] [3] [4] [5]
[6] [7] [8] [9] [10] [11] [12] [13] [14]
Amazon web services. http://aws.amazon.com/ IBM Tivoli Usage and Accounting Manager Virtualization Edition. http://www-01.ibm.com/software/tivoli/products/usageaccounting/index.html HP Insight Dynamics: HP Virtual Server Environment. http://h18004.www1.hp.com/products/solutions/insightdynamics/vseoverview.html VMware: Virtualize Your Business Infrastructure. http://www.vmware.com/virtualization/ D. Gmach, J. Rolia, L. Cherkasova, and A. Kemper: Workload Analysis and Demand Prediction of Enterprise Data Center Applications. Proc. of the 2007 IEEE International Symposium on Workload Characterization (IISWC), Boston, MA, USA, September 27─29, 2007. D. Gmach, J. Rolia, L, Cherkasova, A. Kemper. “Resource pool management: Reactive versus proactive or let's be friends”, Computer Networks, pages 2905─2922, 2009. S. Garfinkel. “An Evaluation of Amazon s Grid Computing Services: EC2 , S3 and SQS”. Harvard University, Tech. Rep. TR-08-07. E. Walker. “Benchmarking amazon EC2 for high-performance scientific computing”. USENIX Login, 2008. Rackspace Cloud Servers versus Amazon EC2: Performance Analysis. http://www.thebitsource.com/featuredposts/rackspace-cloud-serversversus-amazonec2-performance-analysis/ VPS Performance Comparison. http://journal.uggedal.com/vpsperformance-comparison. D. Gmach, J. Rolia, L, Cherkasova: Resource and Virtualization Costs up in the Cloud: Models and Design Choices In Proc. of DSN’2011. J. S. Ward. “A Performance Comparison of Clouds: Amazon EC2 and Ubuntu Enterprise Cloud”. SICSA Demo FEST, 2009. A. Gulati, G. Shanmuganathan, A. Holler, I. Ahmad. “Cloud Scale Resource Management: Challenges and Techniques”. HotCloud, 2011. D. Gmach, J. Rolia, L. Cherkasova, G. Belrose, T. Turicchi, A. Kemper. “An Integrated Approach to Resource Pool Management: Policies, Efficiency and Quality Metrics”. In Proc. of the 38th Annual IEEE/IFIP International Conference on Dependable Systems and Networks (DSN). Anchorage, Alaska, USA, 2008.