Page 1 ... infrastructure solutions based on the Dell PowerEdge. C8220 and the
... Configuration of server nodes, chassis, and power supply units . ..... measured
for power; external network components were not included in the measurements.
Comparing the Power Efficiency of Modular Cloud Computing Systems This white paper compares the power efficiency of shared infrastructure solutions based on the Dell PowerEdge C8220 and the HP ProLiant SL230s Gen8.
Daniel Turner, Solutions Performance Analysis Dell | Enterprise Solutions Group
Comparing the Power Efficiency of Modular Cloud Computing Systems
Contents Introduction................................................................................................................................................................ 3 Key findings ................................................................................................................................................................ 3 Performance-per-watt............................................................................................................................... 3 Power efficiency .......................................................................................................................................... 3 Performance ................................................................................................................................................ 3 Methodology .............................................................................................................................................................. 3 Configuration of server nodes, chassis, and power supply units ..................................................................... 4 Performance............................................................................................................................................................... 4 Summary ..................................................................................................................................................................... 7 Appendix A — Test methodology ........................................................................................................................... 8 BIOS settings ................................................................................................................................................ 8 Operating system tuning ........................................................................................................................... 9 Power and temperature configuration ................................................................................................... 9 Appendix B — Server node firmware ..................................................................................................................... 9 Appendix C — SPECpower_ssj2008 ...................................................................................................................... 9
Tables Table 1.
Modular system chassis configurations........................................................................................... 4
Table 2.
Detailed configuration for server nodes used in the comparisons ............................................ 4
Table 3.
Server BIOS and firmware .................................................................................................................. 9
Figures Figure 1.
System power efficiency: overall ssj_ops per watt ....................................................................... 5
Figure 2.
Power usage by target load (percentage of CPU utilization) ...................................................... 6
Figure 3.
Active-Idle power ................................................................................................................................ 7
THIS WHITE PAPER IS FOR INFORMATIONAL PURPOSES ONLY, AND MAY CONTAIN TYPOGRAPHICAL ERRORS AND TECHNICAL INACCURACIES. THE CONTENT IS PROVIDED AS IS, WITHOUT EXPRESS OR IMPLIED WARRANTIES OF ANY KIND. © 2013 All rights reserved. Reproduction of this material in any manner whatsoever without the express written permission of Dell Inc. is strictly forbidden. For more information, contact Dell. Dell, the Dell logo, and PowerEdge are trademarks of Dell Inc. Intel and Xeon are registered trademarks of Intel Corporation in the U.S. and other countries. Microsoft, Windows, and Windows Server are either trademarks or registered trademarks of Microsoft Corporation in the United States and/or other countries. SPEC and the benchmark name SPECpower_ssj are registered trademarks of the Standard Performance Evaluation Corporation. For more information about SPECpower, see www.spec.org/power_ssj2008/. Other trademarks and trade names may be used in this document to refer to either the entities claiming the marks and names or their products. Dell disclaims proprietary interest in the marks and names of others. September 2013 | Version 1.0
ii
Comparing the Power Efficiency of Modular Cloud Computing Systems
Introduction This study compares the performance and power efficiency of two modular cloud computing systems — the Dell PowerEdge C8220 and the HP ProLiant SL230s Gen8 (in the SL6500 chassis). Both systems were configured with the same processor, hard drive, and memory specifications. Based on the test results, the Dell PowerEdge C8220 shows a marked advantage in performance-per-watt over its direct competitor, the HP ProLiant SL230s Gen8. This paper documents the methodologies and detailed results of the tests performed on these systems.
Key findings Performance-per-watt
The Dell PowerEdge C8220 has a performance-per-watt advantage of up to 11% over the HP ProLiant SL230s Gen8.
Power efficiency
The Dell PowerEdge C8220 uses up to 6% less power at 100% CPU utilization than the ProLiant SL230s Gen8.
The PowerEdge C8220 uses up to 12% less power at system idle than the HP ProLiant SL230s Gen8.
Performance
The Dell PowerEdge C8220 has a up to 3% performance advantage in ssj_ops over the ProLiant HP SL230s Gen8.
Methodology SPECpower_ssj2008 is an industry standard benchmark created by the Standard Performance Evaluation Corporation (SPEC®) to measure a server’s power and performance across multiple utilization levels. Appendix A — Test methodology provides detailed report data that supports the test results. In order to ensure an apples-to-apples comparison, the two systems were configured as similarly as possible. The Dell PowerEdge system uses the C8000 chassis, while the HP ProLiant system uses the SL6500 Scalable System chassis. ®
®
Each system had eight Intel Xeon E5-2600 server nodes per chassis, configured as similarly as possible (PowerEdge C8220 server nodes in the Dell system, and ProLiant SL230s Gen8 server nodes in the HP system), with four Platinum-rated power supplies per chassis. ®
®
Both systems ran Microsoft Windows Server 2008 R2 SP2 Enterprise Edition on each of eight server nodes, ® with the Oracle HotSpot 1.6_30 Java Virtual Machine installed. All components in each solution were updated to with the latest firmware, driver, and software versions available at the time of testing. See Appendix A — Test methodology for more information.
3
Comparing the Power Efficiency of Modular Cloud Computing Systems
Configuration of server nodes, chassis, and power supply units Each chassis was configured with eight server nodes and the maximum number of supported Platinum-rated power supplies. Table 1. Modular system chassis configurations Dell PowerEdge
HP ProLiant
Chassis
PowerEdge C8000
ProLiant SL6500 Scalable System
Server nodes
8 x PowerEdge C8220
8 x ProLiant SL230s Gen8
Power supply quantity/rating
4 x 1400W Platinum-rated (Dell P/N 0FRVCP)
4 x 1200W Platinum-rated (HP P/N 570451-101)
The server nodes in the two systems were configured as similarly as possible, with comparable processors, hard drives, and memory. Both systems used integrated onboard hard drive controllers. Table 2 summarizes the server node configurations. Table 2. Detailed configuration for server nodes used in the comparisons PowerEdge C8220
ProLiant SL230s Gen8
Processors
2 x Intel Xeon E5-2660
2 x Intel Xeon E5-2660
Physical/logical cores
16/32
16/32
Memory
8 x 8GB Dual Ranked PC3-12800R, RDIMMs
8 x 8GB Dual Ranked PC3-12800R, RDIMMs
Hard drives
2 x 1TB 7.2K SATA
2 x 1TB 7.2K SATA
Network
Onboard dual-port Intel I350 Gigabit Network Connection
Onboard HP Ethernet 1Gb dual-port 361i Adapter
Storage controller
Integrated SATA Controller
Integrated HP H220i SAS Controller
The server nodes were set to their BIOS default settings, except for prefetcher settings as disclosed in Appendix B — Server node firmware. All server nodes ran Windows Server 2008 R2 SP2 Enterprise Edition with all default settings, except for the settings necessary for the benchmark, as shown in the following section.
Performance In this comparison, each system was tested only with its nodes, enclosure, and internal enclosure components measured for power; external network components were not included in the measurements. The performance-to-power ratio of the target loads is a measurement of the number of ssj_ops (throughput) processed per watt of power consumed. The more ssj_ops the system under test can produce with one watt of power, the better the efficiency of the system. The SPECpower_ssj2008 metric is calculated as the sum of all ssj_ops scores for all target loads, divided by the sum of all power consumption averages (in watts) for all target loads, including the active idle measurement interval.
4
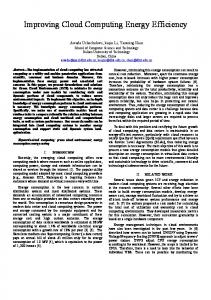
Comparing the Power Efficiency of Modular Cloud Computing Systems As shown in Figure 1, the Dell modular system is 11% more power efficient than the HP modular system.
Modular System Power Efficiency Higher is Better
1,500
2,000
2,500
Overall ssj_ops per watt
1,000
Figure 1.
1
3,000
3,500
4,000
3,463
3,122
System power efficiency: overall ssj_ops per watt
1
Required SPEC disclosure information: PowerEdge C8220 modular system scores: (9,429,847 ssj_ops and 2,266 W) @ 100% target load and 3,463 overall ssj_ops/watt vs. ProLiant SL230sGen8 modular system scores: (9,200,661 ssj_ops and 2,903 W) @ 100% and 3,122 overall ssj_ops/watt. Comparison based on results by Dell Labs June 2013. SPEC® and the benchmark name SPECpower_ssj® are registered trademarks of the Standard Performance Evaluation Corporation. For more information about SPECpower, see www.spec.org/power_ssj2008/.
5
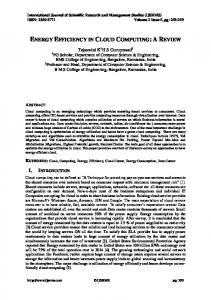
Comparing the Power Efficiency of Modular Cloud Computing Systems SPECpower_ssj2008 also includes a measurement of power while the servers are at varying levels of target utilization. Across all target load levels, the Dell modular system uses less energy than the HP modular system, as shown in Figure 2.
Power Usage by Target Load, in Watts 0
500
1,000
Lower is Better 1,500 2,000 2,500
Avg. Power at 100% Avg. Power at 90% Avg. Power at 80%
PowerEdge C8220
Avg. Power at 70%
ProLiant SL230s
Avg. Power at 60% Avg. Power at 50% Avg. Power at 40% Avg. Power at 30% Avg. Power at 20% Avg. Power at 10% Figure 2.
2
Power usage by target load (percentage of CPU utilization)
2
Required SPEC disclosure information: PowerEdge C8220 modular system scores: (9,429,847 ssj_ops and 2,266 W) @ 100% target load and 3,463 overall ssj_ops/watt vs. ProLiant SL230sGen8 modular system scores: (9,200,661 ssj_ops and 2,903 W) @ 100% and 3,122 overall ssj_ops/watt. Comparison based on results by Dell Labs June 2013. SPEC® and the benchmark name SPECpower_ssj® are registered trademarks of the Standard Performance Evaluation Corporation. For more information about SPECpower, see www.spec.org/power_ssj2008/.
6
Comparing the Power Efficiency of Modular Cloud Computing Systems Another metric SPECpower_ssj2008 uses is an Active-Idle power measurement, where the system is ready to do work, but has not done work for some period of time. The HP modular system uses more power here as well, giving the Dell modular system a power savings of 14% at idle, shown in Figure 3.
Active Idle Power Lower is Better 0
100
200
400
500
600
700
567
Active Idle Power Figure 3.
300
647
Active-Idle power
3
Summary As energy costs rise, forward-looking customers will increasingly use power-efficiency as a factor in the decision to purchase cloud computing systems. The superior performance-per-watt ratio of the Dell PowerEdge C8220, when compared to its competitors, means that no sacrifice needs to be made in order to achieve power-efficient performance.
3
Required SPEC disclosure information: PowerEdge C8220 modular system scores: (9,429,847 ssj_ops and 2,266 W) @ 100% target load and 3,463 overall ssj_ops/watt vs. ProLiant SL230sGen8 modular system scores: (9,200,661 ssj_ops and 2,903 W) @ 100% and 3,122 overall ssj_ops/watt. Comparison based on results by Dell Labs June 2013. SPEC® and the benchmark name SPECpower_ssj® are registered trademarks of the Standard Performance Evaluation Corporation. For more information about SPECpower, see www.spec.org/power_ssj2008/.
7
Comparing the Power Efficiency of Modular Cloud Computing Systems
Appendix A — Test methodology BIOS settings Available BIOS settings differed between the two manufacturers. Each server node was tested as it was shipped from the factory, with default settings. For both servers, Intel Turbo Boost Technology was enabled by default, and memory speed was left at the default value of 1600 MHz. The HP ProLiant SL230s Gen8 server nodes defaulted to handling their own power management rather than leaving that function to the operating system, while the Dell PowerEdge C8220 nodes use OS Control as the default power management mode. As SPECpower_ssj2008 uses a Java workload, and the JVM has its own prefetchers, the Prefetch settings on both systems were disabled in BIOS as noted below. For the Dell PowerEdge C8220 server nodes, the following settings were used, with the non-default settings marked with an asterisk (*):
Adjacent Cache Line Prefetch disabled*
Hardware Prefetcher disabled*
DCU Streamer Prefetcher disabled*
DCU IP Prefetcher enabled
System Profile set to Performance Per Watt (DAPC)
Turbo Boost enabled
C1E Enabled
C States enabled
Memory Patrol Scrub set to Enabled
Memory Refresh Rate set to 1x
Memory Operating Voltage set to Auto
For the HP ProLiant SL230s Gen8 server nodes, the following settings were used, with the non-default settings marked with an asterisk (*):
8
HP Power Regulator set to HP Dynamic Power Savings Mode
Energy/Performance Bias set to Balanced Performance
Minimum Processor Idle Power Core State set to C6 State
Minimum Processor Idle Power Package State set to Package C6 (non-retention) State
HW Prefetch Disabled in BIOS*
Adjacent Sector Prefetch Disabled in BIOS*
DCU Prefetcher Disabled in BIOS*
Dynamic Power Savings Mode Response set to Fast in BIOS
Comparing the Power Efficiency of Modular Cloud Computing Systems
Collaborative Power Control Enabled in BIOS
Intel Turbo Boost enabled
DIMM Voltage Preference set to Optimized for Power in BIOS
Operating system tuning On each server node, Windows Server 2008 R2 SP1 Enterprise Edition was installed. The Windows Power Saver plan was selected, and the hard disk and display were set to turn off after one minute. Using the local security settings console, "lock pages in memory" was enabled for the user running the benchmark.
Power and temperature configuration Yokogawa WT210 Digital Power Meters were used for the actual power measurements of the solutions. The WT210 units used were each calibrated less than a year prior to the test date to ensure accurate power consumption measurements. Power measurements were measured and recorded by the SPECpower_ssj2008 benchmark. To ensure a fair comparison, the systems were mounted near each other in the test racks. The two solutions were run in environments with a temperature difference of less than 1 degree Celsius.
Appendix B — Server node firmware The latest publically available BIOS and firmware, as of the time of testing, were used in this comparison. Table 3. Server BIOS and firmware Driver/firmware versions
Dell PowerEdge C8220
HP ProLiant SL230s Gen8
System BIOS
1.1.19
P75 05/13/2013
Integrated management controller firmware
2.0.3
1.22
Appendix C — SPECpower_ssj2008 See attachments:
9
C8220-SPECpowerssj2008
SL230-SPECpowerssj2008