Comparing Feature-Based Classifiers and Convolutional Neural Networks to Detect Arrhythmia from Short Segments of ECG Fernando Andreotti∗ , Oliver Carr∗ , Marco A. F. Pimentel, Adam Mahdi, Maarten De Vos Institute of Biomedical Engineering, University of Oxford, Oxford, United Kingdom ∗
These authors contributed equally to this work
Abstract The diagnosis of cardiovascular diseases such as atrial fibrillation (AF) is a lengthy and expensive procedure that often requires visual inspection of ECG signals by experts. In order to improve patient management and reduce healthcare costs, automated detection of these pathologies is of utmost importance. In this study, we classify short segments of ECG into four classes (AF, normal, other rhythms or noise) as part of the Physionet/Computing in Cardiology Challenge 2017. We compare a state-of-the-art feature-based classifier with a convolutional neural network approach. Both methods were trained using the challenge data, supplemented with an additional database derived from Physionet. The feature-based classifier obtained an F1 score of 72.0% on the training set (5-fold cross-validation), and 79% on the hidden test set. Similarly, the convolutional neural network scored 72.1% on the augmented database and 83% on the test set. The latter method resulted on a final score of 79% at the competition. Developed routines and pre-trained models are freely available under a GNU GPLv3 license.
1.
Introduction
Electrocardiogram (ECG) recording is an important clinical tool for detecting cardiac disorders. A typical ECG recording lasts from a few seconds (e.g. during a cardiologist visit) to multiple days using a Holter device. The number and position of lead electrodes also varies from one or two channels (on a wearable or smartphone device) to greater numbers (if a more detailed depiction of the heart activity is needed). Despite ECG being a well-established method, the classification of arrhythmic or ectopic episodes is generally performed in a manual or semi-automated manner by cardiologists, who review each signal in the search for abnormalities. The process is therefore expensive, prone to mistakes, and suffers from inter- and intra-rater variability. Between the pathologies
Computing in Cardiology 2017; VOL 44
Page 1
screened, atrial fibrillation (AF) is the most prevalent cardiac arrhythmia and can occur in sustained or intermittent episodes. These two states make the diagnosis of AF challenging, particularly when only a few seconds of recording is available. A number of approaches for automated classification of normal/abnormal ECG signals have been proposed. Typically, they use various hand-engineered features including heart rate variability (HRV) metrics [1] and morphological characteristics (e.g. P-wave absence) [2]. Deep learning methods are increasingly popular due to their ability to automatically learn features at multiple levels of abstraction (i.e. layers). This allows the system to learn complex functions by mapping the input to the output directly from data without depending on hand-engineered features [3]. Those methods have been successfully applied in the field of computer vision, however applications to 1-dimensional biomedical signals (e.g. ECG) have just started to emerge in the literature. For example, deep neural networks have been used in ECG anomaly detection on Physionet databases [4, 5]. Recently, Rajpurkar et al. [6] proposed a much deeper network, which discriminated 12 types of heart conditions, normal rhythm and noisy recordings. Their work was validated using a large dataset of 64,121 ECG signals from 29,163 patients. In this study, we benchmark a feature-based and a deep learning approach in classifying short ECG segments as proposed by the Physionet/Computing in Cardiology Challenge 2017 [7] (henceforth referred to as “Challenge”).
2.
Materials
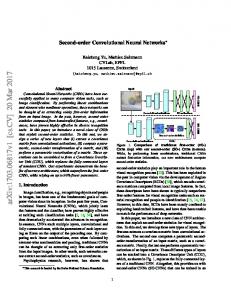
The training dataset for the Challenge (denoted TRAINDB) consisted of 8,528 short single lead ECG segments, as described in [7]. In order to improve the training of classifiers we reduced the class imbalance in the TRAINDB by increasing the number of AF and noisy recordings. The resulting dataset we denote by AUG-DB, see Figure 1. For this purpose, we carefully selected 2,000 10-s ECG segments with AF from different Physionet databases [8] (INCART-DB, LTAFDB, AFDB). The number of noisy
ISSN: 2325-887X DOI:10.22489/CinC.2017.360-239
To account for the varying length of the signals, in a second approach, we divided the preprocessed ECG signals into 10-second segments with 50% overlap. First, we computed the features based on each segment (along each recording), and then computed the summary statistics such as mean standard deviation and min/max (for each feature), which were subsequently used in combination with bagged trees and neural network.
# Records
6,000 TRAIN-DB AUG-DB
4,000
2,000
0
A
N
O
∼
Classes
3.2.
Figure 1. Class distribution for TRAIN-DB and AUG-DB. Classes include atrial fibrillation (A), normal rhythm (N), other rhythm (O), and noisy recording (∼). recordings was increased by time-reversing the existing 284 noisy segments and simulating 2,000 additional ones (using the FECGSYN toolbox [9]). The test set (TESTDB) consisted of a subset of the 3,658 hidden records [7].
3.
Methods
Now we briefly describe the feature-based and deep learning approaches used in the Challenge.
3.1.
Feature-based approach
The feature-based approach was implemented in R with the WFDB Toolbox [8, 10] as the only deMatlab pendency. Each ECG segment was preprocessed using 10th order bandpass Butterworth filters with cut-off frequencies of 5Hz and 45Hz (narrow band) and 1Hz to 100 Hz (wide band). We used four well-known QRS detectors to each narrow-band preprocessed ECG: gqrs [10], PanTompkins (jqrs) [11], maxima search [12], and matched filtering. To generate a reliable consensus of QRS detection, we applied a voting system based on kernel density estimation, from which we extracted features for atrial and ventricular activity using HRV metrics and signalquality indices. Following [13], we calculated classical time domain, frequency domain, and non-linear HRV metrics as well as new metrics based on clustering of beats on Poincar´e plots. We obtained a range of signal-quality indices [14, 15], including the bSQI, which compares the outputs of multiple QRS detectors with agreement indicating high quality signals. In addition to features based on QRS detections, beats were delineated from wide band preprocessed signals using the ecgpuwave [16] for extracting morphological features such as P-wave power and QT-interval. A total of 169 features were obtained and applied on a supervised learning strategy. We combined an ensemble of bagged trees (50 trees) and a multilayer perceptron (2-layer, 10 hidden neurons, feed-forward) in a consensus classifier by averaging the probabilities for each class in each record.
Deep learning approach
Traditional deep supervised learning techniques include Convolutional and Recurrent Neural Networks (in short CNN and RNNs, respectively). CNNs are particularly prevalent in the field of computer vision due to properties such as translation invariance, parameter sharing and sparse connectivity, which make their training computationally efficient [17]. One drawback of CNNs is the fact they operate on grid-like structures (e.g. images or fixed segment windows). A recent development that facilitated training and improved accuracy of deeper CNNs was the advent of Residual Networks (ResNet) [18]. ResNets use shortcut identity connections, to make feature maps from shallower layers available at later stages, which has been compared to a feed-forward long-short term memory (a subclass of RNNs) [19] without gates [20]. Recently, Rajpurkar et al. [6] applied a 34-layer ResNet to classify 30-s single lead ECGs segments into 14 different classes. This method accepts as an input a raw ECG segments and outputs the classifications without requiring hand-engineered features. Here, we use the ResNet approach by [6, 18] on both TRAIN-DB and AUG-DB. As input we provided zero mean unit variance raw ECG signals. Since CNNs require a fixed window size, we truncated these segments to the first minute. We also tested other variations of the proposed model by changing the depth, reducing the number of filters at each layer, and padding the signals to 30 s. In an attempt to provide more immediate information to the network we used a simple ECG template subtraction algorithm (developed in Matlab [9]) for cancelling QRS-T activity from ECG segments. The resulting residual together with original signals are then provided to the network. The proposed deep learning models were developed in Python 3.5 using Keras framework with Tensorflow as backend.
3.3.
Experiments
We used a 5-fold cross-validation procedure to assess the performance of the proposed methods. To avoid that the algorithmic performance is evaluated on the artificial data, the training/validation split was done as follows. First, the 5-folds were split on the TRAIN-DB, one fold being held as the validation split. Second, the whole AUG-
Page 2
Table 1. Performance of the approaches for the Challenge, variations are specified by number of convolutional filters per layer (CF), number of layers (L) and segment length (SEG). Unless stated otherwise, ResNets follow the model in [6]. Abreviations: normal rhythm (N), atrial fibrillation (A), other rhythm (O), noisy segment (∼) and not available (n.a.). Validation on training (%) Set N A O ∼ TRAIN-DB 90.6 72.1 74.8 50.5 TRAIN-DB 89.9 76.8 73.7 66.0 AUG-DB 90.2 65.7 69.8 64.0 TRAIN-DB 82.6 46.6 60.0 60.2 AUG-DB 88.5 67.7 66.6 65.6 AUG-DB 89.6 65.3 69.1 0.0
Description Feature-based approach (no segmentation) Feature-based approach (10 s segments) ResNet (original 34 L, 30s SEG) ResNet (16 CF, 60s SEG) ResNet (16 CF, 60s SEG) ResNet (16 CF, 34 L, 30s SEG, no noise)
1 Morphology Signal Quality Features Features
0.5
0 Non-linear Features
−0.5
Time and Frequency Features
Non-linear Features
Signal Quality Features
Morphology Features
−1
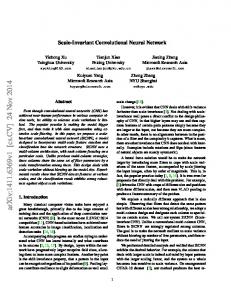
Figure 2. Correlations amongst proposed features using Kendall’s τb coefficient. Blank spaces represent nonsignificant ( p > 0.05) or weak correlations ( |τb | < 0.2). DB was added to the training split. Following the Challenge scoring system, results are reported as F1 -score for each individual class and mean F1 across all classes.
4.
Results
The results of cross-validation on the TRAIN-DB (or AUG-DB) as well as official test results (on TEST-DB) are shown in Table 1. Figure 2 illustrates the correlations among the 169 features used. Our best performing ResNet approach for the TEST-DB was chosen as final submission resulting on a final score of F1 = 79 %.
5.
Results for TEST-DB (%) N A O Total 89 80 69 79 90 77 68 78 n.a. n.a. n.a. n.a. 92 70 75 79 93 78 78 83 71 41 43 52
beats. All these factors affect the derived HRV metrics. Similarly, morphological features require ECG delineation, which is also prone to errors. Although we computed a wide range of features, many of those are correlated with each other (see Figure 2).
Correlation (τb )
Time and Frequency Features
Total 72.0 76.6 72.4 62.4 72.1 56.0
Discussion
The calculation of hand-engineered ECG features is heavily influenced by the choice of preprocessing steps including the application of low and high-pass filters, QRS detectors and potential adjustments for ectopic or missed
Deep learning methods benefited from the augmented dataset. Results for ResNet with 16 convolutional filters per layer increased from 62.4% to 72.1% on crossvalidation (see Table 1). However, since our augmented dataset might be labelled inconsistently with the original training set, further inclusion of augmented data did not improve the results. Feature-based classifiers did not benefit from augmenting the training set (results not shown). In order to comply with the 50 MB entry size limit of the Challenge, we modified the model from [6] by reducing the number of filters at each layer to 16, reducing the number of parameters approximately from 13.5 to 1.5 million. Table 1 shows that despite lower accuracy during training, deep learning methods scored higher on the TEST-DB compared to the feature-based approach. The removal of 10 layers of the best performing method on the Challenge leads to a decrease the validation results to F1 = 69.4%, whereas the addition of 10 layers improves it to F1 = 75.6%. The inclusion of atrial activity residuals improved the performance to F1 = 74.4%. Our final score using on the Challenge was 4% worse than the first place, which indicates that training and/or model can be improved. The advantage of deep learning methods is that they do not require hand-engineered features and perform nonlinear operations on a higher level of abstraction. Additionally, the availability of pre-trained models facilitates the reproduction of those approaches, which can then be fine-tuned to other databases/scenarios. Drawback of such methods is that they are computationally expensive and require large datasets for training. Due to the multiple layers of abstraction, the interpretation of the operations performed by the network during classification is yet to be achieved. The model used in this study (proposed by Rajpurkar et al. [6]) relies on Residual Network architecture for ECG classification. Despite the interesting application
Page 3
and large dataset used, the manuscript lacks details on how the cross validation was performed and how the data was exactly annotated. Moreover, it fails to justify some of their model choices e.g. network architecture, weight initialisation function, number of layers and filter. Further works should benchmark how influential these parameters are for the given task. The reported disagreement among experts in annotating the data ([7]) was possibly due to the variable length of segments. This lead to an inconsistent noise classification and annotating the normal segments as “others” because of a single ectopic beat. Our results suggested that the low number of noisy segments (see Figure 1) made the data augmentation necessary. Due to the problems with the annotation of noisy segments, the results for this class were omitted during the Challenge’s test phase. By ignoring noisy segments during training, we noticed a clear decrease in performance (“no noise” in Table 1). Surprisingly, the final competition ranking differed significantly from the ranking during the test phase. This suggests that the split for the TEST-DB was sub-optimal and not representative of the method’s performance.
[6]
6.
[13]
Conclusion
We have presented a comparison of a feature-based and a deep learning approach to classify rhythms from short ECG segments. Our results show that deep learning algorithms are capable of classifying short ECG recordings. The algorithms and models are available open-source under a GNU GPLv3 license at https://github.com/ fernandoandreotti/cinc-challenge2017.
[7]
[8]
[9]
[10] [11] [12]
[14]
[15]
[16]
Acknowledgements FA and AM are supported by the EPSRC grant EP/N024966/1. OC thanks RCUK Digital Economy Programme grant number EP/G036861/1 for its support.
[17]
References
[18]
[1]
[19]
[2]
[3] [4]
[5]
Bettoni M, Zimmermann M. Autonomic Tone Variations Before the Onset of Paroxysmal Atrial Fibrillation. Circulation 2002;105:2753–2759. Censi F, Corazza I, Reggiani E, Calcagnini G, Mattei E, Triventi M, Boriani G. P-wave Variability and Atrial Fibrillation. Sci Rep 2016;6:26799. Bengio Y, et al. Learning deep architectures for ai. Foundations and trends in Machine Learning 2009;2(1):1–127. Kiranyaz S, Ince T, Gabbouj M. Real-Time Patient-Specific ECG Classification by 1-D Convolutional Neural Networks. IEEE Trans Biomed Eng 2016;63(3):664–675. Rahhal MA, Bazi Y, AlHichri H, Alajlan N, Melgani F, Yager R. Deep learning approach for active classification of electrocardiogram signals. Inf Sci 2016;345:340–354.
[20]
Rajpurkar P, Hannun AY, Haghpanahi M, Bourn C, Ng AY. Cardiologist-Level Arrhythmia Detection with Convolutional Neural Networks. arXiv170701836 2017;. Clifford GD, Liu C, Moody B, Silva I, Li Q, Johnson AEW, Mark RG. AF Classification from a Short Single Lead ECG Recording: the PhysioNet Computing in Cardiology Challenge 2017. In Computing in Cardiology. Rennes (France), 2017; . Goldberger AL, Amaral LA, Glass L, Hausdorff JM, Ivanov PC, Mark RG, Mietus JE, Moody GB, Peng CK, Stanley HE. PhysioBank, PhysioToolkit, and PhysioNet: components of a new research resource for complex physiologic signals. Circulation 2000;101(23):E215—-E220. Behar J, Andreotti F, Zaunseder S, Li Q, Oster J, Clifford GD. An ECG Model for Simulating Maternal-Foetal Activity Mixtures on Abdominal ECG Recordings. Physiol Meas 2014;35(8):1537–1550. Silva I, Moody GB. An Open-source Toolbox for Analysing and Processing PhysioNet Databases in MATLAB and Octave. JORS 2014;2(1):e27. Johnson AE, Behar J, Andreotti F, Clifford GDG, Oster J. Multimodal heart beat detection using signal quality indices. Physiol Meas 2015;36(8):1665–77. Sameni R. The Open-Source Electrophysiological Toolbox (OSET), 2010. URL http://www.oset.ir. Acharya UR, Joseph KP, Kannathal N, Lim CM, Suri JS. Heart rate variability: A review. Med Biol Eng Comput 2006;44(12):1031–1051. Li Q, Mark RG, Clifford GD. Robust heart rate estimation from multiple asynchronous noisy sources using signal quality indices and a Kalman filter. Physiol Meas 2008; 29(1):15–32. Andreotti F, Grasser F, Malberg H, Zaunseder S. NonInvasive Fetal ECG Signal Quality Assessment for Multichannel Heart Rate Estimation. IEEE Trans Biomed Eng 2017;(accepted). Jane R, Blasi A, Garcia J, Laguna P. Evaluation of an automatic threshold based detector of waveform limits in Holter ECG with the QT database. In Computing in Cardiology. IEEE, 1997; 295–298. Goodfellow I, Bengio Y, Courville A. Deep Learning. MIT Press, 2016. ISBN 9780262337373. He K, Zhang X, Ren S, Sun J. Deep Residual Learning for Image Recognition. arXiv151203385 2015;7(3):171–180. Hochreiter S, Schmidhuber J. Long Short-Term Memory. Neural Comput 1997;9(8):1735–1780. Schmidhuber J. Microsoft wins imagenet 2015 through highway net (or feedforward lstm) without gates, 2015. URL http://people.idsia.ch/˜juergen.
Address for correspondence: Fernando Andreotti
[email protected] Institute of Biomedical Engineering Department of Engineering Science University of Oxford
Page 4