Comparing four technologies for measuring postural micromovements during monitor engagement Harry J Witchel Brighton & Sussex Medical School Brighton BN1 9PX UK +44 1273 873549
[email protected]
Aoife Healy CSHER, Faculty of Health, Staffordshire University, Stoke-on-Trent ST4 2DF UK
[email protected]
Carina Westling School of Media, Film & Music University of Sussex Brighton BN1 9RG UK
[email protected]
Nachiappan Chockalingam CSHER, Faculty of Health, Staffordshire University, Stoke-on-Trent ST4 2DF UK +44 1782 295853
[email protected]
Rob Needham CSHER, Faculty of Health, Staffordshire University, Stoke-on-Trent ST4 2DF UK
[email protected]
learning [13]. To develop methods to make consistent, objective indicators of any psychological state will entail lengthy research from many laboratories [2,13], and will ostensibly require multiple measurement technologies [1,2,9]; here we focus on validating tools for one aspect of this process (posture and head attitudes).
ABSTRACT
Objective metrics of engagement are valuable for estimating user experience or progression through interactional narratives. Postural micromovements of seated individuals during computer engagement have been previously measured with magnetic field sensors and chairmounted force matrix detection mats. Here we compare readings from a head-mounted accelerometer, single camera sagittal motion tracking, and force distribution changes using floor-mounted force plates against a Vicon 8-camera motion capture system. Measurements were recorded on five participants who were watching or interacting with a computer monitor. Our results show that sagittal and coronal plane measurements for Vicon, the accelerometer and the single camera produced nearly identical data, were precisely synchronized in time, and in many cases proportional in amplitude. None of the systems tested were able to match the Vicon’s measurement of yaw.
Postural Micromovements & Engagement while Seated
When assessing human-to-human engagement, it is axiomatic that leaning toward a person indicates interest or engagement [6,7]. In human computer interaction, a range of papers have proposed that body and head movements can distinguish boredom from engagement, interest or flow [1,8,10,13]. The gold standard for measurement of human body position (motion capture) is multi-camera, markerdetecting opto-electronic systems such as the 8-camera systems made by Vicon [3,15]. The Vicon system yields excellent motion capture data in all dimensions over time, with millimetre accuracy at a 50 Hz sampling rate; however, it is expensive, site-specific, and difficult to set up. The present study is only the second to use such a system for measuring body and head movements in seated participants interacting with a computer monitor [16]. In previous studies, overall seated posture has been detected by chair-mounted force-matrix detection mats (Chair-mat, Tekscan) [1,8,13], while small head displacements (which presumably do not change chair weight distributions dramatically) were measured with magnetic field sensors (Flock of Birds, Ascension Technologies) [1].
Keywords
Engagement measurement, user experience (UX), usability, human-computer interaction (HCI), monitor engagement, postural micromovements, motion capture INTRODUCTION
Engagement is an aspect of user experience that usually has been investigated subjectively [14]. Remote numerical measurements of engagement (e.g. number of visits per unique visitor, page views, time spent on page, and click through rate) dominate web analytics completely, and far outstrip the employment of most other marketing or emotion-measurement tools. However, non-remote, objective metrics of engagement represent a major opportunity for contributing to estimations of user experience or progression through interactional narratives [12]. Deep measures of subconscious change (e.g. posture) may reveal moment-to-moment shifts in affect [11] and
Experimental goal
The main goal of this research is to compare several affordable technologies to a reference technology (Vicon) for potential use in measuring postural behaviours as objective, subconscious proxies of instantaneous engagement with audiovisual stimuli in seated individuals. Thus far there has been no information directly comparing 1
the reliability and validity of the various technologies that are potentially useful for making these measurements. METHODS Experimental Volunteers
Five healthy volunteers (3 female, ages 22-62, m/sd 46.2 ± 14.7) were recruited from the University of Staffordshire community via advertisements and emails. Ethical approval was obtained from our local university ethics committees. The volunteers were seated in a standard four-legged (nonswivelling) “reception room” chair with cushioned and fabric-covered back and seat. Measurement technologies
In this study, we compare three different tools for making such measurements against a Vicon 8-camera optoelectronic motion analysis system (OMG Plc, Oxford, UK): a head-mounted triaxial accelerometer (MIE Medical Research, Leeds, UK), sagittal motion tracking using Kinovea 0.8.15 to analyze video data captured with a highspeed Basler 602fc 200 Hz video camera (Basler AG, Germany), and force distribution changes from a chair whose front legs and back legs were on two separate ORS 6-5 force platforms (AMTI Inc., Boston, USA); each force plate was 508 mm long by 464 mm wide, and they were separated by 220 mm. The sample rate for the Vicon and Kinovea data was 50 Hz, and for the accelerometer and force platform data, 1000 Hz. Stimulus presentation
Markers and measurement devices were affixed to the participant, who was then allowed to acclimatise to the devices for 15 minutes. The participant wore 2 headbands, allowing us to affix 4 reflective spheres around the upper head. Other marker spheres were placed on the shoulders, “badge” of the deltoid, clavicle and sternum. The accelerometer was mounted on top of the head gear. Stimuli
We used 12 short stimuli (170-190 seconds), selected and/or designed to elicit naturalistic responses ranging from very disengaged to highly engaged; one might expect such responses from a seated participant interacting with computer-based stimuli. We were interested in spontaneous and naturalistic movements because faster and more exaggerated movements are often poorly tracked by the accelerometer and Kinovea; for our purposes of measuring affective responses, we are only interested in the subset of naturalistic movements that are produced spontaneously in response to our computer stimulus set. These stimuli included computer games, computer quizzes, short videos and photo montages. Each stimulus was preceded by 45 seconds of “television snow” plus white noise (to establish a baseline signal before each stimulus), followed by a brief synchronisation timing signal. We have used these stimuli before for other psychophysiological experiments and in this case the order of the stimuli was randomised.
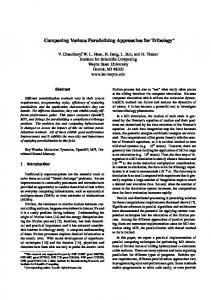
Figure 1. Representative data comparing head pitch angle measured by accelerometry to Vicon. Panel A shows overlays of pitch vs. time (accelerometry is green and Vicon is red). Panel B shows a Bland Altman plot of the same data, where the x-axis is (A+B)/2, the y-axis is (A-B). Panel C shows accelerometer data (x-axis) plotted against Vicon data (y-axis) with best fit (slope = 1.00).
2
(most had slopes very near 1.0). A table summarising the correlation coefficients is shown in Table 1. Each row shows the correlation between the measurements made by the Vicon opto-electronic system and the measurement listed in the first column of that row. The relationship between the head pitch angle (i.e. nodding forward and back) measured by Vicon versus the accelerometer was very strong, with R values reaching as high as 0.997. The relationship between the head roll angle (i.e. tilting the top of the head left or right toward the shoulder) measured by the Vicon versus the accelerometer was also consistently strong; all R values were above 0.696. However, the relationship between the head yaw angle (i.e. turning head to face left or right while it remained vertical) measured by the Vicon versus the accelerometer was generally weak, with many R values being below 0.3. The poor performance of the accelerometer when measuring yaw compared to pitch or roll may be due to the fact that gravitational acceleration would be much stronger than the acceleration induced by spontaneous affect-induced head movements; thus, changes in pitch and roll could create spurious force changes for yaw; furthermore, many spontaneous head movements combine pitch, roll and yaw. To test this we compared the accelerometer head yaw signals to the Vicon head pitch signals, and there was a correlation, with large changes in pitch influencing yaw (Table 1, line 4).
Analysis
Absolute angles with respect to the room were calculated from fiducial markers. Each signal was adjusted to the Vicon signal by fitting a linear transformation using Matlab. Because the signals were recorded at different frequencies, initially all signals were resampled to the least common denominator of rate (50 Hz, or 25 Hz for the Basler camera and Kinovea). Accelerometer and force plate signals were smoothed. Correlation was then performed on Matlab based on the method listed in Cloete and Scheffer [5]:
RESULTS
In addition to correlations, all comparisons were graphically inspected using direct overlays of the time based signal; representative data are shown in Figure 1, panel A. Graphical illustrations of the goodness of fit for each of the pair signals was done as per the protocol for comparing measurements popularised by Bland and Altman [4] (representative data is shown in Figure 1, panel B). The Bland Altman plot’s x-axis is the average between the two measurements at a single time point, and the y-axis is the difference between the two measurements for that time point; these are then compared to how many of the differences are 2 standard deviations away from the mean. If the measurement techniques were equivalent, all data would fall on a horizontal line at Y = 0. This approach allows one to recognise bias (Ymean ≠ 0), unusual variance (diagonals), and poor resolution (short, vertical lines). Further graphical analysis was based on plotting for each time point the value of each measurement against the other (see Figure 1, Panel C). This is shown with a best fit line
When comparing head pitch angle measured by Vicon versus video analysis of a sagittal view (line 5), the relationship between the two measures is strong; however, in some examples, small angle changes could be observed graphically to go in opposite directions (data not shown), although larger changes in pitch corresponded well. Finally, when compared to the Vicon, the force plates were inconsistent as a proxy indicator for naturalistic affectinduced movements of the head forward.
Table 1. Correlation Coefficients for the Compared Technologies
Technology Comparison 1. Accelerometer: Head Pitch 2. Accelerometer: Head Roll 3. Accelerometer: Head Yaw 4. Accel Head Yaw vs Vicon Pitch 5. 1 Camera: Head Pitch 6. Force plate vs Vicon Head X
R (mean ± S.D.) (5 participants) 0.9441 ± 0.0631 0.9494 ± 0.0728 0.4302 ± 0.2288 0.6302 ± 0.2357 0.9113 ± 0.0778 0.4266 ± 0.2602
R (best trial) 0.9972 0.9981 0.9425 0.9788 0.9909 0.9285
R (worst trial) 0.6440 0.6961 0.0268 0.0772 0.6549 0.0025
R-values correlating each of the listed measurements to the simultaneous measurement made by the Vicon opto-electric technology. 59 time series were compared. X trajectory refers to anterior-posterior (positive toward monitor), Y to leftright, and Z to superior-inferior (positive toward ceiling). For angles, all unit comparisons (pitch, roll and yaw) were in radians. For displacement, measurements were in millimeters. Force/pressure measurements were in Newtons per cm2.
3
3. Barker, S. et al., 2006. Accuracy, reliability, and validity of a spatiotemporal gait analysis system. Medical Engineering & Physics, 28(5), 460-467.
CONCLUSIONS
In this study of seated, naturalistic, postural micromovements in response to computer-based stimuli, we have shown that, compared to the Vicon optoelectronic motion capture system: 1.
A head-mounted accelerometer can produce very accurate measurements of head pitch angle.
2.
A head-mounted accelerometer can produce very accurate measurements of head roll angle.
3.
4.
5.
4. Bland J.M., Altman D.G., 1986. Statistical methods for assessing agreement between two methods of clinical measurement. The Lancet. 327 (8476), 307–10 5. Cloete, T. and Scheffer, C., 2008. Benchmarking of a full-body inertial motion capture system for clinical gait analysis. 30th Annual International IEEE EMBS Conference, 4579-4582. 6. Coan, J.A. & Gottman, J.M., 2007. The Specific Affect Coding System (SPAFF). In Coan, J.A. & Allen, J.J.B., Handbook of Emotion Elicitation and Assessment (Oxford: Oxford University Press), p. 267-285.
In our hands, the head-mounted accelerometer did not consistently produce accurate measurements of head yaw angle; our yaw measurements seemed to be contaminated by events in the pitch angle.
7. Coker, D.A. & Burgoon, J., 1987. The nature of conversational involvement and nonverbal encoding patterns. Human Communication Research, 13(4), 463494.
A single-camera sagittal view of the subject analysed by standard video motion analysis software (e.g. Kinovea) could detect the larger movements of the head, and it could produce readings that are co-ordinated in time with the Vicon-detectable movements. However, for more subtle movements, the single sagittal view suffered from lower resolution.
8. D’Mello, S., Chipman, P. & Graesser, A., 2005. Posture as a Predictor of Learner’s Affective Engagement. Psychology, 1, 905-910. 9. Kapoor, A., Burleson, W. & Picard, R., 2007. Automatic prediction of frustration. International Journal of Human-Computer Studies, 65(8), 724-736. 10. Kleinsmith, A. & Berthouze, N., 2007. Recognizing Affective Dimensions from Body Posture. A. Paiva, R. Prada & R. Picard, eds. Affective Computing and Intelligent Interaction, LNCS-4738, 1-12.
The configuration of floor-mounted force plates that we attempted to use for detecting changes in chair force distribution was inconsistent in detecting the naturalistic, psychologically-driven postural micromovements of the head or torso that we sought. This configuration could register unopposing head and torso movements, but the signal was complicated by movements of the leg.
11. Kleinsmith, A., Bianchi-Berthouze, N., & Steed, A. 2011. Automatic recognition of non-acted affective postures. IEEE Transactions on Systems, Man, And Cybernetics—Part B: Cybernetics, 41(4), 1027-1038. 12. Law, E.L., 2011. The Measurability and Predictability of User Experience. Proceedings from EICS ’11. New York: ACM.
In conclusion, future studies of engagement during humancomputer-interactions, when the human is seated and facing a monitor, may gather highly accurate postural data via accelerometry or Kinovea. Our data justify further investigation of other inexpensive technologies for measuring yaw, such as magnetic or gyroscope-based sensors.
13. Mota, S. & Picard, R.W., 2003. Automated Posture Analysis for Detecting Learner’s Interest Level. 2003 Conference on Computer Vision and Pattern Recognition Workshop, 5, 49-49. 14. O’Brien, H.L. & Toms, E.G., 2008. What is user engagement? A conceptual framework for defining user engagement with technology. Journal of the American Society for Information Science, 59(6), 938-955.
REFERENCES
1. Balaban, C.D. et al., 2004. Postural Control as a Probe for Cognitive State: Exploiting Human Information Processing to Enhance Performance. International Journal of Human-Computer Interaction, 17(2), 275286.
15. Stancic, I. et al., 2009. Development and testing of a device for human kinematics measurements. WSEAS Transactions on Systems, 8(9), 1083-1092.
2. Baltrušaitis, T. et al., 2011. Real-time inference of mental states from facial expressions and upper body gestures. 2011 IEEE International Conference on Automatic Face & Gesture Recognition and Workshops (FG 2011), 909-914.
16. Villanueva, M.B.G. et al., 2000. Evaluation of the Ergonomic Aspects of Portable Personal Computers with Flat Panel Displays (PC-FPDs). Proceedings of the Human Factors and Ergonomics Society Annual Meeting, 44(6), 654-657.
4