performance across numerous real-world, complex, and challenging listening environments. Introduction ... Testing was do
Field Study News July 2016
Comparing objective and subjective outcomes of automatic classification systems across manufacturers The use of automatic classification systems to categorize listening environments, and change hearing aid parameterization accordingly, has significantly increased the ability of hearing aid users to take advantage of multiple hearing aid settings without the additional effort of a manual push-button. However, the level of sophistication of these systems differs across manufacturers; with the speed, ability to categorize and number of parameters available for adaptation in the hearing aids varying widely. Phonak AutoSense OS™ has the ability to not only accurately characterize listening environments quickly, but can classify proportions and probabilities of different acoustic classes present in the environment. The Phonak Audiology Research Center (PARC) completed a research study to better understand the capabilities of AutoSense OS, in comparison to the automatic steering systems of two other leading hearing aid manufacturers. Specifically of interest was how each manufacturer’s automatic classification system affected hearing aid user performance in real-world situations. The results indicate that Phonak AutoSense OS consistently yields better speech intelligibility performance across numerous real-world, complex, and challenging listening environments.
Introduction Since automatic classification systems were first incorporated into hearing aids in the late 1990s, they have become increasingly complex in their ability to detect and adapt hearing aid parameters in accordance with the environment. The emphasis on “smart” hearing aids that adjust hearing aid programs and parameters has become a main topic in the hearing aid domain, as this type of technology reduces effort and maximizes convenience for hearing aid users. In a scoping study by McCormack and Fortnum (2014), it was concluded that lack of perceived benefit (particularly in noise) and handling difficulties both ranked in the top three reasons reported for hearing aid disuse. It could be surmised that a reliable automatic operating system that both optimized parameters based on the given environmental situation and minimized the need for user interaction with the device would potentially remove some of these barriers. Manufacturers have implemented automatic functionalities in different ways. Some manufacturers have focused on this area of innovation adding flexibility, complexity and accuracy to their automatics, while
others are restricted to the automatic manipulation of a limited number of parameters. Phonak AutoSense OS uses advanced algorithms to accurately classify, as well as blend characterizations of different acoustic environments. Specifically, AutoSense OS smoothly steers gain and sound cleaning features to provide an optimal balance between performance and sound quality. Adaptation of the signal processing occurs slowly to avoid harsh, noticeable transitions or artifacts. It also allows the device the blend multiple programs as in the complex scenes of everyday life. A previous research study completed at PARC investigated the performance of hearing aid users in real world listening environments in manual hearing aid programs versus AutoSense OS (Rakita and Jones, 2015). That research study revealed that AutoSense OS yielded equal or better speech recognition performance than the manual program of the participants’ choice. As an extension of this previous research study, it was of particular interest how the classification systems of other hearing aid manufacturers affect the ability of hearing aid users to
understand speech in complex, real world listening environments as compared to AutoSense OS. This is the focus of this study.
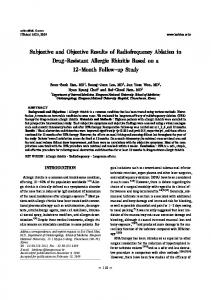
Methodology Fourteen subjects between the ages 23 and 83 years were included in this study. All exhibited mild-to-moderately severe sensorineural hearing loss bilaterally and were full time hearing aid users. For this project, subjects were fitted with Audeo B-90 receiver-in-canal (RIC) hearing aids, and comparable receiver-incanal devices from two other hearing aid manufacturers. The average audiogram for the 14 participants in the study is shown in Figure 1.
Threshold (dB)
Frequency (Hz) 250 500 1000 2000 3000 4000 6000 8000 0 10 20 30 40 50 60 70 80 90 100 110 120
Figure 1 shows the average audiometric thresholds for the 14 participants.
Hearing aid fitting The hearing aids of all three manufacturers were set to the “NALNL2” prescriptive strategy in each respective programming software. Gain was set to 100% of target for each manufacturer. Any frequency-lowering scheme available in the aids was deactivated. The automatic classification program was the only program in the hearing aids. To ensure equal audibility for all hearing aid manufacturers, realear measurements were performed using the Verifit 2 system. Adjustments were made to ensure real-ear aided responses (REAR) were within +/-3 dB of NAL-NL2 targets 250-4000 Hz for each manufacturer. This allowed for an assessment of scenespecific signal processing changes driven by the automatic, as opposed to any inherent differences in audibility. Test setup Four individual, real-world listening environments were used in this study. These four environments were identified for several reasons: a) they each represented a listening environment in which hearing aid users frequently find themselves in everyday life; b) they are environments or scenarios often reported to hearing healthcare providers as being extremely difficult for hearing aid users; and c) they represent complex, real world listening situations that span a wide range of scenes, each
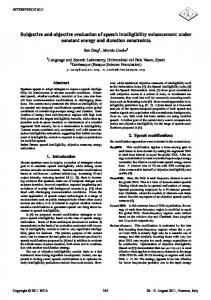
requiring different listening needs and adaptations by the hearing aid. The sentences were always set at a pre-calibrated level for each of the four listening environments. The background level was consistent and controlled to the maximum extent possible. Situations in which the noise source was naturally occurring in the environment (e.g. coffee shop and car) required several visits to these locations prior to the experiment to ensure that sound noise levels were consistent across days and different times of the day. A description of each scene used for testing is outlined below. For each scene, an adaptation time was incorporated into all testing sessions when first activating and placing hearing aids on the participant. This required a minute of exposure to the scene prior to testing, allowing the hearing aids time fully adapt to the scene. Testing was done with Phonak B-90 RIC hearing aids, and comparable RIC devices from two other manufacturers. Phonak power domes were used on all three pairs of hearing aids. This was to ensure the three hearing aid manufacturers did not feel different to the participant. The order of hearing aids for each participant was randomized and counterbalanced for each listening scene. At least two experimenters participated in every test session. One experimenter was responsible for knowing the order of hearing aid manufacturers used for testing, and placing each pair of hearing aids on the participant’s ears in a predetermined, randomized order. The hearing aids were covered with black, acoustically transparent EarGear coverings. With these covers, the aids could not be identified (Figure 2). This ensured neither the participant, nor the experimenter scoring, knew which manufacturer’s hearing aids the participant was wearing during the testing. A different experimenter was responsible for scoring the participant’s responses, and calculating the speech intelligibility score in each manufacturer’s hearing aids. A third experimenter was used in the car and coffee shop scenes when a BOSE Minilink wireless speaker was required for presentation of the speech stimuli. It was this third experimenter’s role to hold the wireless speaker at a consistent level and distance from the participant in these two scenes.
Figure 2. Hearing aids covered and coupled with identical power domes could not be identified.
Field Study News | Automatic Classification Systems
2
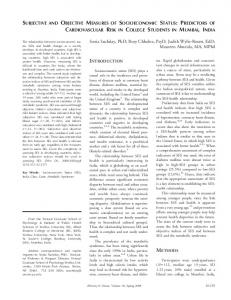
Laboratory speakers and a soundcard were used for speech and noise presentation in the “Complex Listening Scene” and “Soft Speech Scene” measured in the Phonak Listening Loft. This space was designed as a fairly reverberant apartment (RT= .8 sec). Speech and noise were presented using a Fireface RME 16channel sound card and 8020 CPM Genelec loudspeakers. 1. Complex Listening Scene (poor acoustics) It was the desire of the investigators to create a complex test scene that was not straightforward, in that it would require the automatic classification system to make some kind of higher level “decision”, due to the presence of more than one type of acoustic interference. It is this type of scene that would, theoretically, necessitate several different parameterization changes that do not necessarily align with one exclusive program. It is these types of scenarios that are difficult to be characterized by a hearing aid user with a manual push button, but are extremely common in everyday life. Background noise levels were purposefully set at 60dBA to minimize the chance of activating an aggressive noise program for any manufacturer. Speech understanding in high levels of background noise was investigated in the “Coffee Shop Scene” (described in part 3 of test setup). Performance in a “Complex Listening Scene” was measured in the Listening Loft, at PARC. In addition to this reverberation, 4-talker babble noise was presented from four speakers at 45 degrees, 135 degrees. 225, and 315 degrees at a summated level of 60 dBA. The participant was seated in the center of the four speakers, at an 11-foot distance from each speaker. A fifth speaker was placed at 0 degrees azimuth relative to the participant at a distance of 3 feet from the participant. It is from this front speaker that IEEE sentences were presented at a level of 65 dBA. See Figure 3 (below).
2. Car Listening Scene The car is a challenging listening situation for several reasons. In addition to car and road noise, there is often additional competing noise with the radio or other talkers. Furthermore, the speaker of interest is almost always speaking from beside or behind the hearing aid user. As a result, a hearing aid user would not benefit from a directional microphone, since the speaker of interest would not fall within the beam of the hearing aid. In fact, a directional microphone could be detrimental in this environment. A 2014 Nissan Murano was used for all participant car testing. Each participant was seated in the passenger seat of the car. The same stretch of road in the office park area outside the research facility was used for each participant, and the car consistently traveled at 30 mph during the testing to ensure consistency across participants. Testing could only be done with dry road conditions and was discontinued if there was precipitation. Fourtalker babble was played through the speaker system of the car. The babble stimulus was saved on an iPhone 6s, and connected via the auxiliary input of the car. This noise was presented at 60 dBA over the car built in stereo. Summated with the road and engine noise of the car, the overall background noise for testing was consistently 63 dBA. The IEEE sentences were presented from a wireless BOSE speaker held by an experimenter in the backseat, directly behind the participant. The sentences were presented at 70 dBA. Throughout testing in the car, experimenter 1 drove the car, experimenter 2 presented sentences from the Bose speaker and put the proper hearing aids on the subject for each test session, and experimenter 3 scored the sentence tests. See Figure 4 (below).
Figure 4. Schematic of car setup for comparison of speech recognition performance using automatic classification systems from three manufacturers.
3. Coffee Shop Scene (loud noise) The coffee shop scene was chosen to represent an extremely noisy and challenging listening environment. A particular coffee shop located in downtown Naperville, IL was used for testing of all participants. This particular coffee shop was chosen because it is consistently busy at all hours of business. Figure 3. Schematic of “Complex Listening Scene” used for comparison of speech recognition performance in automatic classification systems from three manufacturers.
In this scene, speech was presented from across the participant at the maximum level of the speaker. The background noise was Field Study News | Automatic Classification Systems
3
consistently measured at an average of 80 dBA. See Figure 5 (below).
In addition to objective testing of speech recognition, the participant was also asked (immediately after the speech recognition test for each manufacturer) to give a subjective rating of his or her perceived effort when repeating back the sentences with that manufacturer. They were given a rating scale of 1 (no effort) to 10 (maximum effort) and asked to pick the value that represented their perceived effort in listening and understanding with that pair of hearing aids.
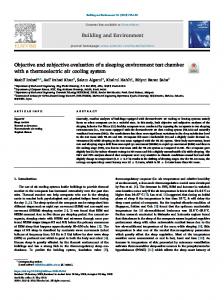
Results Speech recognition The speech recognition scores on the IEEE sentence test were averaged across all 14 participants for each manufacturer in each listening scene. Figures 6a-d show the mean participant speech recognition scores for each manufacturer, across each test environment. Figure 5. Schematic of coffee shop setup for comparison of speech recognition performance using automatic classification systems from three manufacturers.
4. Soft Speech Scene The final measurement condition also took place in the PARC loft and was chosen to represent speech from a distance, or soft speech. Each participant was seated in the Listening Loft, and a speaker placed at 0 degrees azimuth, at a 3-foot distance from the participant presented sentences at 50 dBA. See Figure 6 (below). There was no background noise added and the unoccupied room measured 41dBA at the position of the research subjects.
A repeated measures analysis of variance (ANOVA) revealed a significant main effect for hearing aid manufacturer in the Complex Listening Scene F(2, 13) = 13.3 , p < 0.05), the Soft Speech Scene F(2, 13) = 3.42, p < 0.01), the Coffee Shop Scene F(2, 13) = p < 0.05), and the Car Listening Scene F(2, 13) = 4.9, p < 0.05. See Figures 6a-6d for the average scores across each listening scene. The error bars represent the standard error of the mean. After applying the Bonferroni correction for the three pairs of comparisons per test set-up, an α of 0.02 was used to determine significance for each paired comparison (Dunn, 1961). Post hoc analyses using the Fisher LSD post hoc criterion for significance indicated that speech recognition scores were significantly higher with Phonak AutoSense OS (M = 62% , SE = 6.0%) than the other two manufacturers (M= 41%, SE = 5.6%), (M = 45%, SE = 4.6%) in the Complex Listening Scene. In the car, the Fisher LSD post hoc test revealed that the speech recognition scores with Phonak AutoSense OS (M=53%, SE= 6.9%) were significantly better than both competitors (M = 43%, SE= 7.2%), (M = 40%, SE = 7.0%).
Figure 6. Schematic of the soft speech setup for comparison of speech recognition performance using automatic classification systems from three manufacturers.
Procedures In each of the four scenes outlined above, the participants were asked to repeat back 20 IEEE sentences while wearing each of the three manufacturer’s hearing aids. The order of manufacturers used for testing was randomized for each scene. The percentage of words correctly repeated back for all 20 sentences was calculated for each manufacturer. The instructions for this task were the same for all participants, and the participants were encouraged to guess if he or she was not sure.
The Fisher-LSD post hoc test also revealed significantly better speech recognition scores with Phonak AutoSense OS (M = 74%, SE = 5.5%) than the other two manufacturers (M = 67%, SE = 5.3%), (M = 67%, SE = 5.3%) in the Coffee Shop Scene. Finally, Phonak AutoSense OS yielded significantly better speech recognition performance in the soft speech condition (M = 60%, SE = 8.2%) as compared to one of the other manufacturers (M = 49%, SE = 9.1%).
Field Study News | Automatic Classification Systems
4
Figure 8. Average subjective rating of perceived listening effort when performing the speech recognition task in each manufacturer’s automatic classification system.
Discussion The current study investigated the ability of the automatic classification system to optimize listening in a wide variety of listening situations, involving several different types of acoustic interference. It is a strong wish of hearing aid users to regain a normal listening experience where they do not have to think about adjusting their hearing aids in order to communicate effectively in different environments. It may also not be realistic to expect hearing aid users to accurately switch programs when the situation dictates, particularly when scenes are complex and may not be a straight-forward alignment with the types of programs available to the hearing aid user via a manual program. Finally, it may not even be possible for hearing aid users to access the sophisticated blend of parameters that some hearing aid manufacturers implement in their automatic classification systems.
Figure 7a-7d. Objective scores of speech recognition (% correct) for IEEE sentences in the acoustic classification systems of Phonak and 2 competitors (Comp 1 and 2). Error bars indicate standard error of the mean. (*) = significant difference at 0.02 p-value. (*) designates a significant result compared to Competitor 1 and (*) designates a significant result compared to Competitor 2.
Listening effort The average listening effort reported across all four scenes for each manufacturer is reported in Figure 8. Participants were given the rating scale from 1 (no effort) to 10 (maximum effort), and asked to assign a value to his or her perceived listening effort in each of the three manufacturers’ hearing aids. Results of the subjective data indicate a trend toward less perceived listening effort across all four scenes in Phonak AutoSense OS, as compared to the other two manufacturers, however these results failed to reach statistical significance. On a 10 point scale, the average rating for Phonak was 6.2 compared to 7.0 and 7.1 for the competitors.
The ability of each hearing aid manufacturer to design and implement an automatic classification system that impacts actual hearing aid user performance in the real world was the goal of the current study. Each hearing aid manufacturer takes its own approach to classification and has the flexibility to manipulate a different number of parameters. The current study took place in four realistic and challenging listening environments. Results showed that Phonak AutoSense OS most effectively improves hearing aid user performance in these real life, challenging scenes. Average speech recognition performance was consistently higher with Phonak AutoSense OS than the other two manufacturers in all four scenes tested. Further, subjective listening effort was consistently rated lower on average across all four listening scenes in Phonak AutoSense OS than in the automatic program of the other two manufacturers.
Conclusion The results of this study demonstrate the ability of AutoSense OS to steer hearing aid signal processing, including gain and feature activation, in response to the environment, in a way that ultimately yields better speech understanding, as compared to the devices of two leading manufacturers. This benefit was seen regardless of the complexity of the scene. Results specifically indicated that, on average, participants performed best with Field Study News | Automatic Classification Systems
5
Phonak on a test of speech recognition in four, real-world listening situations with AutoSense OS.
Authors and Investigators
Automatic classification is a sophisticated technology that requires both the identification of acoustic characteristics and adaptation of signal processing, in real time. The more accurate the automatic classification system, the greater the convenience for the hearing aid user, in that the hearing aid user does not have to think about switching programs. Additionally, these systems can provide a more consistent and optimal listening experience for the hearing aid user than what could be achieved through a manual push button. The current study shows that AutoSense OS achieves better speech recognition performance and subjective perceptions of listening effort in all real world conditions tested as compared the devices of two other hearing aid manufacturers. This demonstrates the power of AutoSense OS to positively impact hearing aid user experience and performance in the real world.
Lori Rakita is a research audiologist at the PARC. Since joining Phonak she has managed a significant program of research including extensive technical assessments to participant testing to improve the application, evidence basis and clinical support of Phonak products. Lori received her Bachelor of Science degree in Psychology from the University of Wisconsin-Madison and her Doctorate of Audiology from Washington University in St. Louis.
References McCormack, Abby and Fortnum, Heather (2013) Why do people fitted with hearing aids not wear them? International Journal of Audiology, 52 (5). pp. 360-368. Rakita, L and Jones, C. (2014) Performance and Preference of an Automatic Hearing Aid System in Real-World Listening Environments. The Hearing Review
Christine Jones joined Phonak in 2001. She currently serves as the Director of the Phonak Audiology Research Center (PARC) where she manages a program of internal and external clinical research. Prior to this role, Christine was responsible for Phonak US Pediatrics and ran pediatric clinical research in PARC. Christine received her Master’s degree in Audiology from Vanderbilt University and her Doctorate of Audiology from Central Michigan University.
Field Study News | Automatic Classification Systems
6