Comparing Web Services Performance and Recovery in the Presence of Faults Marco Vieira, Nuno Laranjeiro CISUC, Department of Informatics Engineering University of Coimbra – Portugal
[email protected],
[email protected] Abstract Web-services are supported by a complex software infrastructure that must ensure high performance and availability to the client applications. Web services industry holds a well established platform for performance benchmarking (e.g., TPC-App and SPEC jAppServer2004 benchmarks). In addition, several studies have been published recently by main vendors focusing web services performance. However, as peak performance evaluation has been the main focus, the characterization of the impact of faults in such systems has been largely disregarded. This paper proposes an approach for the evaluation and comparison of performance and recovery time in web services infrastructures. This approach is based on fault injection and is illustrated through a concrete example of benchmarking three alternative software solutions for web services deployment.
1. Introduction Computer outages can result in a huge loss of money or in an unaffordable loss of prestige for companies. In fact, due to the impressive growth of the Internet, some minutes of unavailability in a server somewhere may be directly exposed as loss of service to thousands of users around the world. Web services are becoming a strategic vehicle for data exchange and content distribution. Although web services are increasingly being used in complex business-critical systems, no practical way has been proposed so far to characterize the impact of faults in the performance or to compare alternative solutions concerning recovery time (which affects directly the availability of the system). Computer industry owns a reputed infrastructure for performance evaluation and the benchmarks managed by the Transaction Processing Performance Council (TPC) [16] and by the Standard Performance Evaluation Corporation (SPEC) [13] are worldwide recognized as the most important initiatives. In addition, several studies have been published recently by main vendors focusing the comparison of web services performance [10, 15]. Recently, Sun Microsystems presented a study targeting the comparison of the performance of web service technologies in two key middleware platforms available
today (J2EE and .NET) [15]. In this study Sun Microsystems claims that J2EE platform outperformed .NET in all tested cases. Microsoft has answered in [10] arguing that the .NET framework presents better results than J2EE. Although these are very interesting studies, the characterization of the impact of faults in this type of infrastructures has been disregarded. In fact, the experiments conducted in [10, 15] targeted peak performance and did not take into account the impact of faults in the web services execution. Faults may occur in a computer system for several reasons [1, 7]: 1) caused by environmental disturbances (e.g., electromagnetic interferences, power fluctuation, etc); 2) introduced during the system design and implementation (e.g., software bugs); and 3) introduced by system operators (e.g., administration mistakes). Besides high performance, many businesses require their servers to provide very high availability, which is directly influenced by the time needed for the system to recover from faults. This way, we believe that it is of utmost importance to define a practical approach that allows the comparison of alternative solutions in terms of both performance and recovery time in the presence of faults. Fault injection has become an attractive approach to validate specific fault handling mechanisms and to assess the impact of faults in actual systems, allowing this way the estimation of measures such as performance in the presence of faults, error detection coverage, and recovery time [4, 12]. In this paper we propose an approach for the comparison of performance and recovery time of web services infrastructures. In general, such approach can help providers in evaluating the performance and recovery time of alternative middleware platforms and technologies. An important aspect is that, although the approach is naturally oriented for middleware platforms comparison, it can also be used to select alternative operating systems and hardware. The approach proposed consists of a set of faults that are injected in the system in order to characterize the impact of faults in web services execution and to exercise recovery. A set of measures is used to characterize baseline performance (without faults), performance in the presence of faults, and recovery time. The set of web ser-
vices specified in [14] is used as workload to exercise the system. The structure of the paper is the following: the next section presents related work. Section 3 presents and discusses the proposed approach. The experimental evaluation is presented in Section 4 and Section 5 concludes the paper.
2. Related work The work on performance benchmarking has started long ago and has contributed to improve successive generations of systems. There are two main organizations developing performance benchmarks: TPC and SPEC. The former defines performance benchmarks for databases and transactional systems in general and the latter develops benchmarks for several specific domains. The TPC Benchmark™ App (TPC-App) [17] is a performance benchmark for web services infrastructures. The business represented by TPC-App is a distributor that supports user online ordering and browsing activity. The TPC-App performance benchmark measures the average number of Service Interactions Per Second (SIPS) completed by the system during the measurement interval. The SPEC jAppServer2004 benchmark [14] was designed to measure the performance of J2EE 1.3 application servers (SPEC holds similar benchmarks for previous versions of J2EE). The workload emulates a manufacturing, supply chain management, and order/inventory system. JOPS is the performance measure provided and corresponds to the jAppServer Operations Per Second completed during the measurement interval. In addition to standard benchmarks like TPC-App and SPEC jAppServer2004, main vendors have recently undertaken efforts towards the comparison of web services performance. In fact, there has been an interesting dispute between Sun Microsystems and Microsoft on the comparison of the performance of web service technologies in J2EE and .NET. Sun Microsystems started in [15] by claiming that the J2EE platform outperforms the .NET framework. Microsoft has answered in [10], arguing that the .NET framework presents better results than J2EE. Both studies are based in the WSTest tool initially developed by Sun Microsystems [15] and later extended by Microsoft [10]. The following points, transcript from [15], summarize the types of web services calls used in the version of the WSTest designed by Sun Microsystems: – echoVoid: sends and receives an empty message. – echoStruct: sends and receives an array with 20 elements. – echoList: sends and receives a linked list with 20 elements. – echoSynthetic: sends and receives multiple parameters of different types.
Microsoft has added several web services to improve the representativeness of the workload. The following points, transcript from [10], summarize those services: – echoStruct with size 100: sends and receives an array with 100 elements. – echoStruct with size 200: sends and receives an array with 200 elements. – echoList with size 100: sends and receives a linked list with 100 elements. – echoList with size 200: sends and receives a linked list with 200 elements. – getOrder: two integers are passed as parameters in order to create a customer order. The WSTest simulates a server program that performs several web services calls in parallel and reports the average number of web service operations executed per second and the average response time for each of the types of web services tested. It is important to emphasize that, although the works introduced above present powerful infrastructures for performance evaluation of web services, the assessment of the impact of faults in web services execution and recovery has been overlooked. Recent effort at Sun Microsystems has defined a highlevel framework [9] specifically dedicated to availability benchmarking of computer systems. The proposed framework follows a hierarchical approach that decomposes availability into three key components: – Fault/maintenance rate: number of faults and maintenance events that occur in the system over a given time period. – Robustness: measures the ability to continue providing service in the presence of faults, maintenance events, and other external events like human errors and environmental hazards. – Recovery: measures how quickly a system returns to operation after an outage. The goal is to develop a suite of benchmarks, each one measuring an aspect of the availability of the system. Within the framework proposed by [9], two specific benchmarks have already been developed. [8] proposes a benchmark for measuring a system's robustness (degree of protection that exists in a system against outage events) in handling maintenance events, such as the replacement of a failed hardware component or the installation of a software patch. In [6] it is proposed a benchmark for measuring system recovery in a non-clustered standalone system. This benchmark measures three specific system events. The first event measured is a clean system shutdown, which provides a baseline metric. The second event measured is a clean system bootstrap that corresponds to rebooting a system following a clean shutdown, providing a metric that characterizes the time the system needs to perform a reboot. Finally, the third event is a system reboot after a
fatal fault event and provides a metric that represents the time between the injection of a fault and the moment the system returns to a useful state. Although recovery benchmarking has already been addressed in the works introduced above, the assessment of the impact of faults in web services infrastructures continues to be an open issue. The purpose of the present work is to study the feasibility of the evaluation of the impact of faults in web services infrastructures. The goal is to provide a practical approach that can be easily used by web services providers to solve possible bottlenecks and select alternative web services technologies and platforms. Benchmarks can be provided as a computer program ready to be executed (as is the case of SPEC benchmarks) or as a document that specifies how the user should implement and run the test (this is the case of TPC benchmarks). The work on recovery benchmarking presented above [6, 8, 9] followed the document based approach, which means that users must code the benchmark before execution. In the present work, besides proposing a methodology, the goal is to develop a tool in which the user only needs to configure a small set of parameters. This testing tool must be used together with the WSTest implementation provided by Sun Microsystems [15] or Microsoft [10].
3. Web services performance and recovery evaluation approach The approach proposed in this paper, named WSRecov, uses the web services and the performance measures of the WSTEST (as extended by Microsoft in [10]) and introduces two new elements: 1) measures to characterize the performance and recovery in the presence of faults; and 2) a set of faults. This section presents and discusses the WSRecov test, with particular emphasis on the new elements.
3.1. Measures The WSRecov test measures are computed from the information collected during the execution of the test and follow the well-established measuring philosophy used in the performance benchmarking world. In fact, the measures provided by existing performance benchmarks give relative measures of performance (i.e., measures related to the conditions in which the test was performed) that can be used for system comparison or for system/component improvement and tuning. It is well known that performance benchmark results do not represent an absolute measure of performance and cannot be used for planning capacity or to predict the actual performance of the system in field. In a similar way, the measures proposed in this work must be understood as results that can be useful
to characterize system in a relative fashion (e.g., to compare two alternative solutions). The proposed set of measures has the following characteristics/goals: – Focus on the end-user point of view. – Are derived directly from experimentation. – Allow the characterization of both performance (with and without faults) and recovery time. – Are easily understandable by users. The WSRecov test reports three sets of measures: baseline performance, performance in the presence of faults, and recovery. The baseline performance measures reported are adapted from the WSTest [15, 10] and include: – Throughput (T): average number of web service operations executed per second. – Response time (RT): average response time in seconds. The performance measures in the presence of faults are: – Throughput with faults (T-F): average number of web service operations executed per second in the presence of faults. – Response time with faults (RT-F): average response time (in seconds) in the presence of faults. The recovery related measures are: – Recovery time (R-Time): average time need to recover from faults (in seconds). – Service availability (S-Avail): average service availability during the execution of the experiments. An important aspect is that availability is defined based on the service provided by the system. This way, the system is considered available when it is able to respond to clients. For example, the system is not available if a client submits a web service call and gets no answer or gets an error. In this case, the unavailability period is counted from the moment when a given client submits a call that fails until the moment when it submits a call that succeeds. Service availability is given as a ratio between the amount of time the system is available and the duration of the test.
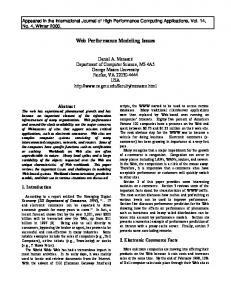
3.2. Setup and procedure Figure 1 presents the test configuration required to run the WSRecov test. The main elements are the System Under Test (SUT) and the Driver System. The SUT consists of the processing units used to execute the web services and whose performance and recovery will be evaluated. The goal of the driver system is to control all the aspects concerning the execution of the test, during which it generates the web services calls, injects the faults, and collects information on the SUT behavior.
Driver System (DS)
WS calls WS responses
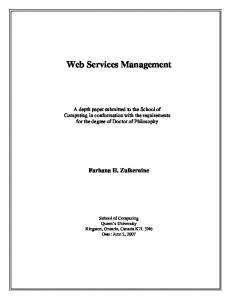
ate the effects of the fault and, if the system was not able to handle the fault autonomously, the required recovery procedure is explicitly started. The recovery time represents the time needed to execute the recovery procedure. The duration of each injection slot is of 10 minutes.
System Under Test (SUT)
Faults
Figure 1. Configuration required to run the WSRecov. The execution of the WSRecov test includes two main steps. In the first step, the web services are executed without any (artificial) faults. This step is equivalent to the execution of the WSTest [10] and the goal is to collect baseline performance measures. In the second step the services are executed in the presence of the faults to measure the impact of faults in the web services execution and system recovery. As shown in Figure 2, the second step of the test is composed by several independent slots. A slot is a measurement interval during which the web services are executed and one fault is injected in a given moment. The SUT state is explicitly restored in the beginning of each slot and the effects of the faults do not accumulate across different slots. As in the WSTest [15, 10], the test in each slot is conducted in a steady state condition that represents the state in which the system is able to maintain its maximum processing throughput. The system achieves a steady state condition after a given time executing the web-services. The identification of the steady state time is a responsibility of the tester. Nevertheless, verifying the steady state condition is normally a quite simple task that consists mainly in executing workload (web-services) to discover the instant when the system reaches the maximum throughput. A fault is injected a certain amount of time (injection time) after the steady state condition has been achieved. After injecting the fault a procedure is executed to evalu-
Steady state condition Testing Slot Start
(System clean restart)
Ramp up time
A system failure occurs when the service delivered by the system deviates from fulfilling the system’s goal [4, 5]. An error is a perturbation of the system state which is prone to lead to a failure. The cause for an error is called a fault. Computer faults can be divided into three well known classes: operator faults (i.e., human mistakes during system operation); 2) software faults (i.e., program defects or bugs); and 3) hardware faults (i.e., typical hardware faults such as bit-flip or stuck-at, or high-level hardware failures like hard disk failures, power failures, and corruption of the storage media). An important aspect concerning fault injection is the concept of fault distance [3]. In a computer system there are several levels where real faults can occur, artificial faults can be injected, and errors can be observed. To characterize a computer system in presence of faults, it is not required that the injected faults are exactly equal to real faults, it is sufficient that they cause similar behaviors (errors). It is worth noting that, different types of faults can provoke similar errors. What is important is to have equivalence in the consequence of the fault and not in the fault itself. As we are particularly interested in the evaluation of the recovery time, we have decided to select faults that fulfill the following goals: – Specifically exercise system recovery. – Are portable among diverse systems (which allows the comparison of different systems).
Phase 2
Phase 1
Slot 1
3.3. Fault model
Slot 2
Fault activation Injection time
Slot 3
Recovery start
Slot N
Recovery end
Recovery time
Testing Slot End
Ramp down Time
(1 min.)
(1 min.)
Measurement Interval (10 minutes)
Figure 2. WSRecov phases and slots.
– Are easy to inject. – Are representative of real scenarios. Our study guided us to the selection of the following types of faults: – Abrupt operating system reboot (OS-AR): represents all kinds of faults that cause an abrupt operating system (OS) reboot. This fault emulates the effects of very common operator faults [2] (e.g., inadvertently pressing the reset button), software faults (e.g., bugs in the operating system or other software components that cause the system to crash), and hardware faults (e.g., power failure, CPU failure, etc). – Abrupt application server reboot (AS-AR): represents all kinds of faults that cause an abrupt application server reboot. This fault emulates common operator faults (e.g., inadvertently killing an operating system process) and software faults (e.g., bugs in the application server or other software components that cause the application server process to crash). – Clean operating system restart (OS-CR): represents faults that cause the operating system to restart in a clean way. This fault emulates operator faults (e.g., inadvertently execute the operating system restart command) and software faults (e.g., bugs that require the system to be restarted). – Clean application server restart (AS-CR): emulates faults that require a clean restart of the applications server, including inadvertently shutting down an OS service and bugs in the software that require the application server process to be restarted. An important aspect in fault injection is the fault trigger that describes the conditions that make the fault to be exposed (i.e., the event that leads to the injection of the fault). The same fault activated in different moments may cause different behavior according to the system state, which means that different instants for the injection of faults should be considered. Fault injection can be randomly distributed over time, specifically distributed over time, or synchronized with a specific event of the workload. The random distribution of faults over time normally requires a large set of faults to achieve some statistical repeatability. On the other hand, injecting faults in specific instants improves the test repeatability as faults are (loosely) synchronized with the workload. To evaluate specific features when some explicit conditions are met, the injection of the faults can also be strictly synchronized with specific events of the workload. In the present work we have decided to inject faults in predefined instants. This way, a number of faults from the types presented above are injected in different moments. This improves the test representativeness in the sense that recovery is performed considering different load conditions and different distances from the beginning of the test. Injecting the faults in well defined moments (i.e.,
very specific injection times) also increases the test repeatability. As mentioned before, a single fault is injected in each slot of the test. As the duration of each slot is of 10 minutes we have decided to inject faults in the following moments: 2, 5 and 8 minutes. These injection times have been postulated taking into consideration practical aspects such as the time needed to run the test and the impact of each type of fault in the systems considered in this study (see Section 4). Note that, although stipulated, the use of these injection times for all systems guarantees a fair evaluation as all SUT are tested in similar conditions. As shown in Table 1, the concrete set of faults injected in each execution of the test is made of 12 faults. # Slots
Fault
1 2 3 4 5 6 7 8 9 10 11 12
Abrupt operating system reboot Abrupt operating system reboot Abrupt operating system reboot Abrupt application server reboot Abrupt application server reboot Abrupt application server reboot Clean operating system restart Clean operating system restart Clean operating system restart Clean application server restart Clean application server restart Clean application server restart
Injection Time 2 5 8 2 5 8 2 5 8 2 5 8
Table 1. Set of faults to be injected.
3.4. Test properties discussion A useful test must be repeatable, portable and representative [5]. To be credible the test must report similar results when run more than once in the same environment. This way, we have performed several experiments to confirm that the WSRecov test fulfills this important requirement. It is worth noting, however, that repeatability has to be understood in statistical terms, as it is virtually impossible to reproduce exactly the same conditions concerning target system state during the execution of the test. In practice, small deviations in the measures in successive runs are normal and just reflect the non-deterministic nature of web services execution. In fact, this is well known for performance benchmarks like TPC-App, as the number of operations measured in successive runs in the same system normally has small fluctuations. In a similar way, WSRecov measures may also observe such small fluctuations. Another important property is portability, as the test must allow the comparison of different systems. Concerning WSRecov, the component that has more influence on portability are the faults. This has been taken into account
in the selection of the faults, which are generic and can be applied in any web services infrastructure. In order to report relevant results, the test must represent real world scenarios in a realistic way. Representativeness is mainly influence by the web services and faults characteristics. For the WSRecov test we have adopted the services from the WSTest, which is accepted by Sun Microsystems and Microsoft (the two main vendors in the area) as representative. In terms of the faults, the types considered are quite representative of real scenarios. Furthermore, the small set of faults considered also emulates the effects of other types of faults normally found in computer systems (which also improves representativeness).
4. Experimental evaluation The goal of the experiments presented in this work is to demonstrate the WSRecov test and to compare three competitive solutions for web services deployment (see table 2). All these systems can be considered as possible alternatives for small and medium size web services infrastructures. In this sense, the experiments presented in the paper give the answer to the following question: Which one of the systems tested is the best choice for a typical web services infrastructure, when considering both performance (with and without faults) and recovery aspects? As mentioned before, the WSRecov tools are available at [11] for download and public use. These tools must be used together with an implementation of the WSTest [10, 15].
Technology
Application Server
OS
IIS
.NET
IIS 5.1
Windows Xp SP2
Glassfish
Java EE 5
Glassfish v1 ur1 p01 build 2
Windows Xp SP2
Tomcat
Java EE 51
Tomcat 6.10
Windows Xp SP2
Table 2. Systems under test.
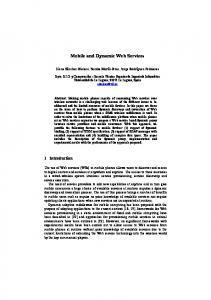
4.2. Performance results Figure 3 presents the performance results with and without faults2. As we can see, Java EE 5 technology presents better throughput than .NET. For instance, baseline throughput in Glassfish is around 3.7 times higher than baseline throughput in IIS. Concerning response time, Java EE 5 presents much lower average response times than .NET, which also favors application servers based in the Java EE 5 technology. T (Op/Sec) 104,33
250 200
RT(Sec)
Performance
300
120 286,25
265,56
99,28
100
263,07
247,76
150 50
80 60
29
100 76,54
69,54
27,27
30,4 29,5
0
40 20 0
IIS
Glassfish
Tomcat
Throughput (T) Throughput w ith f aults (T-F) Response time (RT)
4.1. Experimental setup Table 2 shows the systems under testing (references in the leftmost column will be used later to refer to each system). Two of the main technologies for middleware platforms available today have been considered (Java EE 5 and .NET). The .NET framework has been tested using Internet Information Server on top of Windows Xp. For Java EE 5 two different application servers (Glassfish and Tomcat) have been used. The hardware platform is based on two machines with a 3 GHz Pentium IV processor, 2 GB of RAM, and one SATA disk. The machines are connected using a fast Ethernet network. The systems were configured using default installation parameters. Although this may not portrait real scenarios, it allows evaluating the usefulness of those parameters. The important aspect is that the results presented portrait the systems under testing as they were configured.
System
Response time w ith faults (RT-F)
Figure 3. Performance results (with and without faults). An important aspect is that application servers using the same technology present different performance results. In fact, although Glassfish and Tomcat both use Java EE 5, the first presents better throughput than the latter. The response time is equivalent for both servers. Table 3 presents the throughput degradation caused by faults. As we can see, faults affect systems in diverse manners. In fact, the degradation caused by faults in Tomcat (5.82%) is lower than the degradation in Glassfish (7.23%), which in turn is lower than in IIS (9.15%). 1
Tomcat 6.10 configurations were modified to use Java EE 5 as SOAP stack. 2 The results presented in this section must be understood in the context of the configurations tested (see [11] for details) and do not represent an absolute measure of performance of the software used.
Table 3. Throughput degradation caused by faults.
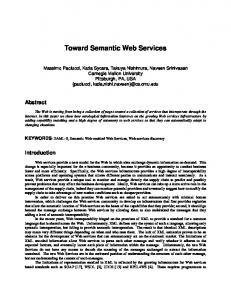
4.3. Recovery results Figure 4 presents the recovery related results. As shown, the recovery time and availability of IIS are similar to Tomcat. On the other hand, Glassfish presents the worst results. This allows us to conclude that recovery is more dependent on the application server specificities than in technology itself (Java EE 5 or .NET). In fact, servers using different technologies (IIS and Tomcat) present similar results.
IIS
Glassfish
0 Baseline
4.4. Systems ranking As mentioned before, one of the goals of the experiments presented in this work is to compare and rank three different solutions for web services deployment using the WSRecov test. Table 4 summarizes the ranking we propose according to several criteria. 2nd C C C
279
50
A very interesting aspect is that, although of being a slow system, the system based in .NET (IIS) recovers from faults faster than the one that presents better throughput and response time (Glasfish), which leads the first to provide higher service availability than the latter.
Best System B B A
285,8
100
263,8
75 Tomcat
247,15
150
226,07
200
80
Figure 3. Recovery results.
Criteria Baseline performance Performance with faults Recovery
250
85
IIS Glassf ish Tomcat
75,35
0
300
66,09
34,95
Impact of Faults in Throughput
261,24
41,35
34,32
T(Op/Sec)
76,41
20
95 90
93,11
40
100
250,28
94,28
94,17
Different faults cause different impacts in the system behavior. Figure 4 presents the average throughput of the slots grouped by the type of fault injected (the first set of bars represent the baseline results). In other words, each set of bars presents the average throughput of the three slots in which the fault presented in the X axis was injected.
239,92
Recovery time (R-Time) Service availability (S-Avail)
80 60
S-Avail(%)
Recovery
100
4.5. Faults characterization
60,33
R-Time(Sec)
(both with and without faults) than the system running .NET technology. The impact of the application server specificities is also relevant, as there are differences between servers that use the same technology for web services deployment. Concerning the global ranking, the analysis of Table 4 and all the results presented in the previous subsections allow us to propose the following order (from the best to the worst): C, B, and A. It is important to note that the global ranking always depends on the user point-of-view (i.e., depends on what he is looking for).
286,25
IIS Glassfish Tomcat
Degradation (%) 9,15 7,23 5,82
263,07
System
With Faults 69,54 265,56 247,76
76,54
Without Faults 76,54 286,25 263,07
3nd A A B
Table 4. Systems ranking. A clear conclusion is that systems running Java EE 5 technology are clearly better in terms of performance
OS-AR
AS-AR
OS-CR
AS-CR
Figure 4. Impact of faults in the throughput. As we can see, some faults have more severe consequences than others. In fact, the faults with higher impact are Abrupt operating system reboot (OS-AR) and Clean operating system restart (OS-CR). The faults Abrupt application server reboot (AS-AR) and Clean application server restart (AS-CR) have a small impact. An important aspect is that the impact of each fault also depends on the application server. For example, the fault Abrupt operating system reboot (OS-AR) has a higher impact on IIS (close to 21% degradation) than on Tomcat (less than 10% degradation). Figure 5 presents the impact of faults in the recovery time. Again, different faults involve different recovery times. The most problematic fault is Clean operating system restart (OS-CR), followed by Abrupt operating system reboot (OS-AR). This is due to the fact that both faults lead to the operating system initialization.
OS-AR
AS-AR
OS-CR
5,3
82,88
77,65
80,87
2,08
0
1,13
0,39
20
16,13
60,95
53,94
40
61,11
80 60
IIS Glassfish Tomcat
Impact of Faults in Recovery Time
0,08
RT-F(sec) 100
AS-CR
Figure 5. Impact of faults in the recovery time.
5. Conclusion This paper presented a practical approach for the comparison of performance and recovery in web services infrastructures in the presence of faults. Given the central role that web services play today, the existence of such approach is a valuable tool when developing an infrastructure for web-services deployment. The approach is especially useful to help web services providers selecting alternative middleware platforms and technologies taking into account the impact of faults. The approach consists in a set of faults that are injected in the system and measures that characterize baseline performance (without faults), performance in the presence of faults, and recovery time. Systems are classified according to the results obtained. The approach was illustrated through a concrete example of benchmarking three alternative software solutions for web services deployment. The experimental results obtained were analyzed and discussed in detail. These results allow us to analyze the impact of faults in web services execution considering different technologies. In addition, results clearly show that a practical approach to compare alternative solutions in terms of both performance and recovery time in the presence of faults is of utmost importance.
6. References [1] A. Avizienis, J.-C. Laprie, B. Randell, “Fundamental Concepts of Dependability”, LAAS Research Report, N°1145, 2001. [2] D. Oppenheimer, A. Ganapathi, D. Patterson, "Why do Internet services fail, and what can be done about it?", USENIX Symposium on Internet Technologies and Systems (USITS'03), 2003. [3] J. Arlat and Y. Crouzet, "Faultload Representativeness for Dependability Benchmarking", International Conference on Dependable Systems and Networks, DSN-2002, Washington, DC, USA, 2002. [4] J. Arlat, A. Costes, Y. Crouzet, J.-C. Laprie and D. Powell, “Fault Injection and Dependability Evaluation of
Fault-Tolerant Systems”, IEEE Trans. On Computers, 42 (8), pp.913-23, 1993. [5] J. Gray (Ed.), “The Benchmark Handbook”, Morgan Kaufmann Publishers, San Francisco, CA, USA, 1993. [6] J. Mauro, J. Zhu, I. Pramanick. “The System Recovery Benchmark,” 2004 Pacific Rim International Symposium on Dependable Computing, PRDC 2004, Papeete, Polynesia, 2004. [7] J.-C. Laprie, “Dependable Computing: Concepts, Limits, Challenges”, 25th International Symposium on FaultTolerant Computing, FTCS-25, Special Issue, Pasadena, CA, USA, 1995. [8] Ji J. Zhu, J. Mauro, I. Pramanick, “Robustness Benchmarking for Hardware Maintenance Events”, IEEE/IFIP Intl Conference on Dependable Systems and Networks, DSN 2003, San Francisco, CA, USA, 2003. [9] Ji J. Zhu, J. Mauro, I. Pramanick. “R3 - A Framework for Availability Benchmarking,” IEEE/IFIP International Conference on Dependable Systems and Networks, DSN 2003, San Francisco, CA, USA, 2003. [10] Microsoft Corporation, “Web Services Performance: Comparing Java 2TM Enterprise Edition (J2EETM platform) and the Microsoft® .NET Framework - A Response to Sun Microsystem’s Benchmark”, 2004. [11] N. Laranjeiro, M. Vieira, “Web-services performance and recovery evaluation tool”, 2006, available at: http://gbd.dei.uc.pt/downloads.php. [12] R. K. Iyer, “Experimental Evaluation”, Special Issue FTCS-25 Silver Jubilee, 25th IEEE Symposium on Fault Tolerant Computing, FTCS-25, 1995. [13] Standard Performance Evaluation Corporation (SPEC), http://www.spec.org [14] Standard Performance Evaluation Corporation, “SPECjAppServer2004 Design Document, Version 1.0.8”, 2005, available at: http://www.spec.org/jAppServer2004/ [15] Sun Microsystems Inc., “Web Services Performance: Comparing JavaTM 2 Enterprise Edition (J2EETM platform) and .NET Framework”, 2004. [16] Transaction Processing Performance Council (TPC), http://www.tpc.org [17] Transaction Processing Performance Council, “TPC BenchmarkTM App (Application Server) Standard Specification, Version 1.1”, 2005, available at: http://www.tpc.org/tpc_app/