Leland, W.E., Taqqu, M.S., Willinger, W., Wilson, D.V.: On the Self-Similar Na- ... Willinger, W., Taqqu, M.S., Sherman, R., Wilson, D.V.: Self-Similarity Through.
End-to-End Performance of Web Services
?
Paolo Cremonesi and Giuseppe Serazzi Dipartimento di Elettronica e Informazione, Politecnico di Milano, Italy, {cremones, serazzi}@elet.polimi.it
Abstract. As the number of applications that are made available over the Internet rapidly grows, providing services with adequate performance becomes an increasingly critical issue. The performance requirements of the new applications span from few milliseconds to hundreds of seconds. In spite of the continuous technological improvement (e.g., faster servers and clients, multi-threaded browsers supporting several simultaneous and persistent TCP connections, access to the network with larger bandwidth for both servers and clients), the network performance as captured by response time and throughput does not keep up and progressively degrades. Several are the causes of the poor “Quality of Web Services” that users very often experience. The characteristics of the traffic (self-similarity and heavy-tailedness) and the widely varying resource requirements (in terms of bandwidth, size and number of downloaded objects, processor time, number of I/Os, etc.) of web requests are among the most important ones. Other factors refer to the architectural complexity of the network path connecting the client browser to the web server and to the protocols behavior at the different layers. In this paper we present a study of the performance of web services. The first part of the paper is devoted to the analysis of the origins of the fluctuations in web data traffic. This peculiar characteristic is one of the most important causes of the performance degradation of web applications. In the second part of the paper experimental measurements of performance indices, such as end-to-end response time, TCP connection time, transfer time, of several web applications are presented. The presence of self-similarity characteristics in the traffic measurements is shown.
1
Introduction
In the last few years, the number of network-based services available on the Internet has grown considerably. Web servers are now used as the ubiquitous interface for information exchange and retrieval both at enterprise level, via intranets, and at global level, via the the World Wide Web. In spite of the continuous increase of the network capacity, in terms of investments in new technologies and in new network components, the Internet still fails to satisfy the needs of a consistent fraction of users. New network-based applications require interactive response ?
This work has been supported by MIUR project COFIN 2001: High quality Web systems.
time ranging from few milliseconds to tens of seconds. Traditional best-effort service that characterizes the Internet is not adequate to guarantee strict response time requirements of many new applications. Hence, the need for Quality of Service (QoS) capabilities. In order to develop techniques that allow to improve performance, it is important to understand and reduce the various sources of delay in the response time experienced by end users. The delays introduced by all the components, both hardware and software, that are involved in the execution of a web service transaction are cumulative. Therefore, in order to decrease the end-to-end response time it is necessary to improve all the individual component response times in the chain, and primarily that of the slowest one. A first effort should be devoted to the analysis of the workload characteristics with the goal of identifying the causes of traffic fluctuations in the Internet. Such fluctuations contribute to transient congestions in the network components and therefore are the primary sources of the response time increase. At the application level, it is known that the applications that contribute major portions of the network traffic transmit their load in a highly bursty manner, which is a cause of further congestion. The complexity of the network structure and the behavior of the transport/network protocols play a fundamental role in the propagation of the fluctuations from the application level to the link level. The complexity of the Internet infrastructure, from the network level up to the application level, results in performance indexes characterized by high variability and long–range dependence. Such features introduce new problems in the analysis and design of networks and web applications, and many of the past assumptions upon which web systems have been built are no longer valid. Usual statistics as average and variance become meaningless in the presence of heavy-tailedness and self-similarity. The paper is organized as follows. In Sect. 2 we illustrate some of the main sources of web delays: the complexity of the request path browser-server-browser and the origin of the self-similarity property in the Internet traffic are analyzed. In Sect. 3, experimental results concerning the heavy-tailedness properties of end-to-end response times of some web sites are presented. Section 4 describes few case studies that show how to measure and improve web user satisfaction. Section 5 summarizes our contributions and concludes the paper.
2
Sources of web delays
One of the typical misconceptions related to the Internet is that the bandwidth is the only factor limiting the speed of web services. Thus, with the diffusion of broadband networks in the next few years, high performance will be guaranteed. This conclusion is clearly wrong. Indeed, although high bandwidth is necessary for the efficient download of large files such as video, audio and images, as more and more services are offered on the Internet, a small end-to-end response time, i.e., the overall waiting time that
end users experience, is becoming a requirement. The main components that contribute to the end-to-end response time fall into three categories: client side, server side, and network architecture and protocols. On the client side, the browser parameters, such as the number of simultaneous TCP connections, the page cache size, the memory and computation requirements of the code downloaded from the server (applet, java scripts, plugins, etc.), and the bandwidth of the access network, must be taken into account. On the server side, among the factors that should be carefully analyzed are: the behavior of the server performance with respect to the forecast workload increase, some of the application architecture parameters (e.g., multithreading level, maximum number of opened connections, parallelism level), the CPU and I/O power available (as demand for dynamic content of pages increases, more and more computational power and I/O performance/capacity are required), and the bandwidth of the access network. The Internet network architecture is characterized by the large number of components that a user request visits along the path between the browser and the web server and back. Each of these components, both hardware and software, introduces some delay that contribute to the creation of the end-to-end response time. The global throughput of a connection between a browser and a web server, and back, corresponds to the throughput of the slowest component in the path. This component, referred to as bottleneck, is likely in a congestion state and causes severe performance degradation. Two are the factors that contribute to the congestion of a component: the frequency of the arriving requests and the service time required for the complete execution of a request. These two factors are related to the characteristics of the workload and to the characteristics of the component. Thus, concentrating only on the bandwidth with the objective of providing a small end-to-end response time it is not enough. In this section we will analyze some of the most important sources of web delays, namely, the complexity of the path between browsers and servers, and the self-similarity characteristic of Internet traffic. 2.1
The complexity of the request path
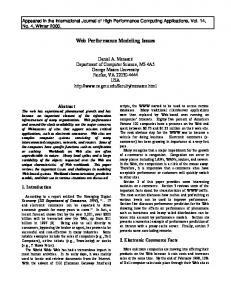
A current trend in the infrastructure of the Internet is the increase of the complexity of the chain of networks between a client and a server, that is, the path in both directions between the user browser and the web server, also referred to as request path. From the instant a request is issued by a browser, a series of hardware components and software processes are involved in the delivery of the request to the server. Hardware components comprise routers, gateways, intermediate hosts, proxy cache hosts, firewalls, application servers, etc. Software processes involved in the delivery of a request refer to the protocol layers (HTTP, TCP, IP, and those of lower layers), the routing algorithms, the address translation process, the security controls, etc. In Fig. 1, a simplified model of a request path between a user browser and a web server is illustrated.
user browser
Internet Service Provider
National Service Provider
International Backbone
National Service Provider
Internet Service Provider
web server
routers, gateways, hosts switches, firewalls
Fig. 1. Simplified model of a request path from a user browser to a web server.
As a consequence, the end-to-end chain of components, or hops, between a client browser and a web server (including also the return path) may be very long. They can be subdivided into the hops located in the access networks (ISP and NSP), both on the client and server sides, the hops located in the server farm or the corporate intranet, if not used, and the hops in the Internet infrastructure (mix among national and international carriers, international backbone, routers, etc.). Several statistics collected at business users show that the average number of hops is increasing with the popularity of Internet, reaching an average value of about 15-20. The trend is clearly towards an increase of the number of hops since the architectures of the Internet and of the intranets and server farms are becoming more and more complex due to various new functions to be executed (e.g., security controls, complex back–end applications). The majority of the components of a request path operate on a store-and-forward basis, i.e., the incoming requests are queued waiting to use the resource, and thus are potential source of delays. The request path browser-server-browser, represented in Fig. 1, can be modeled as an open queueing network, i.e., a network of interconnected queues characterized by more sources of arriving requests and by the independence of the arrival processes from the network conditions. Queueing networks are well suited for representing resource contention and queueing for service (see, e.g., [6]). In an open network the number of customers can grow to infinity depending on the saturation condition of the bottleneck resource. Assuming that the distributions of request interarrival times and service times at all resources are exponential and that the scheduling discipline at each resource is FCFS, a typical characteristic of such networks [8] is that each resource behaves like an independent M/M/1 queue. In this case the response time tends to a vertical asymptote as the load increases until the resource saturation. The rate of increase of a component response time R, normalized with respect to the square of service time S, as a function of the request arrival rate λ is given by: dR 1 1 1 = = dλ S 2 (1 − λS)2 (1 − U )2
(1)
where U = λS is the utilization of the component, i.e., the proportion of time the component is busy. As it can be seen from Fig. 2, when the arrival rate is
such that the utilization is greater than 80%, the rate of increase of the response time is extremely high, i.e., the resource is congested and the delay introduced in the packet flow is huge.
400
response time (rate of increase)
350 300 250 200 150 100 50 0 0
0.1
0.2
0.3
0.4
0.5
0.6
0.7
0.8
0.9
1
utilization
Fig. 2. Rate of increase of response time of a component (normalized with respect to the square of service time) vs component utilization.
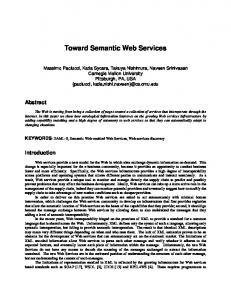
The burstiness of Internet traffic produces a variability in the request interarrival time much higher than the one exhibited by traffic following exponential assumption, making the actual situation even worse than the one described by (1). As a consequence, the probability of finding a congested component along a request path is much higher than in usual telecommunication environments. Thus, the further away the client browser is from the web server, the greater the likelihood that one, or more, components of the path is found congested. Let p be the probability that a component is in a congestion state and let n be the number of (independent) components along the request path, including the return path, the probability of finding exactly i congested components is µ ¶ n pi (1 − p)n−i , i = 0, 1, 2, ..., n (2) i and the probability of finding at least one component congested is 1−(1−p)n . In Fig. 3, the probability of finding one or more congested components (i.e., of a very high response time experienced by a user) along a request path browser-serverbrowser as a function of the congestion probability p of a single component and the path length n is reported. The maximum number of components considered
in a path is 15, a conservative value if compared to the actual average situation encountered in the Internet. As it can be seen, with a probability of congestion of a component p = 0.01, i.e., 1%, and a path length n = 15 hops, the probability of finding at least one component congested is 13.9%, a clearly high value.
prob. of high response time
1 0.8 0.6 0.139 0.4 0.2 0 15 10 5
path length
0
0
0.05
0.1
0.15
0.2
prob. of comp. congestion
Fig. 3. Probability of finding one or more congested components along a request path browser-web server-browser (i.e., of a very high response time) as a function of the congestion probability p of a single component and the path length n.
2.2
The self-similarity of web traffic
The World Wide Web is a more variable system than it was expected. Several analyses show that the limited variability notion widely used for several decades in telecommunication modelling, i.e., the assumption of the Poisson nature of traffic related phenomena, has very little in common with Internet reality. Evidence is provided by the fact that the behavior of the aggregated traffic does not become less bursty as the number of sources increases [12]. More precisely, models in which the exponential distribution of the variables is assumed are not able to describe Internet conditions in which the variables (e.g., duration of the sessions, end-to-end response times, size of downloaded files) show a variability encompassing several time scales. The high temporal variability in traffic processes is captured assuming the long-term dependence of
the corresponding variables and the heavy-tail distribution of their values (i.e., distribution whose tail declines according to a power-law). A distribution is heavy-tailed (see, e.g., [5]) if its complementary cumulative distribution 1 − F (x) decays slower than the exponential, i.e. if lim eγx [1 − F (x)] → +∞
(3)
x→+∞
for all γ > 0. One of the simplest heavy-tailed distributions is the Pareto distribution, whose probability density function f (x) and distribution function F (x) are given by (see, e.g., [15]): f (x) = α k α x−α−1 ,
F (x) = 1 − k α x−α ,
0 < k ≤ x,
α>0
(4)
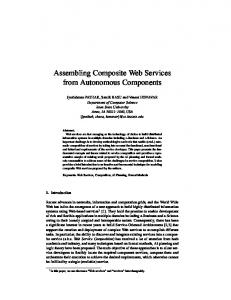
where k is a positive constant independent of x and α represents the tail index. If 1 < α < 2, the random variable has infinite variance, if 0 < α ≤ 1 the random variable has infinite mean. Note that the first and second moments are infinite only if the tail stretches to infinity, while in practice infinite moments are exhibited as non-convergence of sample statistics. An interesting property exhibited by the processes whose values follow heavytailed distributions is the self-similar, or fractal-like, behavior, i.e., the behavior of the variables is invariant over all time scales. The autocorrelation function of self-similar time series declines like a power-law for large lags. As a consequence, autocorrelations exist at all time scales, i.e., the high values of the tail of the distribution occur with non-negligible probability and the corresponding traffic is bursty. The probability density functions (in log scale) of several Pareto random variables, with different parameters α and k (4), are compared with the probability density function (dashed line) of an exponential variable in Fig. 4. All the functions have the same mean value equal to one. As it can be seen, the tails of the Pareto random variables are much higher than the one of the exponential random variable. Evidence of Internet traffic self-similarity is reported in several papers. This type of behavior has been identified in high-speed Ethernet local area networks [9], in Internet traffic [16], in the file sizes of the web servers and in the think time of browsers [4], in the number of bytes in FTP transmissions [12], and in several others variables. As we showed, the self-similarity property of Internet traffic implies that the values of the corresponding variables exhibit fluctuations over a wide range of time scales, i.e., their variance is infinite. The peculiar nature of the load generated at the application layer, the self-similarity and the heavy-tail characteristics, propagates to lower layers affecting the behavior of the transport and network protocols. This, in turns, induces a self-similarity behavior of the link traffic negatively affecting network performance. The most important causes of such a high variability and of its ubiquitous presence at all layers in the network environment fall into three categories: the sources related ones, the request path related ones, and the protocols related ones.
0
10
α=1.1 k=0.09 α=1.5 k=0.33
−2
f(x)
10
−4
10
α=4 k=0.75 α=3 k=0.66 α=2 k=0.5
−6
10
exponential −8
10
0
5
10
15
20
x
Fig. 4. Probability density functions (in log scale) of several Pareto random variables, with different parameters α and k, compared with the probability density function (dashed line) of an exponential random variable; the mean value of all the functions is one.
The activity of a typical Internet user can be regarded as a sequence of active periods interleaved with idle periods. Observing the usage patterns of the most significant Internet applications, like the retrieval/download/upload cycle of web files using HTTP, the file transfer with FTP, and the send/receive process of SMTP, their execution can be seen as a sequence of activity phases, during which a given amount of data is transferred from one site to another, intermixed with idle phases, when users analyze the downloaded objects (or pages) and type a message or issue a new command, but no load is generated on the network. Such a behavior favors the known burstiness of application data transmission. Thus, a user can be modeled as a source of traffic that alternates between two states identified with ON and OFF, respectively. ON/OFF sources are widely used to model the workload generated by the users of the Internet. During the ON periods, the source is active and data packets are sent on the network, i.e., a burst of load is generated. During the OFF periods, no activity is performed. The characteristics of the ON and OFF periods, e.g., average durations, distributions, traffic generation rates, depend on the application considered. Typically, in the ON periods the traffic is generated at constant rate and the lengths of ON and OFF periods follow known distributions, that may differ from each other, having finite or infinite variance. The very high, or infinite, variance of the input traffic parameters is explained by the results of several empirical studies (see, e.g., [2]) that have shown the presence of self-similarity in the size distribution of web files transferred over the network and thus of their transmission times. At a more aggegated level than the one of a single source, the traffic generated by a set of users can be modeled considering several ON/OFF sources sharing the
network resources. It has been shown [16] [17] that, under certain assumptions, the superposition of many ON/OFF sources generates a process exhibiting the long-term dependency characteristic. Thus, the corresponding model is able to capture the self-similar nature of Internet traffic. Another phenomenon that influences the origin of fluctuations of Internet traffic (at a more macroscopic level than the one seen at single source level) is related to the amount of correlation existing among the sources. Empirical observations suggest the presence of traffic cycles on a temporal basis, among which the daytime cycle is the most evident. The existence of such a cycle is enough intuitive and is connected to office working hours and availability periods of some on-line services (e.g., typically the traffic peaks during the morning and the afternoon hours). The time difference across the globe may also generate cycles with different periodicity. Other types of source correlations are generated by the occurrence of special events (sport competitions, natural disasters, wars, etc.). As we have seen, the Internet is a network environment where load fluctuations should be considered physiological rather than exceptional events. The self-similarity characteristic of the load propagates its effects on all the network layers, from the application to the link layer. As a consequence, transient congestions may occur with non-negligible probability in each of the components along the request path browser-server-browser (Sect.2.1). While the task of performance optimization is relatively straightforward in a network with limited load variability, it becomes significantly more complex in the Internet because of transient congestions. The load imbalance in the resources, usually modeled as an open network of queues (Fig. 1), of a request path will be extreme and will grow as the load increases. Thus, the probability of finding a component subject to transient congestion in a relatively long request path, e.g., of about 15 hops, is consistent (Fig. 3). When a fluctuation of traffic creates a congestion in a component (e.g., a router) of an open network of queues, the performance degradation due to the overload is huge since the asymptotes of the performance indices are vertical (Fig. 2): the response time increases several orders of magnitude, the throughput reaches saturation, and the number of customers at the congested component tends to infinity. This unexpected increase of response time triggers the congestion control mechanism implemented in the TCP protocol in order to prevent the source of traffic from overloading the network. Since the source uses a feedback control, directly computed from the network or received from intermediate components, to tune the load sent on the network, the increase of response time (in this context usually referred to as round trip time) beyond a threshold value triggers an immediate reduction of the congestion window size, thus a reduction of the traffic input on the network. The throughput decreases suddenly and will increase slowly according to the algorithm implemented by the TCP version adopted. The various versions of TCP implement different congestion control mechanisms inducing a different impact on network performance [11]. Clearly, this type of
behavior introduce further fluctuations in the throughput and, more generally, in the indices capturing the traffic of the Internet.
3
Measurements of end-to-end performance
In the previous section we have seen that there is a wide evidence of high variability and self-similarity in aggregate Internet traffic. In this section we will see that this property is valid also for end-to-end performance. 3.1
Experiments
The monitoring system used to collect the data consists of a Java–based tool WPET (Web Performance Evaluation Tool) developed at the Politecnico di Milano. WPET is composed by a set of agents for the collection of Internet performance data. Each agent is an automated browser that can be programmed to periodically download web pages and to measure several performance metrics (e.g., download times). Each agent is connected to Internet through a different connection type (e.g., ISDN, xDSL, cable, backbone), from different geographical locations (e.g., Rome, Milan) and through different providers. A WPET agent can surf on a web site performing a set of complex operations, such as fill a form, select an item from a list, follow a link. An agent can handle HTTP and HTTPS protocols, session tracking (url-rewriting and cookies) and plug-ins (e.g., flash animations, applets, activexes). For each visited page, the agent collects performance data for all the objects in the page. For each object, several performance metrics are measured: DNS lookup time, connection time, redirect time, HTTPS handshake time, server response time, object download time, object size, error conditions. All the data collected by the agents are stored in a centralized database and analyzed in order to extract meaningful statistics. 3.2
Evidence of heavy-tail distribution
Figure 5 shows the time required to download the home page of the MIT web site (www.mit.edu). Measurements have been collected for 9 days (from March, 20th till March, 28th 2002) downloading the home page every 15 minutes with a WPET agent located in Milan and connected to Internet directly through a backbone. The upper part of the figure shows a sample of the download times. In order to investigate the heavy-tail properties of the download times, a log-log plot of the page time complementary cumulative distribution is shown in the lower left part of Fig. 5. This plot is a graphical method to check the heavy-tailedness property of a sequence of data. If a good portion of the log-log complementary plot of the distribution is well fitted by a straight line then the distribution hold the heavytail property. The plot of Fig. 5 is well approximated by a straight line with slope −3.2, indicating that the distribution is the Pareto one (4) with α = 3.2 [17].
www.mit.edu
download time (sec.)
25 20 15 10 5 0
20/03
21/03
22/03
23/03
24/03
25/03
26/03
27/03
28/03
day 0
10
25 20
−1
1−F(x)
Y Quantiles
α = 3.2
10
−2
10
15 10 5
−3
10
2
10
3
4
10
10
5
10
0
0
5
10
x
15
20
25
X Quantiles
Fig. 5. Download times of the home page of the MIT web site (upper part). Log-Log complementary plot of cumulative distribution F (x) (lower left). Quantile-quantile plot of the estimated Pareto distribution vs. the real distribution (lower right).
While the log-log complementary distribution plot provides solid evidence for Pareto distribution in a given data set, the method described above for producing an estimate for α is prone to errors. In order to confirm the correctness of the estimated parameter α we can use the quantile-quantile plot method (lower right part of Fig. 5). The purpose of this plot is to determine whether two samples come from the same distribution type. If the samples do come from the same distribution, the plot will be linear. The quantile-quantile plot in Fig. 5 shows quantiles of the measured data set (x axis) versus the quantiles of a Pareto distribution with tail parameter α = 3.2 (y axis). The plot confirms the correctness of the results. Figures 6 and 7 extend the analysis by comparing the download times of the home pages of four web servers: – – – –
Massachusetts Institute of Technology (www.mit.edu) Standford University (www.standford.edu) Google www.google.com) Altavista (www.altavista.com).
The four plots in both the figures show the log-log complementary cumulative distributions (continuous lines), together with the approximating Pareto distributions (dashed lines). The measurements of Fig. 6 have been collected with a WPET agent running on a system directly connected on a backbone. The measurements of Fig. 7 have been collected with an agent connected to the Internet via an ADSL line. Both the agents were located in Milan. All the figures confirm the heavy-tail property of end-to-end download times.
www.mit.edu − α=3.2
0
10
−1
−1
10 1−F(x)
1−F(x)
10
−2
10
−3
−2
10
0
10
2
−1
10
www.google.com − α=2.33
0
0
10
1
10
2
10
www.altavista.com − α=3.11
0
10
−1
−1
10 1−F(x)
10 1−F(x)
10
10
10
−2
10
−2
10
−3
10
−2
10
−3
10
www.standford.edu − α=2.66
0
10
−3
0
10
1
10
2
10
10
−1
10
0
1
10 10 download time (sec.)
2
10
download time (sec.)
Fig. 6. Log-Log complementary plots of the home page download times distribution of four web sites measured from a backbone Internet connection. The real data distribution (continuous line) and the approximated Pareto distribution (dashed line) are shown. The estimated tail index α is reported on each plot.
It is interesting to observe that all the plots in Fig. 7 (ADSL connection) have a lower value of α with respect to the corresponding plots in Fig. 6 (backbone connection). We remember that lower values of α mean higher variability. This suggests that slow client connections are characterized by high variability, be-
cause (i) the source of congestion is in the network, not in the client connection, and (ii) the overhead of retransmissions is higher for slower client connections.
www.mit.edu − α=1.94
0
10
−1
−1
10 1−F(x)
1−F(x)
10
−2
10
−3
−1
10
0
1
10
10
2
−2
10
www.google.com − α=2.13
0
0
10
2
10
www.altavista.com − α=2.61
0
10
−1
−1
10 1−F(x)
10 1−F(x)
10
10
10
−2
10
−2
10
−3
10
−2
10
−3
10
www.standford.edu − α=1.84
0
10
−3
0
10
1
10
2
10
download time (sec.)
10
−2
10
0
10
2
10
download time (sec.)
Fig. 7. Log-Log complementary plots of the home page download times distribution of the same four web server of Fig. 6measured from an ADSL Internet connection. The real data distribution (continuous line) and the approximated Pareto distribution (dashed line) are shown. The estimated tail index α is reported on each plot.
3.3
Evidence of self-similarity
In Fig. 8 we use the wavelet-based method proposed by Abry and Veitch [1] for the analysis of self-similar data and for the estimation of the associated Hurst parameter (for a formal definition of self-similarity see, e.g., [1]). Here we recall that the Hurst parameter H measures the degree of long-range dependence. For self-similar phenomena its value is between 0.5 and 1, and the degree of self-similarity increases as the Hurst parameter approaches 1. For short-range dependent processes, H → 0.5. Abry and Veitch’s method utilizes the ability of wavelets to localize the energy of a signal associated with each time-scale. It is
possible to study the scaling of a process by log-plotting the energy associated with several time-scale: a signal which is self-similar will yield a linear plot for the larger times scales. The slope m of the linear portion of the plot is related to the Hurst parameter by the equation H=
m+1 2
(5)
Figure 8 shows the scaling properties of the MIT home page download times plotted in Fig. 5. The wavelet energy (continuous line) is approximated with a straight line (dashed line) with slope m = 0.90. According to (5), the measurements are consistent with a self-similar process with Hurst parameter H = 0.95 (very close to 1).
H = 0.95 32
31
energy
30
29
28
27
26 30 min
1h
2h 4h time scale
8h
16 h
Fig. 8. Scaling analysis of the download times of MIT web site home page. The wavelet energy (continuous line) is approximated with a straight line (dashed line) with slope 0.90.
4
Improving web performance
For web sites that need to retain users beyond the first page there is a strong motivation to reduce the delay between the browser click and the delivery of the page content on the user’s screen. Although there are many reasons behind poor web performance which are not due to the web server alone (e.g., low
bandwidth, high latency, network congestion), in this section we discuss some remedial actions that can be taken in order to reduce the negative influence of such factors on the user end-to-end response time. In Sect. 4.1 an analysis of how long users are willing to wait for web pages to download is described. Section 4.2 presents some case studies oriented to the detection of performance problems and to the improvement of the end-to-end performance of web sites. 4.1
User satisfaction
User-perceived response time has a strong impact on how long users would stay at a web site and on the frequency with which they return to the site. Acceptable response times are difficult to determine because people’s expectations differ from situation to situation. Users seem willing to wait varying amounts of time for different types of interactions [13]. The amount of time a user is willing to wait appears to be a function of the perceived complexity of the request. For example, people will wait longer: – for requests that they think are hard or time-consuming for the web site to be performed (e.g. search engines); – when there are no simple or valid alternatives to the visited web site (e.g., the overhead required to move a bank account increases the tolerance of home banking users). On the contrary, users will be less tolerant to long delays for web tasks that they consider simple or when they know there are valid alternatives to the web site. Selvidge and Chaparro [14] conducted a study to examine the effect of download delays on user performance. They used delays of 1 second, 30 seconds, and 60 seconds. They found that users were less frustrated with the one-second delay, but their satisfaction was not affected by the 30 seconds response times. According to Nielsen, download times greater than 10 seconds causes user discomfort [10]. According to a study presented by IBM researchers, a download time longer than 30 seconds is considered too slow [7]. Studies on how long users would wait for the complete download of a web page have been performed by Bouch, Kuchinsky and Bhatti [3]. They reported good ratings for pages with latencies up to 5 seconds, and poor ratings for pages with delays over 10 seconds. In a second study, they applied the incremental load of web pages (with the banner first, text next and graphics last). Under these conditions, users were much more tolerant of longer latencies. They rated the delay as “good” with latencies up to 30 seconds. In a third study they observed that, as users interact more with a web site, their frustration with downloading delays seems to accumulate. In general, the longer a user interacts with a site (i.e., the longer is the navigation path), the less delay he will tolerate. In Fig. 9 we have integrated the results of these studies in order to identify two thresholds for the definition of a user satisfaction. The thresholds are function of the navigation step:
– the lower threshold (continuous line) identifies the acceptable experience: users are always satisfied when web pages have a latency up to the lower threshold, independently of the situation; – the higher threshold (dashed line) identifies the unsatisfactory experience: users will not tolerate longer latencies, independently of the other conditions.
30 acceptable unacceptable
download time (sec.)
25
20
15
10
5
0 1
2
3
4
5
10
20
navigation step
Fig. 9. User satisfaction as a function of the navigation steps. Users are always satisfied with web pages whose download time is below the lower threshold (continuous line). Users will not tolerate latencies longer than the upper threshold (dashed line).
4.2
Optimization issues
The possible sources of unsatisfactory end-to-end delays fall into three categories: – Network problems: high delays are originated by network problems along the path connecting the user to the web site (such problems can be classified into insufficient bandwidth at the client/web site or congestions in a network component). – Site problems: one or more components of the web site are under-dimensioned (e.g., web server, back-end systems, firewall, load balancer). – Complexity problems: page content and web applications are not optimized (e.g., too many objects in a page, usage of secure protocols with high overhead to deliver non-sensitive information, low-quality application servers).
Figure 10 shows the performance of an Italian web site. Measurements have been collected for two weeks (from December, 23th 2001 to January, 5th 2002) downloading the home page every 30 minutes during work hours (8.00–20.00) with three WPET agents located in Milan. Each agent was connected to the Internet with a 64kbit ISDN line with a different provider. Each bar in the figure is the median of the measurements collected in one day. The three main components of the page download time, namely the connection time (i.e., the round-trip or network latency time), the response time of the server and the transfer time (or transmission time) are reported. It is evident that the web site has performance problems because the average download time for the home page is higher than 30 seconds (i.e., the maximum tolerance threshold) for all the 14 days. The most probable source of problems resides in the network at the web side. In fact, the average connection time, which measures the round-trip time of one packet between the client and the server, is about 10 seconds, while it should be usually smaller than one second.
60 connection response transfer
download time (sec.)
50
40
30
20
10
0 23−dec
30−dec
06−jan date
13−jan
20−jan
Fig. 10. End-to-end response time for the download of the home page of a web site with network problems. The three basic components, the TCP/IP connection time, the server response time and the page transfer time are shown.
Figure 11 shows the performance of a second web site. Measurements have been collected according to the same scheme of the previous experiment. The performance of this web site are satisfactory, although not excellent. Download
time is always lower than 30 seconds but higher than 10 seconds. Connection time is always around 1 second. However, there is still space for optimizations. In fact, the average response time, which measures the time required for the web server to load the page from disk (or to generate the page dynamically), is about 10 seconds in most of the cases. By adding new hardware or improving the web application, the response time should be reduced to 1–2 seconds.
30
connection response transfer
download time (sec.)
25
20
15
10
5
0 23−dec
30−dec
06−jan date
13−jan
20−jan
Fig. 11. End-to-end response time for the download of the home page of a web site with server problems. The three basic components, the TCP/IP connection time, the server response time and the page transfer time are shown.
Figure 12 presents an example of a complexity problem. The figure shows a page component plot. Each vertical bar in the plot represents the download time of a single object in the page. The bar in the lower-left corner is the main HTML document. All the other bars are banners, images, scripts, frames, etc. The time required to download the whole page is measured from the beginning of the first object to the end of the last object to complete the download. Together with the download time, the figure shows the dimension of each object. The measurements have been collected with an agent connected to a backbone. The object pointed out by the arrow is a small one (about 1.5 KByte) but it is the slowest object in the page (it requires almost 20 seconds for its complete download). Without this object the whole page would be received in less than 8 seconds. This object
is a banner downloaded from an external ad-server which is poorly connected to the Internet. Because of the banner, the users experience a long delay. A possible way for the web site to improve the performance experienced by the end user is to download off-line the banners from the ad-server and to cache them locally into the web server.
25
16 14 object size
12 10
15
8 10
KByte
download time (sec.)
20
6 4
5 2
objects
Fig. 12. Page components plot. Vertical bars represent the download times for all the objects in the page. The line indicates the dimension of each object. The object pointed by the arrow is a banner.
Figure 13 is another example of complexity problem. Although the overall size of the page is rather small (less than 100 KBytes) the page is composed of more than 50 small different objects. The overhead introduced with the download of each object (e.g., DNS lookup time, connection time, response time) makes more convenient for a web site to have pages with few big objects than pages with many small objects.
5
Conclusions
In this paper we have analyzed the origins of the high fluctuations in web traffic. The sources of these fluctuations are located into the characteristics of the applications, the complexity of the network path connecting the web user to the web server, the self-similarity of web traffic (file sizes and user think times), and the congestion control mechanism in the TCP/IP protocol. Empirical evidence of self-similar and heavy-tail features in measured end-to-end web site performance is provided. We have integrated this technical knowledge with the results of recent studies aimed at determining the effects of long download delays on users satisfaction. We have showed that users satisfaction can be modelled with
30
25
25 object size 20
15 15
KByte
download time (sec.)
20
10 10 5
5
objects
Fig. 13. Page components plot. Vertical bars represent the download times for all the objects in the page. The line indicates the dimension of each object.
two thresholds. Simple guidelines for the detection of web performance problems and for their optimization are also presented.
References 1. Abry, P. and Veitch, D.: Wavelet analysis of long-range dependent traffic. IEEE Trans. on Information Theory 44 (1998) 2–15. 2. Barford, P., Bestavros, A., Bradley, A., Crovella, M.E.: Changes in Web Client Access Patterns: Characteristics and Caching Implications. World Wide Web Journal 2 (1999) 15–28. 3. Bhatti, N., Bouch, A., Kuchinsky, A.: Integrating User–Perceived Quality into Web Server Design. Proc. of the 9th International World-Wide Web Conference. Elsevier (2000) 1–16. 4. Crovella, M.E., Bestavros, A.: Self-Similarity in World Wide Web traffic evidence and possible causes. IEEE/ACM Trans. on Networking 5 (1997) 835–846. 5. Feldmann, A., Whitt. W.: Fitting mixtures of exponentials to long-tail distributions to analyze network performance models. Performance Evaluation 31 (1998) 245– 279. 6. Haverkort, B.R.: Performance of Computer Communication System: A Modelbased Approach. Wiley, New York (1998). 7. IBM: Designed for Performance. http://www.boulder.ibm.com/wsdd/library/techarticles/hvws/perform.html 8. Jackson, J.R.: Network of waiting lines. Oper. Res. 5 (1957) 518–521. 9. Leland, W.E., Taqqu, M.S., Willinger, W., Wilson, D.V.: On the Self-Similar Nature of Ethernet Traffic. IEEE/ACM Trans. on Networking 2 (1994), 1–15. 10. Nielsen, J.: Designing Web Usability. New Riders (2000). 11. Park, K., Kim, G., Crovella, M.E.: On the Effect of Traffic Self-similarity on Network Performance. Proc. of the SPIE International Conference on Performance and Control of Network Systems (1997) 296–310.
12. Paxon, V., Floyd, S.: Wide area traffic: The failure of Poisson modeling. IEEE/ACM Trans. on Networking 3 (1995) 226–244. 13. Ramsay, J., Barbesi, A., Preece, J.: A psychological Investigation of Long Retrieval Times on the World Wide Web. Interacting with Computers 10 (1998) 77–86. 14. Selvidge, P.R., Chaparro, B., Bender, G.T.: The World Wide Wait: Effects of Delays on User Performance. Proc. of the IEA 2000/HFES 2000 Congress (2000) 416–419. 15. Trivedi, K.S.: Probability and Statistics with Reliability, Queueing and Computer Science Applications. Wiley, New York (2002). 16. Willinger, W., Paxon, V., Taqqu, M.S.: Self-Similarity and Heavy-Tails: Structural Modeling of Network Traffic. In A Practical Guide To Heavy Tails: Statistical Techniques and Applications. R.Adler, R.Feldman and M.Taqqu Eds., Birkhauser, Boston (1998) 27–53. 17. Willinger, W., Taqqu, M.S., Sherman, R., Wilson, D.V.: Self-Similarity Through High-Variability: Statistical Analysis of Ethernet LAN Traffic at the Source Level. IEEE/ACM Trans. on Networking 5 (1997) 71–86.