Comparison between the Results from Different Ground Vegetation Cover Estimation Methods in a Rangeland Environment* Qiming Zhou Department of Geography, Hong Kong Baptist University Kowloon Tong, Kowlong, Hong Kong Phone: (852) 23395048; Fax: (852) 23395990; E-mail:
[email protected] Marc Robson and Geoffrey Horn School of Geography, University of New South Wales Sydney, NSW 2052, Australia Phone: (02) 93854394; Fax: (02) 93137878; E-mail:
[email protected]
Abstract This paper reports a recent research project that focused on improving field techniques for vegetation cover estimation for rangeland remote sensing. Three cover estimation techniques were trailed at Fowlers Gap Station in western New South Wales in Australia. The field sampling results from wheel point and line intercept were compared with digital images that were acquired from a digital camera mounted on a 7m pole. The statistical analysis of the field sampling results has shown that the current field methods exhibited a significant difference in their field estimations of vegetation cover. The range in cover estimates could reach as high as 50%. It was also impossible to reliably estimate vegetation cover of a one-hectare site after the measurement of 48 transects and 48 pseudo-quadrats – a much higher sampling frequency than those used in many rangeland remote sensing projects.
Introduction Rangeland constitutes 74% of Australian continent and maintaining the land in a sustainable condition has been drawing great attention of Australian public. Extensive livestock production is the major land use on the rangelands with large areas of land required per head of livestock. The rangelands support large proportion of Australia’s cattle and sheep production which are mainly for export sale, thus providing substantial input into the domestic economy (Frazier, et al., 1994). Management of rangelands is ecological in nature, of a low energy input and involving actions that seek to modify, rather than control, the natural forces operating on the land. To maintain the rangelands in a productive condition, a land manager must be able to monitor conditions at a level commensurate with the large areas involved, typically low productivity per unit area, and constraints of labour availability. Remote sensing technology is recognised as an appropriate tool for rangeland management given that it is capable of providing information on the state of vegetation on a regular, continuous and near realtime basis. However, to be useful for land management, remotely-sensed data must be processed and interpreted in the context of geographical and management information. It is now widely accepted that Geographical Information Systems (GIS), when incorporated with remotely-sensed data, can offer farm managers a useful tool for monitoring environmental conditions and allocating livestock in a spatially efficient manner under rangeland conditions. This is particularly important to assist farmers to manage their land during ‘critical’ periods, eg. during severe droughts which have now become a national-wide environmental and economic concern. One of the obstacles that limit remote sensing application to rangeland farm management is the poor computational models which link spectral characteristics recorded by remote sensors to vital parameters for rangeland management, such as quantitative measurements of vegetation cover and biomass. This is particularly a significant problem in Australian rangelands where ‘mixed’ land cover types (ie. mixture of live and died vegetation, bare soil and stony materials) are typical within the resolution of available remotely sensed data (eg. Landsat TM). For years, research efforts have been made in Australian rangelands (eg. Graetz and Gentle, 1982; Pech, et al., 1986; Graetz, et al.; 1988; Pickup, et al., 1993; and Williamson and Eldridge, 1993) and elsewhere (eg. Smith, et al., 1990; Dymond, et al., 1992; and Anderson, et al., 1993), and encouraging results were obtained. Tasks *
In Proceedings of the 9th Australasian Remote Sensing and Photogrammetry Conference, 20-24 July 1998, Sydney, Volume 1, Paper #71.
remain, however, to model sub-pixel components and their contributions to spectral measurements of satellite images, to improve the relatively low accuracy in quantifying vegetation cover or biomass, and to overcome difficulties in transferring the techniques on an operational scale. As the foundation of rangeland resource assessment and management, accurate field estimation of vegetation cover is critical for improving rangeland vegetation modelling and monitoring. It is highly arguable on the accuracy and correctness of some current field techniques for vegetation cover and biomass estimation (Wilson, et al., 1987) due to the common constraints of available time and fund. In addition to the sample size issues outlined by Curran and Williamson (1986), it has also been argued that some commonly used field estimation methods can produce highly subjective and inconsistent results in the ‘ground truthing’, making the subsequent image processing of remotely sensed data a less meaningful effort (Zhou, 1996). This paper reports a recent research project which focuses on improved field techniques for rangeland vegetation investigation. A semi-arid rangeland field station has been selected for intensive field testing of a number of objective field techniques employed by pasture management and remote sensing. The field sampling results from dimensional analysis of plants, orthographic digital photo classification, line intercept and wheel point were compared. The statistical relationships between results obtained from different methods were analysed for their suitability for ground truthing of rangeland remote sensing.
Methodology The study was undertaken in Fowlers Gap Arid Zone Research Station where bladder saltbush (Atriplex vesicaria) dominated rangeland is typical for western New South Wales, Australia. A comprehensive GIS database has been established for the Station since 1987 and subsequently updated. Image and GIS data processing were conducted using the research infrastructure supported in the School of Geography and Centre for Remote Sensing and GIS at the University of New South Wales. Field Investigation During the period from December 1996 to February 1997, two transects containing six sampling sites in total were set out, emanating from separate watering points. These transects were placed in paddocks with known stocking rates and detailed climatic data. The differential GPS locations of the centre of field sample sites were recorded with a maximum 2-D locational error of 5 metres. Sampling Strategy Each of the six sites was a 100 × 100 metre square. The centre of each site was marked by a permanent peg. The site was then further subdivided into four subquadrats within which a number of cover estimation methods were tested (see Table 1). Table 1. Cover estimation methods applied to each sampling site. Site
Dimensional analysis
Digital photography
Line intercept
Wheelpoint
1
40
40
12
20
2
40
12
20
3
40
12
20
4
48
20
28
5
48
20
28
6
48
20
28
Except for the dimensional analysis of plants, all of the techniques were applied to each site. The statistical analysis indicated that estimates derived from digital photograph classification and dimensional analysis were not significantly different at the 0.01 level. Cover Measurements Vegetation cover estimation was undertaken using quadrat and transect methods, applied to subplot and subquadrat levels, respectively. Quadrat methods
Quadrat techniques are well recognised for the assessment of a variety of parameters including absolute coverage, species dominance, species density and biomass. Associated literature exhibits a wide variation in the number of quadrats placed within a site. Two methods, namely the subjective visual interpretation of running means (Knapp, 1984) and the formula presented by Curran and Williamson (1986). In this study the latter method was used. Based on a pilot study, the calculation showed that a sample size of 11.5 and 9.1 should be adequate for each subquadrat (50 × 50 metres) using the dimensional analysis and digital photograph methods, respectively. For site 1, 40 sample quadrats (2 × 2 metres) were sampled. Each plant in the quadrat was measured by its long axis (a) and the axis perpendicular to the long axis (b). The measurements were used in an ellipse model to calculate the area of the plant as
Ap =
π
4
ab . The percentage area can then be
aggregated for each subplot by adding all plant areas then dividing the sum by the total area of the plot 2 (A = 4 m ):
Av =
∑A A
p
× 100
(1)
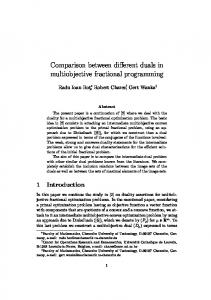
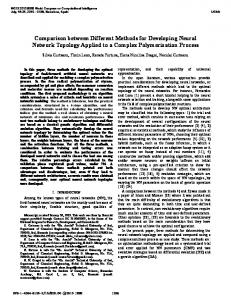
Many existing remote sensing ‘ground truthing’ techniques involve visual estimation of ground cover. This method, however, is highly subjective and largely dependent upon the experience of the field investigator. This is particularly true for Australian rangeland where the major type of vegetation cover is perennial shrubs which often create side-looking ‘false vision’ to the viewer due to their nature as scattered standing plants (Plate 1). Zhou (1996) reported that even on a 2 × 2 metre quadrat, the visual estimates of vegetation cover can generate an error as high as 50%. To avoid this problem, a method which produces vertical orthographic view of the ground has been developed using a digital stillframe video camera, which has previously been reported to be suitable for field estimates of light intercepted by shrubs and low leaf area index (LAI) in open shrublands (Law, 1995). A lowcost digital camera was mounted on a 7m alloy pole. With the camera’s 768 × 512 pixel resolution and equivalent 50-mm focus length, ground images were acquired with a 24 bit, 5 × 5 mm pixel resolution and minimum geometric distortion (Plate 2). This has ensured an accurate and objective vision of the field vegetation cover. The images were then classified by contrast stretching and autoboundary tracing supported by a generic image Plate 1. The side-looking vision of the scattered processing software, to produce classified standing plants. images containing two classes - vegetation and bare ground (Plate 3).
Plate 2. The digital vegetation image acquired.
Plate 3. Classified vegetation cover from Plate 2 (White: vegetation; Black: bare soil).
Transect methods Two transect methods were stratified into the four site subquadrats and located randomly. Line intercept method was used by applying a measuring tape over the subquadrat. For every 10 cm, an observation was made on if the tape intercepted with vegetation or bare ground. Percentage vegetation cover (Av) is then calculated as:
Av =
∑L
v
L
× 100
(2)
where Lv is the length of vegetated area intercepted with the tape, L is the total length of the tape (50 m). Weel point method is a quick way of estimating a cover percentage for a given area. The simple division of the number of "hits" by the total number of points recorded generates a percentage cover. An interpoint distance of 1 metre was selected and 5 to 7 50m-transects were applied to each subquadrat to give 1000-1400 points/ha sampling density. Statistical Analysis All data collected were tested for normality by visual interpretation of the plots of data aggregated by site subquadrat. In the majority of cases, the data was not normally distributed, therefore nonparametric tests were used to test if there were any differences between methods and to identify broad-scale trends. The three tests utilised for the analysis of the results are the Wilcoxon-MannWhitney (W-M-W) test, Kruskal Wallis One-way Analysis of Variance by Ranks (K-W test) and the Kruskal Wallis multiple comparison technique.
Results and Discussion Comparison of quadrat methods The first research question of this study is whether there is any difference between the estimates derived from digital photograph classification and dimensional analysis of plants. The hypothesis that there is no difference between the quadrat (dimensional analysis) and pseudo quadrat (digital photo classification) was tested with the use of W-M-W test. The hypothesis was supported by the statistical analysis thus it can be concluded that the digital photograph classification estimates return a similar result to the dimensional analysis. This finding has an important implication as the use the photograph method instead of dimensional analysis of plants will result in a significant time saving in field sampling. Cover estimate differences The second research question asks whether there is any statistically significant difference between the estimates calculated from wheel point, line intercept and from digital photograph classification methods. The hypothesis that each of the methods employed with produce a different cover estimate was tested with the K-W test. Among 24 total cases, in 16 cases the H0 was rejected, indicating there was a statistically significant difference between the estimates of these three methods tested.
Attribution of significant differences The third research question is whether any single technique is responsible for a significant protion of any difference found. The cases exhibited a significant difference between methods were tested by the Kruskal Wallis multiple comparison technique. This allowed the identification of the technique which was the source of the difference (Table 2). The analysis shows three distinct groups of the results. The first group includes cases where two estimates were statistically equal with a single disparate estimate. The second group contains cases where the differences between the lowest, middle and highest estimates were not statistically significant but the difference between the lowest and highest estimates were. The third group represented cases where each of the three estimates were different. Therefore, the results of the statistical analysis do not support a simple answer to the research question. This implies that the methods produce different results and none of these methods can be regarded as the best estimator of cover in the rangeland environment. The range in cover estimates for each site subquadrat is also of concern, which ranges from 5 to 45%. The fact that at least one of the methods is different to the others in two third of the cases (16 of 24) shows that cover estimate values in the rangeland environment are often significantly influenced by the techniques employed. This makes it doubtful whether the field techniques can produce data that representing the 'true value' of vegetation cover. Table 2. Significant differences attributable to particular method. Site 1
2
3
4
5
6
Subquadrat 1 2 3 4 1 2 3 4 1 2 3 4 1 2 3 4 1 2 3 4 1 2 3 4
LI / Photo N/A Different Different Different Different Different N/A Different Different Different N/A N/A Different N/A N/A N/A N/A Different Different No difference No difference No difference Different No difference
LI / WP N/A Different Different No difference No difference No difference N/A Different Different Different N/A N/A Different N/A N/A N/A N/A No difference No difference No difference Different Different Different Different
WP / Photo N/A No difference No difference No difference No difference Different N/A No difference Different No difference N/A N/A No difference N/A N/A N/A N/A Different Different No difference Different Different Different Different
Conclusions The calibration link between remote sensors and ground truth is vital to the accurate interpretation of satellite imagery. This link is usually in the form of a cover estimation technique. The discrepancies between the three cover estimation methods tested indicate that this link is often a major source of error. The identification of an estimation technique that is both precise and accurate for the heterogeneous arid zone environment is a vital step in the production of accurate land assessments from satellite imagery. The lack of agreement in cover estimates given by the different techniques and the subsequent lack of the knowledge about the 'true value' of vegetation cover can lead to a misleading quantitative cover estimation using remotely sensed data. In practical terms, differences in cover estimates of up to 45% were exhibited during an intensive study of a series of sites. This difference in estimate would have produced two significantly differing land resource assessments had they been used for calibration purposes. Ground truthing of a representative area is considered good practice but the failure to identify the best method of cover
estimation will yield misleading results and cause significant problems in subsequent calculations of carrying capacity of rangeland.
Acknowledgement The project was funded by Australian Research Council. The authors would like to thank field investigation team members Allan Evans, Richard Jossop, Ben McDonald and Vanessa Newey for their assistance and contributions to the field data collection. Special thanks also go to Mr. Peter Horn for his contribution in developing field photograph equipment.
References Anderson, G.L., Hanson, J.D. and Haas, R.H., 1993. “Evaluating Landsat Thematic Mapper derived vegetation indices for estimating above-ground biomass on semiarid rangelands”, Remote Sensing of Environment, 45(2): 165-175. Curran, P.J. and Williamson, H.D., 1986. “Sample size for ground and remotely sensed data”, Remote Sensing of Environment, 20(1): 31-41. Dymond, J.R., Stephens, P.R., Newsome, P.F. and Wilde, R.H., 1992. “Percentatge vegetation cover of a degrading rangeland from SPOT”, International Journal of Remote Sensing, 13(11): 1999-2007. Frazier, P.S., Applegate, R.J., Wood, B.G. and Hill, G.J.E., 1994. “The role of satellite remote sensing in rangeland monitoring: a report from the national rangeland monitoring program workshop”, In Proceedings of 7th Australasian Remote Sensing Conference, 1-4 March, Melbourne, 1148-1155. Graetz, R.D. and Gentle, M.R., 1982. “The relationships between reflectance in the Landsat wavebands and the composition of an Australian semi-arid shrub rangeland”, Photogrammetric Engineering and Remote Sensing, 48(11): 1721-1730. Graetz, R.D., Pech, R.P. and Davis, A.W., 1988. “The assessment and monitoring of sparsely vegetated rangelands using calibrated Landsat data”, International Journal of Remote Sensing, 9(7): 1201-1222. Knapp, R. (ed.), 1984. Sampling Methods and Taxon Analysis in Vegetation Science. Law, B.E., 1995. Estimation of leaf area index and light intercepted by shrubs from digital videography, Remote Sensing of Environment, 51(2): 276-280. Pech, R.P., Graetz, R.D. and Davis, A.W., 1986. “Reflectance modelling and derivation of vegetation indices for an Australian semi-arid shrubland”, International Journal of Remote Sensing, 7(3): 389-403. Pickup, G., Chewings, V.H. and Nelson, D.J., 1993. “Estimating changes in vegetation cover over time in arid rangelands using Landsat MSS data”, Remote Sensing of Environment, 43(3): 243-263. Smith, M.O., Ustin, S.L., Adams, J.B. and Gillespie, A.R., 1990. “Vegetation in deserts: I. A regional measure of abundance from multispectral images”, Remote Sensing of Environment, 31(1): 1-26. Williamson, H.D. and Eldridge, D.J., 1993. “Pasture status in a semi-arid grassland”, International Journal of Remote Sensing, 14(13): 2535-2546. Wilson, A.D., Abraham, N.A., Barratt, R., Choate, J., Green, D.R., Harland, R.J., Oxley, R.E. and Stanley, R.J., 1987. “Evaluation of methods of assessing vegetation change in the semi-arid rangelands of southern Australia”, Australian Rangeland Journal, 9(1): 5-13. Zhou, Q., 1996. "Ground truthing, how reliable is it?" in Proceedings of Geoinformatics'96 Conference, 26-28 April, West Palm Beach, Florida, 69-77.