Home
Search
Collections
Journals
About
Contact us
My IOPscience
Comparison between wavelet transform and moving average as filter method of MODIS imagery to recognize paddy cropping pattern in West Java
This content has been downloaded from IOPscience. Please scroll down to see the full text. 2017 IOP Conf. Ser.: Earth Environ. Sci. 54 012011 (http://iopscience.iop.org/1755-1315/54/1/012011) View the table of contents for this issue, or go to the journal homepage for more Download details: IP Address: 202.124.205.203 This content was downloaded on 14/02/2017 at 06:49 Please note that terms and conditions apply.
You may also be interested in: Spatial change analysis of paddy cropping pattern using MODIS time series imagery in Central Java Muhammad Arif Fatoni, Kreshna Dwi Nugroho, Alvin Fatikhunnada et al. Research on the Features of Chlorophyll-a Derived from RapidEye and EOS/MODIS Data in Chaohu Lake X Wen, Z Zhou, B Chen et al. Ice dynamic response to two modes of surface lake drainage on the Greenland ice sheet Marco Tedesco, Ian C Willis, Matthew J Hoffman et al. Identification of paddy field using Landsat image in Karawang Regency, West Java Bambang Riadi and Ahmad Budiman Suriadi Seasonal analysis of precipitation, drought and Vegetation index in Indonesian paddy field based on remote sensing data S Darmawan, W Takeuchi, R Shofiyati et al. Synthetic Aperture Radar (SAR)-based paddy rice monitoring system: Development and application in key rice producing areas in Tropical Asia T D Setiyono, F Holecz, N I Khan et al. Combining ocean numerical model and SAR imagery to investigate the occurrence of oil pollution, a case study for the Java Sea A Setiawan, M R Putri, M Gade et al. Tropical forest degradation monitoring using ETM+ and MODIS remote sensing data in the Peninsular Malaysia M Hashim, A B Pour and K W Chong
LISAT IOP Conf. Series: Earth and Environmental Science 54 (2017) 012011
IOP Publishing doi:10.1088/1755-1315/54/1/012011
International Conference on Recent Trends in Physics 2016 (ICRTP2016) IOP Publishing Journal of Physics: Conference Series 755 (2016) 011001 doi:10.1088/1742-6596/755/1/011001
Comparison between wavelet transform and moving average as filter method of MODIS imagery to recognize paddy cropping pattern in West Java Kreshna Dwi Nugroho1*, Singgih Pebrianto1, Muhammad Arif Fatoni1, Alvin Fatikhunnada1, Liyantono1, Yudi Setiawan2 1 Department of Mechanical and Biosystem Engineering, Faculty of Agriculture Technology and Engineering, Bogor Agricultural University, Lingkar Akademik Street, Campus of IPB Dramaga, Bogor 16680, West Java, Indonesia 2 Center for Environmental Research (PPLH), Bogor Agricultural University, PPLH Building, 2th-4th floor, Lingkar Akademik Street, Campus of IPB Dramaga, Bogor 16680, West Java, Indonesia E-mail:
[email protected] Abstract: Information on the area and spatial distribution of paddy field are needed to support sustainable agricultural and food security program. Mapping or distribution of cropping pattern paddy field is important to obtain sustainability paddy field area. It can be done by direct observation and remote sensing method. This paper discusses remote sensing for paddy field monitoring based on MODIS time series data. In time series MODIS data, difficult to direct classified of data, because of temporal noise. Therefore wavelet transform and moving average are needed as filter methods. The Objective of this study is to recognize paddy cropping pattern with wavelet transform and moving average in West Java using MODIS imagery (MOD13Q1) from 2001 to 2015 then compared between both of methods. The result showed the spatial distribution almost have the same cropping pattern. The accuracy of wavelet transform (75.5%) is higher than moving average (70.5%). Both methods showed that the majority of the cropping pattern in West Java have pattern paddy-fallow-paddy-fallow with various time planting. The difference of the planting schedule was occurs caused by the availability of irrigation water.
1. Introduction Indonesia is a country in fourth-highest rice consumption in the world after Myanmar, Vietnam, and Bangladesh, at 1.62 kg per person per weeks in 2014 until now [1]. Therefore needs government effort to keep rice supply to Indonesian people. West Java with a number of people in 2013 as many as 45.340.799 people [2] and increase every year, needs rice supply to fulfill food requirement. Information about agriculture land utilization (especially paddy field) is important things to support of sustainable agriculture and Indonesian food security. Understanding the potential of paddy field production in Indonesia is one way to increase effectiveness and efficiency of agriculture land development program. Indonesia has big paddy field area. Characteristic change of paddy field vegetation at the time can give information about Indonesian paddy crop intensity. The way that used to knows about vegetation dynamic of paddy in a very wide area is using remote sensing. Utilization of remote sensing data with the geographic information system (GIS) to various environmental applications already many used,
Content from this work may be used under the terms of the Creative Commons Attribution 3.0 licence. Any further distribution of this work must maintain attribution to the author(s) and the title of the work, journal citation and DOI. Published under licence by IOP Publishing Ltd 1
LISAT IOP Conf. Series: Earth and Environmental Science 54 (2017) 012011
IOP Publishing doi:10.1088/1755-1315/54/1/012011
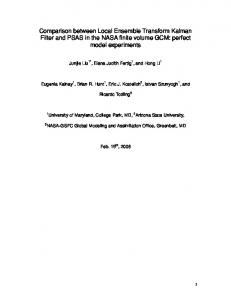
especially to detect land use change [3]. This study discusses remote sensing for paddy field monitoring based on MODIS time series data. In time series MODIS data, difficult to directly classify data due to temporal noise. Therefore wavelet transform and moving average are needed as filter methods. The objective of this study is to recognize paddy cropping pattern with wavelet transform and moving average in West Java using MODIS imagery (MOD13Q1) from 2001 to 2015 then compared between both of methods. 2. Method 2.1. Study Site West Java Province is one of six Province in Java Island, Indonesia. Geographically, West Java Province located between 5o50’-7o50’ South Latitude and 104o48’-108o48’ East Longitude (figure 1). In 2014, West Java has paddy field area 924,307 ha which divided by 742,658 ha irrigated lands and 181,649 ha unirrigated lands. This paddy field area produced 7,306,009 tons [2].
Figure 1. The study site 2.2. Method of analysis 2.2.1. Collecting data and pre-processing MODIS Image. Data that used was map paddy field land use, map of administration and MODIS data in West Java. Land use and administration map of West Java obtained from Geospatial Information Agency (BIG). MODIS data obtained, at no cost, from the NASA Land Processes Distributed Active Archive Center (LPDAAC) [4]. MODIS imagery has 36 bands with spatial resolution 250 m (band 1-2), 500 m (band 3-7), and 1000m (band 8-36) for each sensor. The MODIS data used in this study is the vegetation indices (VI) composite 16-day Global 250 m SIN Grid V005 or MOD13Q1 product [5], which is generated from MODIS data by using the maximum value composite (MVC) method and combined with the MODIS BRDF (Bidirectional Reflectance Distribution Function) in order to get a greater percentage of clear-sky data. The acquired datasets represented the period from January 2001 to December 2015. In this study, we used the MODIS EVI datasets, which were filtered by wavelet transforms and moving average, in order to
2
LISAT IOP Conf. Series: Earth and Environmental Science 54 (2017) 012011
IOP Publishing doi:10.1088/1755-1315/54/1/012011
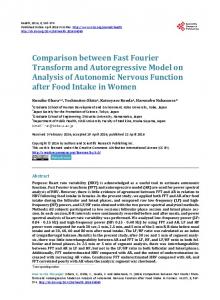
reduce inevitable disturbances in the time-series datasets. Figure 2 illustrates the flow of data handling and image analysis in this study.
Figure 2. Study flowchart The MODIS developed the Enhanced Vegetation Index (EVI) based on this equation below [6].
(1) Where, , and are the remote sensing reflectance in the NIR, red, blue, respectively. L is a soil adjustment factor, and C1 and C2 describe the use of the blue band in a correction of the red band for atmospheric aerosol scattering. The coefficients C1, C2, and L are empirically determined as 6.0, 7.5, and 1.0. respectively. G is a gain factor set to 2.5.
3
LISAT IOP Conf. Series: Earth and Environmental Science 54 (2017) 012011
IOP Publishing doi:10.1088/1755-1315/54/1/012011
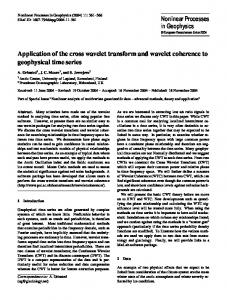
2.2.2. Noise reduction. In time series MODIS data, it is difficult to direct classified of data, because of temporal noise. Temporal noise can be caused by something like clouds covers and atmosphere effect. Cloud covers become a problem where a research using MODIS data conducted in a tropical area like Indonesia. Because heavy cloud covers may affect the quality of the image and information of earth's surface can be lost. Besides cloud covers, the atmosphere also becomes a problem. Because the atmosphere can absorb reflectance energy from the earth surface, which causes reduced total energy. In this study to reduce such temporal noise, the wavelet transform and moving average transform were used. Wavelet transform and moving average are needed to reduction noise or as filter methods. 2.2.3. Clustering and recognize the cropping pattern of paddy field. The clustering method subdivides data sets into k clusters through an iterative process in order to optimize a criterion function [7]. Data clustering aim to easier of analysis. The cluster based on similarity of spectral profile each MODIS pixel. Data that already classified using k-mean clustering afterward determined the cropping pattern. Then classified data again based on similarity of the pattern each class based on Sakamoto et al. [8]. They were using wavelet and fourier transform, paddy growth period divided 3 phase, that is planting date, heading date, and harvesting date. In general, paddy fields are flooded before rice planting, then decreases during the period and increases again after rice planting. Furthermore, vegetation index will increase in growing period, and reach a peak in heading date (maximum vegetation index). After the heading date, vegetation index in paddy field begins to decrease as leaves wither and die. It then decreases abruptly because of harvesting. Figure 3 illustrates recognizing of the cropping pattern based on EVI [8].
Figure 3. Recognizing of cropping pattern based on EVI [8]
2.2.4. Validation of data. Stage of data validation (ground check) held in some area in West Java to certain compatibility MODIS data and field condition. A number of observation points in this study are 139 points. Using 70 % threshold based on a study [9], He was analyzing of paddy field change dynamics in Java and generated 71.1% accuracy.
3. Result and Discussion 3.1. Pre-processing MODIS image The first stage of this study was pre-processing data, which are divided into some stage such as EVI value extraction and stacking of MODIS imagery, cut image of administration and paddy field map of West Java, and noise reduction. At this stage, noise reduction using wavelet transform and moving average methods. Wavelet transforms using level 1, the approximate 1, and coiflet level 1. Coiflet is
4
LISAT IOP Conf. Series: Earth and Environmental Science 54 (2017) 012011
IOP Publishing doi:10.1088/1755-1315/54/1/012011
kind of wavelet transform. The higher level of the selected value cause the greater value reduced. Meanwhile, moving average methods was using window level 3. In selected level of the window, not too big and small, because if too big (window > 5), data will be too smooth and fluctuated of pattern not to recognize. But, if using window level is too small (window ≤ 2), the results still have an irregular pattern (noise). 3.2. Analysis of West Java MODIS image from 2000-2015 To analyze a number of big data, used k-mean clustering method. This method divided by 3 stage, first operator input the maximum class. Second based on input, randomly the computer will position average value as a centroid. Third based on a distribution of centroid, all pixel calculated and classified based minimum distance. A number of maximum class that chosen in this study was 25 class. When each centroid does not yet represent a number of class around then the computer will determine new centroid. The process going on until formed a class based on minimum distance from the centroid. K-mean clustering also caused cropping pattern each class more smoothed. More and more class input then cropping pattern that formed more and can represent dynamic that happen in the field. But using more class caused long processing time, therefore must adjust with computer ability. Data that classified then analyzed by cropping pattern with directly seen from cropping pattern graph result clustering. Starting at 25 class, data classified again based on similarity of pattern and generated 10 main class. 3.3. Cropping pattern in West Java paddy field The process of the pattern recognizing paddy field using EVI value, as described in methodology (point 2.2.3). Distribution of cropping pattern with wavelet transform and moving average are given in figure 4.
Figure 4. The sixth type of cropping pattern in West Java from recognizing the temporal vegetation pattern of EVI. (a) paddy triple cropping; (b) paddy double cropping; (c) paddy single cropping; (d) mix and other crops dominantly; (e) mix and building dominantly; (f) fishpond. Spatial mapping of paddy cropping pattern with wavelet transform and moving average shown in figure 5.
5
LISAT IOP Conf. Series: Earth and Environmental Science 54 (2017) 012011
IOP Publishing doi:10.1088/1755-1315/54/1/012011
Figure 5. Comparison of paddy cropping pattern on West Java in 2015 with wavelet transform (a) and moving average (b).
6
LISAT IOP Conf. Series: Earth and Environmental Science 54 (2017) 012011
IOP Publishing doi:10.1088/1755-1315/54/1/012011
3.4. Accuracy of cropping pattern The cropping pattern was calculated based on ground check result using confusion matrix method. A number of reference sample as many as 139 points and generated overall accuracy to be 75.5% in wavelet transform and 70.5% in moving average method. The result of ground check refers to Table 1. Table 1. Confusion matrix for paddy cropping pattern on West Java with wavelet transform (a) and moving average (b) Reference Data Paddy Field Type Cropping Pattern
PBB
PLB
PPB
BPP
PPL
P3
CH
CP
CT
User’s Accuracy (%)
T
(a)
(b)
(a)
(b)
(a)
(b)
(a)
(b)
(a)
(b)
(a)
(b)
(a)
(b)
(a)
(b)
(a)
(b)
(a)
(b)
(a)
(b)
PBB
0
4
0
0
0
0
0
0
0
0
0
0
0
0
0
0
0
1
0
0
-
80.0
PLB
0
0
1
4
2
4
0
0
0
0
0
0
0
1
0
0
0
1
0
0
33.3
40.0
PPB
0
3
1
1
61
49
0
0
0
0
2
1
0
0
0
0
1
1
0
0
93.8
89.1
BPP
0
0
0
0
0
3
0
10
0
0
0
1
0
0
0
0
0
1
0
0
-
66.7
PPL
0
0
0
0
1
0
0
0
1
0
0
0
0
0
0
0
0
0
0
0
50.0
-
P3
0
0
0
0
0
0
0
0
0
0
12
14
0
0
0
0
0
1
0
0
100.0
93.3
CH
0
0
0
0
0
3
0
0
0
0
0
0
0
1
0
0
0
2
0
0
-
16.7
CP
0
0
0
0
5
7
0
0
0
0
2
2
0
0
3
3
2
2
0
0
25.0
21.4
CT
0
0
2
2
12
5
0
0
0
0
4
1
0
0
0
0
24
11
0
0
80.0
64.7
T
0
0
0
0
0
0
0
0
0
0
0
0
0
0
0
0
0
0
3
2
100.0
100.0
Procedure’s Accuracy (%)
-
57.1
25.0
80.0
88.4
69.0
-
100.0
100.0
-
60.0
73.7
-
50.0
100.0
100.0
88.9
55.0
100.0
100.0
Overall Accuracy : (a) = 75.5 % ; (b) = 70.5 %
Note: PBB PLB PPB BPP PPL P3 CH CP CT T
= Paddy single cropping (paddy-fallow) = Paddy single cropping (paddy-secondary crop-fallow) = Paddy double cropping (paddy-fallow-paddy-fallow /.paddy-paddy-fallow) = Paddy double cropping (fallow-paddy-fallow-paddy) = Paddy double cropping (paddy-paddy-secondary crop) = Paddy triple cropping (paddy-paddy-paddy) = Mix (dominant forest) = Mix (dominant building) = Mix (dominant other crops) = Fishpond
Based on the result of the calculation, overall accuracy obtained with wavelet transform higher than moving average method with accuracy succession 75.5% and 70.5%. It means wavelet transform better to reduce noise than moving average. The higher user’s accuracy both of method are PPB, P3 and T. It caused the pattern of PPB and P3 easier to difference, that showed 2 peaks and 2 valleys for PPB and 3 peaks and 3 valleys for P3. In fishpond pattern, the high accuracy caused EVI average of fishpond very low, and different from paddy pattern generally that has high EVI average. Low of user’s accuracy in both of method showed at PLB and CP. In PLB, occur mistakes to recognize cropping pattern PPB (paddy-paddy-fallow) that identified as PLB (paddy-secondary crop-fallow), therefore accuracy is low. It caused many of second season paddy that crop with a different period, therefore pattern that identified is PLB. Low accuracy in CP pattern caused the inability of MODIS image to recognize the cropping pattern with pixel lower than MODIS resolution (250 m).
4. Conclusion Based on the study, image satellite is used to recognize the cropping pattern in West Java and generated overall accuracy 75.5% and 70.5% in wavelet and moving average transform. Methods for recognizing the cropping pattern in West Java successfully, and generated ten cropping patterns with three main cropping patterns: paddy single cropping (paddy-secondary crop-fallow) with accuracy 33.3% and 40.0%, paddy double cropping (paddy-paddy-fallow) with accuracy 93.8% and 89.1%, and paddy triple cropping with accuracy 100.0% and 93.3%.
7
LISAT IOP Conf. Series: Earth and Environmental Science 54 (2017) 012011
IOP Publishing doi:10.1088/1755-1315/54/1/012011
Acknowledgements The authors would like to thank the NASA LP PAAC for making MODIS data available, also the Center for Environmental Research (PPLH IPB) for providing the facilities in this research.
5. Reference [1] [2] [3]
[4]
[5] [6]
[7] [8]
[9]
Badan Pusat Statistik 2014 Average consumption per person a week of important food, 20072014 Pusat Data dan Sistem Informasi Pertanian (Jakarta: Badan Pusat Statistik) Badan Pusat Statistik 2015 Statistics of agriculture land 2015 Pusat Data dan Sistem Informasi Pertanian (Jakarta: Badan Pusat Statistik) Liu Y, Wang X, Guo M, Tani H, Matsuoka N and Matsumura S 2011 Spatial and temporal relationships among NDVI, climate factors, and land cover changes in Northest Asia from 1982 to 2009 GIS science and Remote Sensing 48 371-393 US Geologic Survey Land Processes Distributed Active Archive Center 2010 MODIS Data Product Table Available online: http://lpdaac.usgs.gov/products/modis_products_ table (accessed on 3 December 2010) US Geologic Survey Land Processes Distributed Active Archive Center Data Pool Available online: https://lpdaac.usgs.gov/lpdaac/get_data/ data_pool (accessed on 10 August 2009) Huete AR, Didan K, Miura T, Rodrlquez EP, Gao X and Ferreira LG 2002 Overview of the radiometric and biophysical performance of the MODIS vegetation index Remote Sensing of Environmental 2003 83 195-213 Jain AK, Murty MN and Flynn PJ 1999 Data Clustering: A Review, ACM Computing Surveys 31 264–323 Sakamoto T, Yokozawa M, Toritani H, Shibayama M, Ishitsuka N and Ohno H 2005 A crop phenology detection method using time-series MODIS data Journal Remote Sensing of Environment 96 366–374 Setiawan Y, Rustiadi E, Yushino K, Liyantono and Effendi H 2014 Assessing the seasonal dynamics of the Java’s paddy field using MODIS satellite images ISPRS International Journal of Geo-Information 3 110-129
8