Comparison of 3D Scanning and 3D Modelling of a Workplace from Various Aspects M. Bures1, J. Polcar1
1
Department of Industrial Engineering and Management, University of West Bohemia, Pilsen, Czech Republic (
[email protected],
[email protected])
Abstract - The paper investigates differences in data gathering and preparation of the workplace environment for virtual ergonomic analyses. The two investigated scenarios are classical digitization of the workplace by measurement of dimensions and subsequent modelling of the workplace in 3D drawing software compared to3D scanning of the workplace by an industrial scanner. Those two scenarios are assessed in terms of time and accuracy. The 3D scanning method was, on average, four times faster than 3D modelling and also more precise. However, the quality of the 3D model was better than the model obtained from the scanner. The need for accuracy in ergonomic analyses is also discussed in the paper.
allows easier and earlier identification of ergonomics problems, and lessens or sometimes even eliminates the need for physical mock-ups and real human subject testing [3]. DHM-tools have been introduced in industry to facilitate a faster and more cost efficient design process as well as to evaluate existing workplaces. Virtual technology allows ergonomists and engineers to perform virtual builds, and the rapid adoption of virtual tools creates an opportunity to integrate considerations of ergonomics into early design stages [4]. The ability to verify the suitability of the workplaces or the products during their development is probably the most significant benefit of virtual ergonomics. The fact that the majority of errors can be debugged before the actual physical model is constructed is reflected dramatically in financial savings [5]. Research within ergonomics simulation and DHM utilization has primarily been related to improving the simulation tools with more enhanced functionalities resulting in better and more accurate posture and motion algorithms and biomechanical models [5][6][7][8][9]. Several studies such as [10][11][12] have been carried out to compare the functionalities of different DHM tools. All these studies show that the outcomes of the different tools are fairly accurate, however almost none of the contemporary research investigates the time demands of virtual ergonomics. In previous papers [13] we have focused on the time demands of each phase during workplace optimization with DHM-tools. This paper is focused on time demand in the first phase where data gathering and preparation of the workplace environment for virtual ergonomic analyses is performed. The two investigated scenarios are classical digitization of the workplace by measurement of dimensions and subsequent modelling of the workplace in 3D drawing software compared to3D scanning of the workplace by an industrial scanner.
Keywords–3D scanning, 3D modelling, workplace, virtual environment, digital human models
I. INTRODUCTION Ergonomics (or human factors) is the scientific discipline concerned with the understanding of interactions among humans and other elements of a system, and the profession that applies theory, principles, data and methods to design in order to optimize human well-being and overall system performance. [1] Physical ergonomics is a particular area where the application of human anthropometrical, physiological and biomechanical characteristics is used for the design of a workplace. The absence of ergonomic considerations in the design of the workplace can result in work-related musculoskeletal disorders or even work related illnesses. An ergonomic approach to the design of an industrial workstation attempts to achieve an appropriate balance between the worker capabilities and work requirements to optimize worker productivity and the total system, as well as provide worker physical and mental well-being, job satisfaction and safety [2]. Ergonomics, as well as other sciences, is influenced by massive utilization of information and communication technologies. In ergonomics, one of the most common computer applications is creating digital human models (DHM) that are used to test different scenarios in a virtual environment. Digital human representations in various forms are increasingly being incorporated in the computer-aided design of human-machine systems, such as a driver-vehicle system or a manufacturing workstation. With the computing power and computational methods available today, we are able to render digital human models that are more sophisticated and realistic than those produced a decade ago. The implementation of digital human modelling technology
978-1-5090-3665-3/16/$31.00 ©2016 IEEE
II. METHODOLOGY As mentioned earlier, the two most common utilizations of DHM in workplace design are either the design of a brand new workplace or the optimization of an already existing one. The research presented in this paper is focused on the case of existing workplace optimization where we need to digitize the workplace or create a virtual environment of a current workplace. ‘Virtual environment’ refers to the 3D data set describing an
306
Proceedings of the 2016 IEEE IEEM
environment based on real-world or abstract objects and data that can provide an accurate and realistic representation of the real work space [14]. Usually the evaluation process can be divided into four phases as presented in [15][16]. 1. Collection of workplace information - The first step is always to collect all the necessary workplace information (such as workplace dimensions, worker and process data) in order to create the most accurate virtual environment of the real workplace, on which analyses and experiments will be performed. It is necessary to establish a complete work environment, including the facilities, machines, equipment, and tools. In this phase we have two options for obtaining the required dimensions of the workplace. The classical and most commonly used way is to measure the workplace dimensions directly (e.g. by measuring tape and camera) or with modern tools like 3D scanners. 2. Construction of virtual environment–The next step involves construction of the digital workplace or the environment that is being evaluated and also importing and setting up the DHM. Based on the method of obtaining workplace dimensions in the preceding phase, we have to either draw the 3D models in graphical software or create a 3D model from the point cloud obtained with the scanner [17]. Individual models are subsequently assembled to create a whole virtual environment. Finally, the DHM is inserted and its properties such as population group, sex, height and weight are set to ensure that the analyses will be performed for specific workers. 3. Ergonomic evaluation– The third step involves task simulation and evaluation of these tasks with ergonomic analyses and interpretation of the results. This part is always different. It depends on the issues we need to solve. In our research, the engineers were assigned with a task to perform 3 ergonomic analyses suitable for the identified problems. 4. Improvement and re-evaluation - The final step involves suggestions for improvement and their reevaluation. Re-evaluation is very important to be sure that the proposed changes have the required effects. This phase also includes the creation of a small report about the workplace optimization, up to 10 pages long with suggested proposals for improvement. This evaluation process is also visualized in Fig. 1. In the current experiment we focused on the first phase in detail. We analysed two industrial workplaces. Each workplace was analysed by a different engineer who was highly skilled in the use of 3D modelling software and had average skill with the DHM software. They were assigned to perform the first phase in standard way – measure the dimensions and create the 3D model in the graphical software (Catia V5, Inventor). Tecnomatix Jack was selected for creation of the virtual environment and subsequent ergonomic analyses.
Fig. 1. Process visualization of ergonomic evaluation in a virtual environment.
Usually the engineer performed three analyses which focused either on: evaluation of working posture – RULA analysis (Rapid Upper Limb Assessment) [18] or Lower Back Analysis [19] or material handling and manipulation - Manual Handling Limits (lifting and lowering, carrying, pushing or pulling) [20] or NIOSH analysis [21]. During the whole process of ergonomic evaluation, the engineers were assigned to fill the timesheet for their progress and to divide it into the four phases mentioned earlier. At the same time, the authors of the paper performed the 3D scanning of selected workplaces, extracted the model from a point cloud using Cloud Compare software and created the virtual environment. The 3D scanner used for the workplace digitization was a Leica Scan Station C5. Some of its parameters are: pulse laser scanner accuracy of scanning – 2 mm range – up to 35 m scan rate – up to 25000 points/sec. field of view – 360° (horizontal) / 270° (vertical) Before the actual experiment, two hypotheses regarding the probable outputs were stated. Hypothesis I - 3D scanning will be faster for obtaining digitized data using the selected methods for workplace digitization. The first hypothesis is to test the time demands of each method of workplace digitization. It is believed that the scanning will be faster because no time for measuring is needed. Also the creation of a 3D model from the point
307
Proceedings of the 2016 IEEE IEEM
most automattic. However, the processs of cloud is alm scanning takees some time. Hypothessis II - In terrms of the ouutputs of seleected methods for workplace digitization, d t the 3D scannning b more accuurate and thee results from m 3D method will be scanning willl be without errrors caused by b measuring with measuring tappe. The secoond hypothesiis works withh the accuraccy of both methodss. Usually a3D D model of a workplace drrawn in graphics sooftware is ‘niicer’ from an aesthetic poinnt of view, howeveer there is a greater g chancee for mistakess that may occur when w measuriing the dimennsions as weell as when drawingg the 3D modeel.
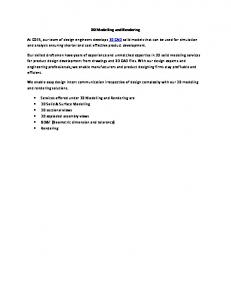
Fig. 2. Visualization of o the virtual envvironment created d by 3D modellingg (left side) and 3D D scanning after aapplying a point cloud c surface reconstruction algorrithm (right side)
III. RESULTS R TAB BLE I TIME DEMANDS OF ERG GONOMIC EVALU UATION
A Time duraation aspect A.
Workplace no.
Two induustrial assembbly workplacees were subjeected to ergonomic analysis. Both workpllaces were quite q similar regardding workplaace complexitty and utilizaation. They are com mposed of several s compoonents such as a working tablee, rack, packaaging (boxes) and a chair. Each E workplace waas digitized byy measuring and a subsequennt3D modelling as well as by 3D D scanning. The T result of a 3D m from 3D D scanning off workplace 1 can model and model be seen in Figg. 2. Both worrkplaces weree similar. Worrkplace 1 (Figg. 2.) consists of 1 table, 2 racks r and 8 types of booxes. Workplace 2 consists of 1 table, 1 racck, 1 chair annd 5 types of boxes. Only one worker was analysed at each s only one DHM model was used. The workplace, so numbers of hours that enngineers spennt analysing each T duration was workplace arre noted in Table 1. The recorded to thhe nearest 0.255 hour. In botth cases, all phhases were completted within 12 hours. For comparison withh 3D scanning the first and secoond phase aree important. These T phases last 5 hours for workplace w 1 and a 5.5 hourss for workplace 2. In the first phase p the engiineer obtainedd the basic informaation about the process (w work instructtions, time durationn of the operaations, data about a the worrkers, video of the operation) and a about thee workplace itself i p and measurement m of dimensioons). (workplace photos During the second phaase the engineers drew the b individual parrts of the workkplace (table, rack, chair, boxes etc.). The lastt activity in thhis phase was the t compilatioon of the whole workplace and im mporting to Tecnomatix Jacck. med. Scans off both workkplaces were then perform Scanning connsisted of the first f and seconnd phases. Duuring the first phase only data abbout the process were obtaained because thesee data (dimenssions and phottos) were obtaained by the scanneer. Additionaally, the data about the proocess were gathereed during the automatic scanning byy the scanner. Thuss the scanningg in the first phase p was donne in 45 minutes (w workplace 1) and 30 minuttes (workplacce 2), see Table 1. The scannning of eachh workplace was performed froom 3 positionss.
Phaases 1. Collection C of worrkplace info ormation [h] 2. Construction C of virtu ual environment [h] 3. Ergonomic E evalluation [h] 4. Im mprovement and re-eevaluation [h] Σ
1-model
2-model
1-sccan
2-scan
2
2
0.7 75
0.5
3
3.5
0.7 75
0.75
3
3.5
3
3.5
4
3
4
3
12h
12h
8.5 5h
7.75h
most automatiically, becausee Thee second phasee was done alm the model of thhe workplacee was extraccted from thee nned point clooud using thee Screened Po oisson Surfacee scan Recconstruction algorithm a [22]] in Cloud Compare. C Onlyy the last activity of o importing thhe model to th he Tecnomatixx k was the sam me as in the preevious case. The T duration of o Jack this phase was 455 minutes for bboth workplacces. A of thhe models B. Accuracy wo methods of o 3D modeel While evaluuating the tw prep paration, we were able to see som me differences betw ween the two models. Whille measuring the workplacee usin ng common toools, only the ddimensions an nd positions of o the necessary feaatures were caaptured. When n using the 3D D nner, the whoole workplacee was captureed, as seen inn scan Fig.. 3. There is ann immediatelyy visible difference betweenn the lamp positionn, missing braccing and the contents c of thee t are noot conttainers at thhe workplacee, although these imp portant for ergoonomics analyysis. More imporrtant differences became visible whenn tryin ng to registter the modeel with the point cloudd. Alth hough both were w made bby skilled and d experiencedd engiineers, we coould not mannage to make an accuratee
308
Proceedings of the 2016 IEEE IEEM
s Fig. 4. The T figure shhows a screennshot registration, see from Cloud Compare poiint cloud proocessing softw ware, m laid ovver the point cloud. c The collours with the 3D model of the points represent the nearest distannce from the point p to any point inn the model’s surfaces. Theree are some differences d thaat could influuence the accuracy of the ergonoomics analysiss. For examplle, at edge A in Figg. 4, only onee corner of thee table’s surfaace is correctly meaasured – the taable is bent acctually, whichh can be unexpeccted during conventionaal measurem ment. Therefore, thhis mistake caan be made very v easily. At A Bit can be seen thhat the boxes are at differeent places, aboout 5 centimetres to the left in the case of the t scanned point p w because sccanning and measurements m w were cloud. This was done at differrent times. Thhe inclination and height of o the boxes is impoortant and thiis can change the results of the ergonomics analysis a very significantly. The height of the edge of the boxes b in the upper u rack is correct, but their inclination is not correct at C. m either duuring In this caase, the errorrs could be made the scanningg or the meaasuring. 3D scanners cann be sensitive to floor vibratioon, but the amplitude off the vibrations waas minimal in both cases (nno heavy machhines or transportattion devices were w present in the producction halls). There was a soft mat m on the flooor in front of the w could cause c some divergence d off the workplace, which vertical axis of the 3D scanner, but thee water level was checked beforre and after thhe scanning.
Fig. 3. Scanned pooint cloud of workkplace 1 and 3D model m based on c common measurinng techniques.
IV. DISCUSSION
C
The physsical dimensioons in the desiggn of an indusstrial workstation are a of major importance i frrom the viewppoint of productionn efficiency, and the phyysical and mental well-being off the operatoor. For designning an indusstrial workstation, it i is necessaryy to obtain rellevant informaation or data abouut task perfoormance, equuipment, worrking posture and environment.. The use off a 3D scannning r n of a workplaace in device for obttaining a 3D representation order to makee an ergonom mic analysis prroved to be a very useful methood. The speeed of data acquisition and processing was w much higgher (up to four f times faaster) when using the 3D scannner than whiile measuringg the workplace usiing traditionall tools and maaking the moddel in CAD softwarre, thus Hypotthesis I was coonfirmed. Bennefits regarding tim me saving would w be eveen greater iff the engineers werre only averagge or low skillled as in prevvious research [13],, where the firrst two phases took from 8.5 8 to 16.5 hours. While coomparing the traditionally made model with the scan of thhe workplace,, the differencces ranged froom 3 to 5 cm. The question is, whether w errorrs occurred duuring ft floor, or wheether scanning becaause of vibratiion or the soft it occurred during meaasuring (or both), thus the I was only partially p conffirmed. However, Hypothesis II such small differences aree not relevantt to the results of a be itt RULA, NIO OSH or any other o ergonomics analysis, analysis. Usuually the possitioning of the t digital huuman model in the virtual v environnment brings its own deviaation.
B
A
Fig. 4. Cloud-to-Messh distances (in m meters) in CloudC Compare softwaree. Note: N Most red andd blue segments iindicate non-existing data in the referenced model.
Since it was concluded thhat the 3D scaanning methodd wass an average of four timees faster than n classical 3D D mod delling and also more preciise, it would be b wise to usee this particular method. However, 3D modelling is s it would bee aestthetically morre pleasing thaan the scan, so better for presenntation purposses. The cost of equipmennt 3 scanning is i also considerable. Usuallly the decisionn for 3D on which w methodd to use is madde by company y managemennt and uses softwarre and equipm ment already owned by thee mpany. com For this reseaarch, we pickeed workplaces with as ideaal cond ditions as possible p to aavoid as maany disruptivee influ uences as poossible. For 3D scanning g, we used a
309
Proceedings of the 2016 IEEE IEEM
[8] D. B. Chaffin, “On simulating human reach motions for ergonomics analyses,” Human Factors and Ergonomics in Manufacturing, vol. 12, no. 3, pp. 235-247, June 2002. [9] K. A. Rider, D. B. Chaffin, J. A. Foulke, K. J. Nebel, “Analysis and redesign of battery handling using Jack and HUMOSIM motions,” in SAE Technical Papers, Digital Human Modeling Conference, Rochester, MI, 2004. [10] B. Das, A.K. Sengupta, “Computer-aided human modelling programs for workstation design,” Ergonomics, vol. 38, no. 9, pp. 1958-1972, September 1995. [11] P. Polasek, M. Bures, M. Simon, “Comparison of digital tools for ergonomics in practice,” Procedia Engineering, vol. 100, pp. 1277-1285, 2015. [12] R. Feyen, Y. Liu, D.B. Chaffin, G. Jimmerson, B. Joseph, “Computer-aided ergonomics: A case study of incorporating ergonomics analyses into workplace design,” Applied Ergonomics, vol. 31, no. 3, pp. 291-300, June 2000. [13] Bureš, M. Time Demands of Virtual Ergonomic Modelling – Experimental Study,” Procedia Engineering, in press. [14] S. H. Kelly, K. M. Stanney, Handbook of virtual environments: Design, implementation and application. Mahwah, NJ: Lawrence Erlbaum Associates, 2014. [15] S.W. Chang, M.J.J. Wang, “Digital human modelling and workplace evaluation: Using an automobile assembly task as an example,” Human Factors and Ergonomics in Manufacturing, vol. 17, no. 5, pp. 445-455, September 2007. [16] M. Bures, “New approach to ergonomic design of an industrial workplaces,” in Proceedings of International Conference on Industrial Engineering and Engineering Management, IEEM´09, Hong Kong, China, pp. 881-884. [17] M. Hovanec, H. Pačaiová, F. Hrozek, M. Varga, “Proactive ergonomics based on digitalization using 3D scanning and workplace modeling in Tecnomatix Jack with Augmented Reality,” Nase More, vol. 61, no. 1-2, pp. 22-26, 2014. [18] L. McAtamney, E.N. Corlett, “RULA: A survey method for the investigation of work related upper limb disorders,” Applied Ergonomics, vol. 24, no. 2, pp. 91–99, April 1993. [19]U. Raschke, B.J. Martin, D.B. Chaffin, “Distributed Moment Histogram: A neurophysiology based method of agonist and antagonist trunk muscle activity prediction,” Journal of Biomechanics, vol. 29, no. 12, pp. 1587-1596, December 1996. [20] V.M. Ciriello, S.H. Snook, “The design of manual handling tasks: revised tables of maximum acceptable weights and forces,”Ergonomics, vol. 34, no. 9, pp. 1197-1213, September 1991. [21] T.R. Waters, V. Putz-Anderson, A. Garg, L.J. Fine, “Revised NIOSH equation for the design and evaluation of manual lifting tasks,” Ergonomics, vol. 36, no. 7, pp. 749776, July 1993. [22] M. Kazhdan, H. Hoppe, “Screened Poisson Surface Reconstruction,” in ACM Transactions on Graphics, vol. 32, no. 3, June 2013.
workplace that is static without moving manipulators such as a crane, and we conducted the scanning during the lunch break. Further research will focus on scanning a workplace without taking the advantage of breaks and/or with moving parts. Also we would like to perform more measurements, not only two, to obtain more statistically relevant data. V. CONCLUSION Two experiments to compare the methods of workplace digitization for ergonomics analyses were performed. We compared classical workplace dimension measurement and subsequent3D modelling with 3D scanning. The 3D scanning method was on average four times faster than the classical 3D modelling, and also more precise. The usual difference ranged from 3 cm to 5 cm. Also some completely missing parts were noticed on the 3D model. However, this would not affect the ergonomic analysis so it does not need to be taken into account. ACKNOWLEDGMENT This paper was created with the subsidy of the project LO1502 – Development of Regional Technological Institute carried out with the support of the Ministry of Education, Youth and Sports of the Czech Republic. REFERENCES [1] IEA, “Definition and Domains of Ergonomics,” http://www.iea.cc/whats/index.html, May 2016. [2] B. Das,A. K. Sengupta, “Industrial workstation design: A systematic ergonomics approach,” Applied Ergonomics, vol. 27, no. 3, pp. 157-163, June 1996. [3] X. Zhang, D.B. Chaffin, “A three-dimensional dynamic posture prediction model for simulating in-vehicle seated reaching movements: development and validation,” Ergonomics, vol. 43, no. 9, pp. 1314-1330, 2000. [4] D. Lämkull, L. Hanson, R. Örtengren, “A comparative study of digital human modelling simulation results and their outcomes in reality: A case study within manual assembly of automobiles,” International Journal of Industrial Ergonomics, vol. 39, no. 2, pp. 428-441, March 2009. [5] D.B. Chaffin, “Improving digital human modelling for proactive ergonomics in design,” Ergonomics, vol. 48, no. 5, pp. 478-491, April 2005. [6] N. Badler, “Virtual humans for animation, ergonomics, and simulation,” in Proceedings of the IEEE Nonrigid and Articulated Motion Workshop, San Juan, PR, 1997, pp. 2836 [7] T. Wu, R. Tian, V. G. Duffy, “Performing ergonomics analyses through virtual interactive design: Validity and reliability assessment,” Human Factors and Ergonomics in Manufacturing, vol. 22, no. 3, pp. 256-268, May 2012.
310