Comparison of different methods for measuring leaf area index in a mixed grassland Yuhong He1, Xulin Guo1, 3, and John F. Wilmshurst2 1Department of Geography, University of Saskatchewan, Saskatoon, Saskatchewan, Canada S7N 5A5; 2Western and Northern Service Centre, Parks Canada, Winnipeg, Manitoba, Canada R3B 0R9.
and
Can. J. Plant Sci. Downloaded from www.nrcresearchpress.com by 37.238.139.38 on 08/21/17 For personal use only.
Received 19 February 2007, accepted 29 May 2007. He, Y., Guo, X. and Wilmshurst, J. F. 2007. Comparison of different methods for measuring leaf area index in a mixed grassland. Can. J. Plant Sci. 87: 803–813. Available LAI instruments have greatly increased our ability to estimate leaf area index (LAI) non-destructively. However, it is difficult to infer from existing studies which instrument has the advantages in measuring LAI over other instruments for grassland ecosystems. The objective of our study was to compare the LAI estimates by two instruments (AccuPAR, and LAI2000), and correlate the LAI measurements to remote sensing data for a mixed grassland. Leaf area index of four grass communities was measured by both the destructive method and instruments. Ground canopy reflectance was measured and further calculated to be LAI-related vegetation indices. Statistical analysis showed that destructively sampled LAI ranged from 0.61 to 5.7 in the study area. Both instruments underestimated LAI in comparison with the destructive method. However, the LAI 2000 is better than AccuPAR for estimating LAI. Comparison of four grass communities indicated that the lower the grass LAI, the greater the underestimated percentage of LAI values collected by both instruments. The adjusted transformed soil-adjusted vegetation index (ATSAVI), was the best LAI estimator in the mixed grassland. Key words: Leaf area index, sward structure, nondestructive vegetation sampling, hyperspectral remote sensing, mixed grass prairie He, Y., Guo, X. et Wilmshurst, J. F. 2007. Comparaison de diverses méthodes pour mesurer l’indice foliaire des prairies mixtes. Can. J. Plant Sci. 87: 803–813. Les instruments existants ont considérablement amélioré notre aptitude à estimer l’indice foliaire de manière non destructive. Toutefois, les études actuelles permettent difficilement d’établir quels sont les meilleurs instruments pour établir l’indice foliaire des écosystèmes des prairies. L’étude devait comparer les estimations de deux appareils (AccuPAR et LAI2000), et corréler leurs relevés aux données sur une prairie mixte obtenues par télédétection. Les auteurs ont mesuré l’indice foliaire de quatre peuplements de graminées avec les instruments et par la méthode destructive. Ils ont déterminé l’albédo de la couverture au sol qui, a-t-on établi, présente une corrélation avec l’indice de végétation associé à l’indice foliaire. L’analyse des données statistiques révèle que l’indice foliaire des échantillons détruits variait de 0,61 à 5,7 dans la zone examinée. Comparativement aux résultats obtenus par la méthode destructive, les deux appareils sous-estiment l’indice foliaire. Quoi qu’il en soit, le LAI 2000 estime mieux l’indice foliaire que l’AccuPAR. La comparaison des quatre peuplements de graminées indique que plus l’indice foliaire est faible, plus la proportion de valeurs sous-estimées par les appareils est grande. La version adaptée de l’indice de végétation ajusté selon le sol (ATSAVI) demeure la meilleure méthode pour estimer l’indice foliaire des prairies mixtes. Mots clés: Indice foliaire, structure des peuplements, échantillonnage non destructif de la végétation, télédétection en hyperespace spectral, prairies mixtes
Quantitative assessment of vegetation abundance and distribution in rangelands is an important tool to measure the health and productivity of both grazed and protected grasslands. Recent advances in satellite technology make such assessments feasible at landscape scales expanding their utility to include large-scale monitoring of disturbance effects. However, making the link between measures of vegetation abundance on the ground and reflectance measured from orbiting satellites requires the use of consistent, repeatable and readily attainable ground measures that have both a theoretical and realized correlation to commonly used vegetation indices, such as the Normalized Difference Vegetation Index (NDVI). We have noted an increasing gap
between the proliferation of satellite-based estimates of biophysical features of the earth’s surface and the ability for biologists and managers alike to corroborate these estimates with ground-based measures. Vegetation density estimates based on destructive sampling cannot keep pace with the increasing demand for large-scale biomass determination. Leaf area index (LAI), a measure of the total one-sided leaf area per unit of ground area, encompasses many of the features needed to fill this gap. It is an important canopy variable (Deblonde et al. 1994; Lane et al. 2000) in studying feedback mechanisms between plant community composition and ecosystem processes (Chapin et al. 1998) as well as being a measure of canopy biomass, density and hetero-
3To
Abbreviations: LAI, leaf area index; VI, vegetation index; SLA, specific leaf area
whom correspondence (
[email protected]).
should
be
addressed 803
Can. J. Plant Sci. Downloaded from www.nrcresearchpress.com by 37.238.139.38 on 08/21/17 For personal use only.
804
CANADIAN JOURNAL OF PLANT SCIENCE
geneity at small spatial scales. Within the mixed grassland prairie, LAI is being used to monitor carbon balance and assess grass quality and productivity (Guo et al. 2005; Black 2006; Zhang et al. 2006). Its measurement using optical interference techniques from ground calibrated instruments has a close statistical relationship to reflectance measures (Curran, 1983; Best and Harlan 1985; Peterson et al. 1987; Baret 1995; Price and Bausch 1995; Qi et al. 2000). Hence, there is a strong functional basis for using LAI and remote sensing data to measure biophysical properties of vegetation canopies. Various ground methods have been developed for LAI measurement (Bréda 2003). The most direct measure involves physical removal of leaves from the plant and derivation of their cumulative area instrumentally. While accurate on a per-unit basis, this approach is destructive and very labor intensive. Indirect methods measure specific leaf area (SLA) on a sub-sample of leaves and relate the measured leaf area to the biomass (cm2 g–1). The total dry mass of leaves collected within a known ground-surface area is converted to LAI by multiplying by the SLA (Bréda 2003). Alternatively, the rapid and nondestructive LAI can be measured by commercial canopy analysers, such as the AccuPAR Ceptometer (Decagon Devices, Pullman, WA) and LAI 2000 Plant Canopy Analyser (Li-Cor, Lincoln, NE). These devices measure optical interference of the canopy by comparing simultaneous measures of light interception above and below the plant canopy and converting this to LAI using standard equations. Although all the commercial devices provide an independent set of protocols for gathering accurate estimates of LAI, it is necessary for practitioners to know how these instruments perform under field conditions for specific vegetation (Hyer and Goets 2004). Many comparisons between the destructive and nondestructive methods of LAI measurement have been published for crops (Brenner et al. 1995; Levy and Jarvis 1999; Wilhelm et al. 2000) and forest stands (Chason et al. 1991; Smith et al. 1991; Fassnacht et al. 1994; Dufrêne and Bréda 1995; Chen et al. 1997; Comeau et al. 1998; Barclay and Trofymow 2000; Küßner and Mosandl 2000). Unfortunately, the comparisons of results from different studies are inconsistent. It is difficult to infer from existing studies which instrument has the advantages in measuring LAI over other instruments for grassland ecosystems. Measurements of LAI in mixed grassland prairie vegetation are rarely reported in the literature and difficult to collect in the field (Przeszlowska et al. 2006). Few comparisons of the destructive and nondestructive methods for measuring leaf area have been published for the mixed grassland vegetation, despite the many ecological uses of such measures. In the absence of such comparisons there is the risk that users will believe too readily that their instruments give results that reflect true LAI (Brenner et al. 1995). While this has few consequences if the LAI measures are to be used only to estimate biomass, uncorrected values may, for instance, give biased estimates of rates of photosynthesis or carbon balance if they are not reliably measuring actual leaf area. To permit meaningful association of many uses
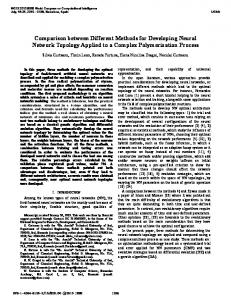
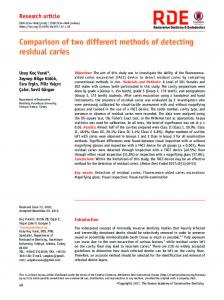
of LAI from the various methods available, we sought: (1) to compare nondestructive measurement of leaf area by two commercially available instruments, the AccuPAR Ceptometer and LAI 2000 Plant Canopy Analyser, with destructive measurements of leaf area, (2) to compare LAI difference between four grass communities, and (3) to relate remote sensing products with LAI measurements. MATERIALS AND METHODS Study Site The field study was conducted at the West Block of Grasslands National Park of Canada (GNP, Fig. 1), in southwest Saskatchewan, Canada (N 49º12′, W 107º24′). This area falls within the mixed-grass prairie biome of the northern Great Plains, and is characterized by semi-arid climate, open landscape and large areas dominated by herbaceous plant communities (Coupland 1993). Average temperatures range from –12.4ºC in January to 18.3ºC in July, and average precipitation is approximately 350 mm per year (Environment Canada 2000). The dominant native grass species found in the study site are needle-and-thread grass [Hesperostipa comata (Trin. & Rupr.) Barkworth], blue grama [Bouteloua gracilis (Willd. ex Kunth) Lag. ex Griffiths], and western wheatgrass [Pascopyrum smithii (Rydb.) A. Löve]. Other prominent invasive or introduced species at the study site includes smooth brome (Bromus inermis Leyss) and crested wheatgrass [Agropyron cristatum(L.) Gaertn]. Since forbs and shrubs are only 5.2 to 15.5% of the mean basal cover in the mixed grassland (Coupland 1950), we have focussed on the grass communities in this study. Experimental Design and Data Analysis During the peak growing season (2006 Jun. 15–30), we sampled 24 sites, each 120 cm × 120 cm, selected in a stratified random sampling design. These sites encompassed a wide range of grass density (Fig. 2): (1) six sites dominated by smooth brome (high density, Fig. 2a); (2) six sites dominated by western wheatgrass (medium to high density, Fig. 2b); (3) six sites dominated by crested wheatgrass (medium to high density, Fig. 2c); and (4) six sites dominated by a mixed blue grama and needle-and-thread grass community, hereafter referred to as the blue grama community (low to medium density, Fig. 2d). The most consistent problem with optical LAI measurements is the variability among the measurements within samples (Jonckheere et al. 2004). For this reason, we removed the non-grass species in the 24 sites to minimize the effect of strong patchiness in the distribution of forb species, and took sufficient measurements to a normal error distribution among readings. At each site, data acquisition included 12 AccuPAR measurements with three taken evenly along each side, four LAI 2000 measurements collected from four sides, two canopy reflectance measured 1 m above the canopy, and four clipped grass samples taken within the 0.1 m2 hoop placed in the center of each quarter of the site (Fig. 3). With the AccuPAR instrument, 12 under canopy measurements were taken and averaged to obtain
Can. J. Plant Sci. Downloaded from www.nrcresearchpress.com by 37.238.139.38 on 08/21/17 For personal use only.
HE ET AL. — METHODS FOR MEASURING LEAF AREA INDEX IN A MIXED GRASSLAND
805
Fig. 1. The study area: Grasslands National Park and surrounding pastures, southern Saskatchewan, Canada, located at the international boundary of Canada and the United States. The Park is composed of two blocks – east and west.
LAI estimate for each site. A 45° azimuthal view restrictor was used on the LAI 2000, oriented toward the opposite sky quadrant from the sun’s position. This view restrictor was used for both above- and below-canopy measurements. The LAI 2000 was shaded when measurements were taken to reduce the glare effect of direct sunshine. Four LAI 2000 measurements were collected and averaged for each site and each LAI 2000 measurement was the combined result of one above canopy reading followed by the average of eight below canopy readings taken within 2 min to avoid atmospheric variation (Fig. 3). LAI measurements for both instruments were taken as close as possible to the ground. In different sites, this selection represented a different fraction of the total vegetation canopy. The soil surface of native grass sites was virtually blanketed with low stature, cryptogrammic vegetation such as mosses Selaganella densa. While these account for a substantial portion of the total vegetation cover, and affect total canopy reflectance (Goetz and Prince 1996), they could not be included in our measurements of canopy light reflectance, interception, and transmission. In contrast, we found little or no cryptogrammic material at brome or crested wheatgrass sites. Canopy hyperspectral reflectance was measured twice at each site using an Analytical Spectral Devices, Inc. (Boulder, CO) FR Pro spectroradiometer. The measurement wavelength range was 350–2500 nm, and the spectral resolution was 3 nm at 700 nm and 10 nm at 1400 and 2100 nm.
The 25° field of view probe was used pointing down at the canopy at approximately 1 m above ground. Measurements were taken within 2 h of solar noon on sunny days. Calibration was done using a white spectralon reflectance panel (Labsphere, Inc., North Sutton, NH) at approximately 10 min intervals to minimize the changes in atmospheric condition. After all other measurements were completed grass in four 0.1 cm2 hoops within a site (Fig. 2) was cut at the soil surface and removed from the site. Clipped fresh grass from each hoop was placed in a sealed bag, and stored in a refrigerator at 2°C. In the laboratory the grass in each sealed bag was sorted into green and dead fractions and the leaves of the green fraction were used to measure in situ LAI. Ten percent of sampled leaves by weight were taken as a subsample. The subsampled leaf area was measured by plotting the leaf surface on gridded cardboard. Subsample leaves and the rest of green leaves was dried separately in an oven for 48 hours at 60ºC and weighed. Total leaf area (m2) per hoop was calculated as LAh = Wt × SLA
(1)
Where LAh is leaf area obtained from a hoop, Wt is the total weight (g) of all leaves removed from a hoop, SLA is the specific leaf area (m2g–1) of the subsample that can be expressed as:
Can. J. Plant Sci. Downloaded from www.nrcresearchpress.com by 37.238.139.38 on 08/21/17 For personal use only.
806
CANADIAN JOURNAL OF PLANT SCIENCE
Fig. 2. Photos of the four typical grass communities taken from study area: (a) smooth brome (high density), (b) western wheatgrass (medium to high density), (c) crested wheatgrass (medium to high density), and (d) blue grama community (low to medium density).
SLA = LAs / Ws
(2)
where LAs is the plotted leaf area of the subsample and Ws is the weight (g) of subsampled leaves. Therefore, the site mean destructive LAI (DLAI) was calculated as DLAI =
1 4
4
∑ i =1
LAhi 1 = 0.1 4
4
∑ i =1
(
Wti × LAsi / Wsi 0.1
)
(3)
where Wh is the weight of grass in the hoop, and i is the number of hoops in each plot. Several studies (Zhang 2005; He et al. 2006) have investigated the relationships between vegetation biophysical properties and remote sensing data in the mixed grasslands and found that vegetation indices were highly correlated with LAI in the mixed grassland. In the present study, we also examined the relationships between remote sensing data and LAI measurements. We first correlated LAI measures (both DLAI and OLAI) with canopy hyperspectral
reflectance data along the wavelength to see whether there are any differences, especially in the NIR and the red region, since these two regions are the foundation of most of the common vegetation indices in use today. Then we further derived commonly used vegetation indices, NDVI (Normalized Difference Vegetation Index, Rouse 1974), RDVI (Renormalized Difference Vegetation Index, Reujean and Breon 1995), SAVI (soil-adjusted vegetation index, Huete 1988), TSAVI (transformed soil-adjusted vegetation index, Baret et al. 1989), and ATSAVI (Adjusted Transformed Soil-adjusted Vegetation Index, Baret et al. 1991), from the canopy hyperspectral reflectance data and correlated to each LAI measure. These VIs have been derived to maximize vegetation signal while minimizing “noise” such as atmosphere, soil background, surface bidirectional properties, and other sources of uncertainty. Hence, in theory they should correlate well with ground based biophysical measures of the vegetation canopy. A two tailed t-test was used to assess whether the means of DLAI and OLAI (optical LAI measures) are statistically
Can. J. Plant Sci. Downloaded from www.nrcresearchpress.com by 37.238.139.38 on 08/21/17 For personal use only.
HE ET AL. — METHODS FOR MEASURING LEAF AREA INDEX IN A MIXED GRASSLAND
807
Fig. 3. The positioning of the hoop (0.1 cm2, hollow circles) where the grass is cut in each site, and the positioning of the sensors where under-canopy LAI readings were taken with the LAI 2000 (small grey circles) and AccuPAR (the bold line). The positioning of the sensors was shown for only one side of a site. In the field, we measured optically to estimate LAI for four sides of each site with the instruments and averaged all the measurements to represent LAI for this site.
different from each other based upon a particular significance level (e.g., 95%). The relationships between DLAI (independent variable) and OLAI (dependent variable) were further investigated using linear regression analysis, where the linear regression was fit with least squares. Destructive LAI estimates were assumed to provide true values of LAI and served as the standard of comparison for the instruments. Statistical relationships were compared with correlation coefficients (r), coefficients of determination (r2), and the slopes of the best-fit regression lines. The equality of the two or more sample correlation coefficients was tested with methods described by Zar (1984). The coefficient of determination was chosen because it was widely used empirical approach for evaluating relationship between two variables. By comparing the slope of the best-fit regression lines with 1:1 reference line, we can conclude that the instruments overestimate DLAI if the slopes are greater than 1, or underestimate DLAI if the slopes less than 1. The statistical analyses were performed using SPSS 13.0 software (SPSS, Inc. 2004). RESULTS Method Comparison Within the 24 sites, a total of 96 data acquisitions were made using LAI 2000, and 288 acquisitions were made using AccuPAR. Destructive measurements taken simultaneously with the two instruments provided a data set of 96 matched acquisitions for comparison of the two instruments. Results from the calculation of basic statistics showed that instruments significantly underestimated LAI (paired t-tests, P < 0.05). Estimated LAI in the study sites ranged from 0.61 to 5.7 for the destructive method, from 0.38 to 3.74 for the LAI 2000, and from 0.44 to 3.44 for the AccuPAR (Table 1). On average, the LAI 2000 measurement was 15.3% lower than destructive LAI, while AccurPAR measurement was 28.7% lower.
The linear regression (Fig. 4 A, B) yielded a best-fit line with a slope of 0.70 for LAI 2000 and 0.66 for AccuPAR. These results further confirmed that both instruments generally underestimated DLAI and indicated there is a biomass bias in the instruments since the slopes were significantly different from 1. The r2 for instruments and destructive measurements indicated that DLAI more strongly correlated with OLAI measured by LAI 2000 (r2 = 0.81) than that by AccuPAR (r2 = 0.75). However, comparing two correlation coefficients between OLAI (LAI2000 or AccuPAR) and DLAI indicated the difference between two instruments is not statistically significant [refer to Zar (1984), Z = 0.55, Z0.05(2) = 1.960, Z < Z0.05(2) demostrated that the equality of two correlation coefficients]. Since the data point (DLAI 5.8, OLAI 3.7 for LAI2000 or 3.4 for AccuPAR) in Fig. 4 A, B might influence the relationships between DLAI and OLAI, we also considered this point in particular. This data point was collected from a location with dense grass. Therefore, we cannot simply exclude it as an outlier without further analysis. After removing this point from the regressions (Fig. 4 C, D), OLAI values were still significant correlated with DLAI values but r values were reduced. There were no significant differences between correlation coefficients for the relationship between OLAI and DLAI with or without the point. The slopes in the Fig, 4 C, D indicated that the biomass bias in the instruments still existed, but were reduced. Comparison of Vegetation Communities Mean LAI measurements from destructive sampling differed significantly among the four grassland communities (P < 0.05). Smooth brome had the highest LAI value (2.76), while the blue grama community showed the lowest LAI value (1.04) (Fig. 5). The mean LAI values were 2.22, 2.07, and 1.04 for western wheatgrass, crested wheatgrass, and
Can. J. Plant Sci. Downloaded from www.nrcresearchpress.com by 37.238.139.38 on 08/21/17 For personal use only.
808
CANADIAN JOURNAL OF PLANT SCIENCE
Fig. 4. Comparison of LAI measured with two instruments and LAI calculated from the destructive method, including the measurements from all grass communities. Figure A shows the relationship between LAI 2000 measurements and DLAI, and B is the relationship between AccuPAR measurements and DLAI. Considering the effect of one data point (DLAI 5.8, OLAI 3.7, 3.4) on the relationship between DLAI and OLAI, we also compared the relationships after removing this point in Figs. C and D. The bold lines in the figures are linear fit lines and dashed lines are the 1:1 reference line. The equations show the slopes (the coefficients of DLAI) are less than 1, indicating that both instruments underestimate DALI.
the blue grama community respectively. This result was consistent among all approaches of measurements. Among grass communities, the two optical instruments gave consistently lower LAI estimates compared with DLAI (Fig. 5), and AccuPAR generally underestimated LAI more than LAI 2000 (Table 2). Although the correlations between DLAI and measured LAI from instruments were high (Fig. 4), they varied among grass communities. Generally, we can see that the lower the grass LAI, the higher the underestimated percentage of LAI values collected by both instruments. Comparison of Remote Sensing Data Spectra of the mean reflectance of all grass communities are shown in Fig. 6. Like any green vegetation spectrum, they
exhibited the general characteristics of high NIR, but low visible reflectance. However, distinct differences can be seen among the grass communities: the reflectance spectrum of invasive grasses, particularly smooth brome, showed a relatively high reflectance in the NIR region and strong absorption in the red region. Conversely, the reflectance spectrum of native grass, especially blue grama, exhibited lower reflectance values in NIR and weaker absorption in the red region. LAI measures were correlated to canopy reflectance along the 350–800 nm wavelength region (Fig. 7). The 350–800 nm region was selected since this region was highly related to vegetation biophysical properties. Comparison of different LAI methods exhibited a similar tendency: strong correlations in red and NIR wavelengths and weaker
Can. J. Plant Sci. Downloaded from www.nrcresearchpress.com by 37.238.139.38 on 08/21/17 For personal use only.
HE ET AL. — METHODS FOR MEASURING LEAF AREA INDEX IN A MIXED GRASSLAND
809
Fig. 5. Comparison of LAI estimates by all methods among four grass communities. The values above the bars are mean LAI values from each grass community.
correlations in the green region. Noticeable differences were that the coefficient values varied among three methods: in the NIR region, AccuPAR measurements were more closely correlated with spectral measurements, while in the red region, LAI 2000 measurements were more highly correlated with reflectance. LAI measurements were even more strongly correlated with the VIs than they were with the reflectance measurements that were used to calculate the VIs (Table 3). Among the selected VIs, ATSAVI was always better than other indices in estimating LAI, although only marginally so. Optically estimated LAI showed stronger correlations with VIs than destructive LAI. Between two instruments, AccuPAR LAI was more strongly correlated with VIs than LAI 2000 measurements. However, the correlation coefficients were not significantly different among the three methods (Table 3, Zar 1984). DISCUSSION Optical measures of leaf area index predict leaf area in the vegetation community by measuring light interception of a vegetation canopy. Our results show that the instruments measure LAI with 75% or better accuracy. However, we also detected a non-random bias in the instruments that has important implications for predicting real LAI or other biophysical features of vegetation communities. We suggest that there are at least three explanations for this bias. First, when measuring grass LAI with instruments, it is impossible to position the sensor (the 80-m sensor from AccuPAR and the fisheye sensor from LAI 2000) under the grass canopy without disturbing it. This resulted in higher incident light deeper in the canopy, and an underestimate of leaf interception and LAI. The second reason for underestimation is “radiative error”. The instruments derive LAI from absorbed radiation and ignore leaf transmission scattering, and all second-order radiative effects (Hyer and Goetz
Table 1. Statistical results of three methods, n is sample number, SD is standard deviation LAI 2000 AccuPAR Destructive
N
Minimum
Maximum
Mean ± SD
24 24 24
0.38 0.44 0.61
3.74 3.44 5.7
1.71 ± 0.845 1.44 ± 0.828 2.02 ± 1.085
2004). Canopy interception based on a sensor parallel to the ground takes biased measurements of real canopy light interception that is, in reality, three-dimensional, leading to an overestimate of canopy transmission, and underestimation of LAI (Roujean 1999; Leblanc and Chen 2001; Hyer and Goetz 2004). The third, widely accepted reason for underestimation is the non-random distribution of foliage within the canopy. The degree of error in the LAI measurement is a result of the canopy’s deviation from this assumption of random dispersion (clumping) (Nison 1971; Lang 1986, 1987; Chen et al. 1997; Kucharik et al. 1997). In this study, the data point with the highest DLAI, increased the biomass bias in the instruments, which may indicate sensor saturation at high LAI. On average, we found that biases of the optical LAI instruments increased with decreasing canopy density. Given that canopy bulk density increases as a cube of ground area, whereas LAI increases as its square, canopy disturbance of leaf transmission, and resultant clumping, all interact non-linearly with canopy biomass or leaf area. The unexpectedly large error for the crested wheatgrass community may result from the architecture of its leaves. Crested wheatgrass has narrow (2–4 mm) and rigid blades (a typical erectophile leaf distribution), which were more easily parted compared with the curled leaves of the native grasses and the wide (5–15 mm) and flat blades of smooth brome (a typical planophile leaf distribution, Fig. 1) (Moss 1983; Kimes et al. 1987; Mynemi and Williams 1994). This led to greater canopy disturbance when we measured optical reflectance and, hence, greater
810
CANADIAN JOURNAL OF PLANT SCIENCE
Table 2. The destructive LAI and the percentage of underestimated LAI from two instruments Smooth brome
Western wheat
Crested wheat
Blue grama
2.76 13.1% 20.4%
2.22 14.2% 24.9%
2.07 16.7% 43.2%
1.04 20.1% 30.8%
Can. J. Plant Sci. Downloaded from www.nrcresearchpress.com by 37.238.139.38 on 08/21/17 For personal use only.
Destructive LAI LAI 2000 underestimate AccuPAR underestimate
Fig. 6. Spectra of the reflectance over four grass communities along wavelength region. The spectra are averaged from the hyperspectral data in each grass community.
Table 3. Correlation coefficients between vegetation indices and LAI measurements from both instruments and destructive method Correlation coefficients LAI 2000 AccuPAR Destructive χ2 (χ20.05,2 = 5.991)
NDVI 0.80** 0.85** 0.75** 0.81
RDVI
SAVI
0.76** 0.81** 0.70** 0.67
0.81** 0.85** 0.77** 0.56
TSAVI
ATSAVI
0.80** 0.85** 0.75** 0.81
0.82** 0.86** 0.77** 0.75
correlations are significant at the 0.01 level (2-tailed), and χ2 is a quantity that is used for testing the siginficance between correlation coefficients (Zar 1984).
**All
departure from the DLAI standard. This study also demonstrated that LAI 2000 readings were different from those for the AccuPAR for grass LAI estimation. This would be explained by differences in the shape of the sensors. The AccuPAR has an 80-cm sensor, which disturbed more grass coverage than the fisheye sensor of the LAI 2000. However, the correlation coefficients of the instruments were not significantly different. Our findings are consistent with several studies that also compared nondestructive LAI measures to destructive LAI estimates from agricultural crops. For example, Wihelm et al. (2000) reported that in corn (Zea mays L.), the same two LAI meters that we used underestimated LAI when compared with absolute LAI. The underestimated percentage in the present study was from 15.3% (LAI 2000) to 28.7% (AccuPAR), which was similar to the reported 25–50% range (Bréda 2003). However, other studies have reported different results. For example, Hunt et al. (1999) found that the LAI 2000 overestimated LAI in full-season soybean fields defoliated by grasshoppers and the bean leaf beetle (C. trifurcate). Hunt et al. (1999) suggested that the instru-
ments should overestimate LAI since each uses light interception in computing LAI. Instruments do not discriminate between leaf and stem; therefore, all plant parts are counted as leaf area in proportion to the amount of light they intercept. In contrast, destructive sampling measured only the area of leaf blades. The difference in definition of leaf area between the methods suggests that the instruments would overestimate LAI. The discrepancy between our results with those of Hunt’s (1999) is likely dependent on the differences between the crops being investigated. Grass stems are very thin and occupy a small area in proportion to total leaf area. Furthermore, Weiss et al. (2004) concluded that OLAI should be higher than DLAI because OLAI measures LAI for both green and senescent vegetation, whereas DLAI measures only green leaves. Indeed, the contribution of senescent vegetation might be significant in the native grass sites; however, the disagreement in results from this study indicated that three possible reasons caused underestimation might make up the contribution of senescent vegetation. Although the reflectance of vegetation is similar in general, grass communities can vary slightly in spectra. The
Can. J. Plant Sci. Downloaded from www.nrcresearchpress.com by 37.238.139.38 on 08/21/17 For personal use only.
HE ET AL. — METHODS FOR MEASURING LEAF AREA INDEX IN A MIXED GRASSLAND
811
Fig. 7. Correlation coefficients between canopy reflectance and LAI measurements along wavelength region (350–800 nm).
relationship between LAI and spectral values exhibited general patterns of correlation that were universal across three LAI measurement methods: red and NIR regions of the spectrum had the highest correlations with LAI. Consequently, vegetation indices, calculated based on reflectance data in Red and NIR regions, had the strongest relationships with LAI measures. Comparison of different VIs indicated that ATSAVI was marginally better at estimating LAI than other vegetation indices. This result was consistent with other studies from the same study area (He et al. 2006; Zhang 2005) in which the ATSAVI was also the best index of biophysical features of grassland explaining more of LAI variation than other vegetation indices. Comparison of destructive and nondestructive methods showed that VIs were better correlated with optically estimated measurements (OLAI), although the differences in r values between methods are not statistically significant. This is likely due to non-green components (litter) in the samples. As noted in the methods, destructive LAI measures were only obtained from green grass leaves. However, when estimating LAI by two instruments and collecting canopy reflectance by the spectroradiometer, it is not possible to totally distinguish between green and non-green elements such as senescent leaves (Weiss et al. 2004). Consequently, the source of error introduced by the non-green part in both optical LAI and reflectance measurements may explain their stronger relationships. In comparison with AccuPAR measurements, LAI 2000 measurements were weakly correlated with all selected VIs, but simultaneously exhibited stronger correlations with reflectance in the red region and weaker correlations in the NIR region. These results suggest to us that the reflectance in the NIR region performed a major role in estimating LAI in comparison with reflectance in the red region when using vegetation indices. In summary, the two LAI instruments substantially underestimated LAI in four grass communities. Optical LAI
estimates should therefore be calibrated with destructive measures for quantitative determination of LAI (Johnson and Pierce 2004). Spectral channels in the red-NIR regions are generally more important than those in the other region for predicting LAI. Vegetation indices were generally sensitive to LAI, and ATSAVI was marginally better than others we tested. However, the following challenges remain: (1) validating in situ LAI measurements, especially since destructive sub-sampling may not be sufficiently precise over the plot area; (2) examining the sensitivity of the instruments to different in situ conditions; and (3) addressing the differences between DLAI and OLAI. The DLAI is a measure of the total one-sided green leaf area per unit of ground area, while the OLAI measured canopy LAI including the effects of senescent vegetation, low cryptogrammic vegetation, and canopy architecture. These three factors might not cause a significant difference in the smooth brome sites, but will certainly affect OLAI in the other sites, especially in the native grass sites with a large amount of dead material, a high percentage of low cryptogrammic vegetation, and more erectophile plants. ACKNOWLEDGEMENTS This study was partially supported by the Parks Canada Species at Risk Recovery Action and Education Fund, a program supported by the National Strategy for the Protection of Species at Risk. The authors would like to thank Grasslands National Park of Canada for providing logistical support. Special thanks go to Arun Govind, Chunhua Zhang, and Jesse Nielsen for helping with field data collection. We greatly acknowledge the valuable comments and suggestions from the two anonymous reviewers for the improvement in the manuscript. Barclay, H. J. and Trofymow, J. A. 2000. Relationship of readings from the LI-Cor canopy analyser to total one-sided leaf area index and stand structure in immature Douglas-fir. Agricultural
Can. J. Plant Sci. Downloaded from www.nrcresearchpress.com by 37.238.139.38 on 08/21/17 For personal use only.
812
CANADIAN JOURNAL OF PLANT SCIENCE
and Forest Meteorology 132: 121–126. Baret, F. 1995. Use of spectral reflectance variation to retrieve canopy biophysical characteristics. Pages 33–51 in M. Darson and S. Plummer, eds. Advances in environmental remote sensing. John Wiley and Sons, Inc., New York, NY. Baret, F. and Guyot G. 1991. Potentials and limits of vegetation indices for LAI and APAR assessment. Remote Sens. Environ. 35: 161–173. Baret, F., Guyot, G. and Major, D. J. 1989. TSAVI: a vegetation index which minimizes soil brightness effects on LAI and APAR estimation. Vol. 3: 1355–1358 In IGARSS ‘89, Proceedings of the IEEE International Geoscience and Remote Sensing Symposium and 12th Canadian Symposium on Remote Sensing. 1989 Jul. 10–14, Vancouver, BC. IEEE, Piscataway, NJ. Best, R. G. and Harlan, J. C. 1985. Spectral estimation of green leaf area index of oats. Remote Sens. Environ. 17: 27–36. Black, S. C. 2006. Estimation of grass photosynthesis rates in mixed-grass prairie using field and remote sensing approaches. Masters thesis, University of Saskatchewan, Saskatoon, SK. Bréda, N. 2003. Ground-based measurements of leaf area index: a review of methods, instruments and current controversies. J. Exp. Bot. 54: 2403–2417 Brenner, A. J., Cueto, R. M., Garcia, H. J., Gilabert, M. A., Incoll, L. D., Martinez, F. J., Porter, E., Pugnaire, F.I. and Younis, M.T. 1995. A comparison of direct and indirect methods for measuring leaf and surface areas of individual bushes. Plant, Cell Environ. 18: 1332–1340. Chapin, F. S. III., Sala, O. E., Burke, I. C., Grime, J. P., Hooper, D. U., Lauenroth, W. K., Lombard, A., Mooney, H. A., Mosier, A. R., Naeem, S., Pacala, S. W., Roy, J., Steffen, W. L. and Tilman, D. 1998. Ecosystem consequences of changing biodiversity—experimental evidence and a research agenda for the future. Bioscience 48: 45–52. Chason, J., Baldocchi, D. and Hutson, M. 1991. A comparison of direct and indirect methods for estimating forest leaf area. Agric. For. Meteorol. 57: 107–128. Chen, J. M., Rich, P. M., Gower, T. S., Norman, J. M. and Pulmmer, S. 1997. Leaf area index on boreal forests: theory, techniques and measurements. J. Geophys. Res. 102: 429–444. Comeau, P., Gendron, F. and Letchford, T. 1998. A comparison of several methods for estimating light under a paper birch mixedwood stand. Can. J. For. Res. 28: 1843–1850. Curran, P. J. 1983. Multispectral remote sensing for the estimation of green leaf area index. Phil. Trans. R. Soc. Lond. Ser. A 309: 257–270. Coupland, R. T. 1950. Ecology of mixed prairie in Canada. Ecol. Monogr. 20: 271–315. Coupland, R. T. 1993. Mixed prairie natural grasslands, introduction and Western Hemisphere. Pages 151–179 in R. T. Coupland, ed. Ecosystems of the world. Elsevier, New York, NY. Deblonde, G., Penner, M. and Royer, A. 1994. Measuring leaf area index with the LI-COR LAI 2000 in pine stands. Ecology 75: 1507–1511. Dufrêne, E. and Bréda, N. 1995. Estimation of deciduous forest leaf area index using direct and indirect methods. Oecologia 104: 156–162. Environment Canada. 2000. National climate data and information archive. [Online] Available: http://www.climate.weatheroffice.ec.gc.ca/Welcome_e.html [2006 Feb. 06]. Fassnacht, K. S., Gower, S. T., Norman, J. M. and McMurtrie, R. E. 1994. A comparison of optical and direct methods for estimating foliage surface area index in forests. Agric. For. Meteorol. 71: 183–207. Goetz, S. J. and Prince, S. D. 1996. Remote sensing of net pri-
mary production in boreal forest stands. Agric. For. Meteorol. 78: 149–179. Guo, X., Zhang, C., Wilmshurst, J. F. and Sissons, R. 2005. Monitoring grassland health with remote sensing approaches. Prairie Perspect. 8: 11–22. He, Y., Guo, X. and Wilmshurst, J. 2006. Studying mixed grassland ecosystems I: suitable hyperspectral vegetation indices. Can. J. Remote Sens. 32: 98–107. Huete, A. R. 1988. A soil-adjusted vegetation index (SAVI). Rem. Sens. Environ. 25:295–309. Hunt, T. E., Haile, F. J., Hoback, W. W. and Higley, L. G. 1999. Indirect measurement of insect defoliation. Environ. Entomol. 28: 1136–1139. Hyer, E. and Goetz, S. J. 2004. Comparison and sensitivity analysis of instruments and radiometric methods for LAI estimation: assessments from a boreal forest site. Agric. For. Meteorol. 122: 157–174. Johnson, L. F. and Pierce, L. L., 2004. Indirect measurement of leaf area index in California North coast. HortScience 39: 236–238. Jonckheere, I., Fleck, S., Nackaerts, K., Muys B., Coppin, P., Weiss, M. and Baret, F. 2004. Review of methods for in-situ leaf area index determination, Part I: Theories, techniques and instruments. Agric. For. Meteorol. 121: 19–35. Kimes, D. S., Sellers, P. J. and Newcomb, W. W. 1987. Hemispherical reflectance variations of vegetation canopies and implications for global and regional energy budget studies. J. Appl. Meteorol. 26: 959–972. Küßner, R. and Mosandl, R. 2000. Comparison of direct and indirect estimation of leaf area index in mature Norway spruce stands of eastern Germany. Can. J. For. Res. 30: 440–447. Kucharik, C. J., Norman, J.M., Murdock, L. M. and Gower, T. S. 1997. Characterizing canopy nonrandomness with a Multiband Vegetation Imager MVI. J. Geophys. Res. 102: 455–473. Lane, D. R., Coffin, D. P. and Lauenroth, W. K. 2000. Changes in grassland canopy structure across a precipitation gradient. J. Veg. Sci. 11: 259–268. Lang, A. R. G. 1986. Leaf area and average leaf angle from transmittance of direct sunlight. Aust. J. Bot. 34: 349–355. Lang, A. R. G. 1987. Simplified estimate of leaf area index from transmittance of the sun’s beam. Agric. For. Meteorol. 41: 179–186. Leblanc, S. G. and Chen, J. M. 2001. A practical scheme for correcting multiple scattering effects on optical LAI measurements. Agric. For. Meteorol. 110: 125–139. Levy, P. E. and Jarvis, P. G. 1999. Direct and indirect measurements of LAI in millet and fallow vegetation in HAPEX-Sahel. Agric. For. Meteorol. 97: 199–212. Moss, E. H. 1983. The flora of Alberta. 2nd ed. revised by J. G. Packer. University of Toronto Press, Toronto, ON. pp. 70–78. Mynemi, R. B. and Williams, D. L. 1994. On the relationsip between FAPAR and NDVI. Remote Sens. Environ. 49: 200–211. Nilson T. 1971. A theoretical analysis of the frequency of gaps in plant stands. Agric. Meteorol. 8: 25–38. Peterson, D. L., Spanner, M. A., Running, S. W. and Teuber, K. B. 1987. Relationship of thematic mapper simulator data to leaf area index of temperate coniferous forest. Remote Sens. Environ. 22: 323–341. Price, J. C. and Bausch, J. C. 1995. Leaf area index estimation from visible and near-infrared reflectance data. Remote Sens. Environ. 52: 55- 65. Przeszlowska, A., Trlica, M. J. and Weltz, M. A. 2006. Nearground remote sensing of green area index on the shortgrass prairie. Rangeland Ecol Manage 59: 422–430. Qi, J., Kerr, Y. H., Moran, M. S., Weltz, M., Huete, A. R.,
Can. J. Plant Sci. Downloaded from www.nrcresearchpress.com by 37.238.139.38 on 08/21/17 For personal use only.
HE ET AL. — METHODS FOR MEASURING LEAF AREA INDEX IN A MIXED GRASSLAND Sorooshian, S. and Bryant, R. 2000. Leaf area index estimates using remotely sensed data and BRDF models in a semiarid region. Remote Sens. Environ. 73: 18–30. Reujean, J. L. 1999. Measurements of PAR transmittance within boreal forest stands during BOREAS. Agric. For. Meteorol. 93: 1–6. Reujean, J. L. and Breon, F. M. 1995. Estimating PAR absorbed by vegetation from bidirectional reflectance measurements. Remote Sens. Environ. 51: 375–384. Rouse, J. W., Haas, R. H., Schell, J. A., Deering, D. W. and Harlan, J. C. 1974. Monitoring the vernal advancement of retrogradation of natural vegetation. Page 371 in National Aeronautics and Space Administration, Goddard Space Flight Center (NASA/GSFC), Type III, Final Report, Greenbelt, MD. Smith, F. W., Sampson, A. D. and Long, N. J. 1991. Comparison of leaf area index estimates from tree allometrics and measured light interception. For. Sci. 37: 1682–1688.
813
SPSS Inc. 2004. SPSS Base 13.0 for Windows User’s Guide. SPSS Inc., Chicago, IL. Weiss, M., Baret, F., Smith, G. J., Jonckheere, I. and Coppin, P. 2004. Review of methods for in situ leaf area index (LAI) determination. Part II. Estimation of LAI, errors and sampling. Agric. Forest Meteorol. 121: 37–53. Wilhelm, W. W., Ruwe, K. and Schlemmer, M. R. 2000. Comparison of three leaf area index meters in a corn canopy. Crop Sci. 40: 1179–1183. Zar, J. H. 1984. Biostatistical analysis. Prentice Hall, NJ. pp. 313–315. Zhang, C. 2005. The evaluation of broadband vegetation indices on monitoring Northern mixed grassland. Prairie Perspect, 8: 23–36. Zhang, C., Guo, X., Wilmshurst, J. F. and Sissons, R. 2006. Application of radarsat imagery on grassland biophysical heterogeneity assessment. Can. J. Remote Sens. 32: 281–287.
Can. J. Plant Sci. Downloaded from www.nrcresearchpress.com by 37.238.139.38 on 08/21/17 For personal use only.