J. Ind. Geophys. Union ( April 2007 ) Vol.11, No.2, pp.111-116
Comparison of drop size distribution between stations in Eastern and Western coasts of India R.Harikumar, V.Sasi Kumar, S.Sampath and P.V.S.S.K.Vinayak Atmospheric Sciences Division, Centre for Earth Science Studies, Thiruvananthapuram - 695 031 Email :
[email protected] ABSTRACT A Joss-Waldvogel type disdrometer was installed at Thiruvananthapuram, Kochi, and Sreeharikotta (SHAR) during various periods. This paper presents results from the analysis of the data. Drop Size Distribution (DSD) and rainfall rate for each minute were computed from the disdrometer data, and the entire data for each month were sorted by rainfall rate. The data were then divided into different ranges of rainfall rate and DSD computed for each. The average DSD for each range was fitted with a lognormal distribution function of the form N(D) = (a0/D) exp (-0.5(ln( D)-a1)/a2)2 where D = drop diameter, N(D) = number of drops/m3/mm interval. The results show the following: For the lowest rainfall intensity, the distribution is narrow and is dominated by small drops. With increase in intensity, the distribution spreads out and more larger drops appear. However, in some cases, the data does not follow the lognormal distribution. The total number of drops, NT, geometric mean diameter, Dg and standard geometric deviation, σ was derived from the ai. NT showed a tendency to increase slightly with rainfall rate. Dg followed a simple power relationship of the form Dg = b0Rb1. The standard geometric deviation did not show any significant dependence on rainfall rate. The characteristics of rainfall in terms of the three parameters for coastal stations on the west coast are similar. The rate of increase of NT is higher at SHAR than at Kochi. NT is higher at SHAR than at Kochi for any particular rainfall rate, indicating that, unlike Kochi and other stations on the western coast, rainfall at SHAR is made up of more number of smaller drops. INTRODUCTION Information on raindrop size distribution is of interest in different areas like microwave communication, radar meteorology, soil erosion and cloud physics. There is much interest in these areas for several reasons, including climatic change, and increasing soil erosion due to expanding human activities. With the development of instruments that can give drop size data continuously and at relatively low costs, DSD measurements are becoming more common. However, there haven’t been many measurements in India (Reddy & Kozu 2003; Jassal, Verma and Singh 1994; Krishna Reddy et al. 2005; Mali, Sarkar & Das 2003; Verma & Jha 1996). We present here the measurement and comparison of DSD between Stations in Eastern and Western coasts of India with special reference to Thiruvananthapuram, Kochi (western stations) and Sriharikota (Eastern station), using a Joss-Waldvogel (JW) type disdrometer. Some preliminary results from Thiruvananthapuram were presented in an earlier paper (Sasi Kumar, Sampath & Vinayak 2003).
Three different distribution functions are used to describe rain drop size spectra, namely, the Marshall and Palmer (Marshall & Palmer 1948) type of exponential distribution, the gamma distribution and the lognormal distribution. Large number of measurements have shown the inadequacy of the exponential distribution model, particularly when the data are averaged over short intervals. It is generally agreed that the exponential distribution is valid only for data averaged over long periods of time (Joss & Gori 1978), or over large volumes of space. Raindrop spectra often tend to have a monomodal distribution, which can be modelled by the gamma distribution function. This is a three parameter model in contrast to the exponential distribution, which is a two parameter model. The gamma function has the advantage that it tends to the exponential function as one of the parameters tends to zero. In both cases, however, the parameters have no physical significance. The lognormal distribution was explored by Feingold and Levin (Feingold & Levin 1986) and was found to be as good as, if not better than, the gamma 111
R.Harikumar et al.
distribution in terms of fitting with observations. While the former showed better fit with the observed raindrop size distribution, the computed rainfall rate was marginally better when the gamma function was used. However, the lognormal distribution has the advantage that the parameters have physical significance (Feingold & Levin 1986). The variations in these parameters with rainfall intensity or with time would, therefore, have implications on the physical processes that lead to the formation of raindrops and the processes that take place as the drops fall from the cloud to the ground. Feingold and Levin (Feingold & Levin 1986) computed the fit parameters by using the observed total number concentration, NT , and the number of drops in each size class to calculate the geometric mean and standard geometric deviation. A different method has been followed here. Instead of computing the fit parameters, curve fitting was done using a software, and the values of total number of drops, geometric mean and standard geometric deviation were calculated, as explained later. DATA AND DATA ANALYSIS A Joss-Waldvogel type disdrometer manufactured by M/ s Distromet Ltd., Switzerland, was installed in the premises of our institute in April 2001, and measurements were made from April to August. Subsequently, the instrument was installed at Kochi, Munnar and Sriharikota for short durations and then brought back to Thiruvananthapuram. Both Thiruvananthapuram and Kochi are coastal stations on the western side, while Sriharikota is on the eastern coast. The disdrometer gives the number of drops in twenty different size classes ranging from 0.313 mm to >5.373 mm, integrated over one minute intervals. Being an impact type disdrometer, the data are prone to errors due to dead time after a drop hits the sensor, which can be corrected using an expression or a correction matrix. Data analysis was carried out as follows: The data obtained were corrected for dead time. The rainfall rate for each minute was then computed from the corrected data, and the entire data for each month was sorted in ascending order of rainfall intensity. The data were then divided into different ranges of rainfall intensity, as explained below. The number of drops per cubic metre of air per unit diameter interval was computed for each range of rainfall rate. The mean drop size distribution (DSD) and the mean rainfall intensity for each range was then determined. Each DSD data set was fitted with a lognormal distribution function of the form 112
N(D) = (a0/D) exp (-0.5(ln( D)-a1)/a2)2
(1)
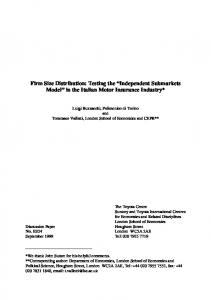
where D is the drop diameter, N(D) is the number of drops per cubic meter per unit diameter interval, and the ai (a0, a1, a2) are fit parameters. The functional fits were made using gnuplot, that uses the Marquardt-Levenberg algorithm for non-linear curve fitting. From these fits, the fit parameters a0, a1 and a2 are obtained. We then derived the three parameters that have physical significance, namely, NT, total number of drops, Dg, geometric mean diameter and, σ the standard geometric deviation. Using these parameters the characteristics of rainfall at these sites can be studied. The intensity ranges were chosen such that the width of the range increases in a roughly exponential manner because the data showed that the rainfall duration was maximum at the low intensity end and decreased exponentially with increasing intensity. We found that the number of minutes during which rainfall occurred became small at higher rainfall intensities even after the ranges were chosen in this manner. RESULTS AND DISCUSSION The raindrop size distributions measured at Kochi, Thiruvananthapuram and SHAR along with the fitted lognormal distributions, are shown for August (south west monsoon period) and for October (north east monsoon period) in Fig.1. It can be noted that the measured DSD follows the lognormal distribution closely. The graphs, in general, show that the number of drops increases rapidly and then decreases gradually, as expected for a lognormal distribution. The number of drops with larger diameters increases as the rainfall intensity increases. The peak of the lognormal distribution has a large spread in the stations on the western coast compared to SHAR, on the east side. In a few cases, the increase in number of drops at smaller drop radii is also seen. The fitted curves, ignoring these exceptions, are used to derive the three physically meaningful parameters NT, total number of drops, D g, geometric mean diameter and σ, the standard geometric deviation. From these parameters, the characteristics of rainfall at these places can be studied. The values of NT, Dg and σ computed from the fitted curves were plotted against rainfall intensity to understand how they are influenced by intensity. These show some interesting behaviour. The standard geometric deviation, σ did not show any significant variation with rainfall intensity as shown in Fig 2. For the other two parameters, the fitted lines are functions of the form y = a xb.
Comparison of Drop Size Distribution between Stations in Eastern and Western coasts of India
Figure 1. Drop size distribution at Thiruvananthapuram, Kochi and SHAR during August and October. The log normal fitting to the measured data points are also shown. 113
R.Harikumar et al.
Figure 2. The standard geometric deviation of drop size derived from the log normal fitting, shown for all the 3 stations.
(a)
(b)
Figure 3. The variation of NT, total number of drops against the rainfall intensity for all the 3 stations: for August in (a) and for October in (b). 114
Comparison of Drop Size Distribution between Stations in Eastern and Western coasts of India
(a)
(b)
Figure 4. The variation of Dg, geometric mean diameter with rainfall intensity for all the 3 stations: for August in (a) and for October in (b) The parameter NT, total number of drops is shown together with a fitted line of the form y = a xb in Fig 3 (a) for the south west monsoon period and 3 (b) for the north east monsoon period. It can be seen that both Kochi and SHAR follow the exponential behaviour more closely than Thiruvananthapuram in both monsoon periods. This shows that with increase in rainfall intensity, the number of drops also increases. This would mean that an intense rainfall at Kochi and SHAR does not mean an increase in drop size but an increase in the number of drops. But at Thiruvananthapuram, an increase in rainfall intensity does not mean an increase in number of drops but an increase in drop size. Therefore, we see that Kochi and SHAR, though on west and east coasts behave similarly. But Thiruvananthapuram behaves differently. The third parameter, geometric mean diameter, Dg derived from the lognormal fitting of the DSD data is shown in Fig.4 (a) and 4 (b). Here also the points together with the fitted curve of the form y = a xb are shown. The geometric mean diameter at Thiruvananthapuram increases more rapidly than at Kochi and SHAR. The maximum rain drop size reached at SHAR is less than those at Thiruvananthapuram and Kochi. Thus, the DSD measurements at Thiruvananthapuram, Kochi and SHAR bring out the similarities and differences in the rain characteristics. The rainfall in the west coast consists of larger drops than those at SHAR for a given rainfall intensity.
CONCLUSIONS The DSD follows a log normal distribution in the west as well as east coast stations. The drop diameter at which the lognormal distribution peaks shows a larger variation at stations Thiruvananthapuram and Kochi, on the western coast compared to SHAR, on the eastern side. The total number of drops varies exponentially with rainfall intensity at both Kochi and SHAR. But the variation at Thiruvananthapuram is much less than that seen at the other two stations. The variation of geometric mean diameter of rain drops with rainfall intensity suggests that the rainfall at SHAR consists of smaller drops compared to Kochi and Thiruvananthapuram for the same rainfall intensity. ACKNOWLEDGEMENTS The project was financially supported by the Department of Science & Technology, Govt. of India. We extend our thanks to Dr. B.D.Acharya and Dr. D.Ram of DST for their support. We thank Dr. M. S. Narayanan of Space Applications Centre, Ahmedabad, Mr. G. Viswanathan of RDC, ISRO, Bangalore and the Met. Section of SHAR for the assistance and help offered during the measurements at SHAR. The Director, CESS is thanked for support. 115
R.Harikumar et al.
REFERENCES Feingold, G. & Levin, Z., 1986. The lognormal fit to raindrop spectra from frontal convective clouds in israel, J. Clim Appl Meteorol (USA), 25, 1346-1363. Jassal, B., Verma, A. & Singh, L., 1994 Raindrop size distribution and attenuation for Indian climate, Indian J. Radio and Space Phys., 23, 3, 193-196. Joss, J. & Gori, E., 1978, Shapes of raindrop size distributions, J. Appl. Meteorol (USA), 17, p. 1054. Krishna Reddy, K., Toshiaki Kozu, Yuichi Ohno, Jain, A.R. & Narayana Rao, D., 2005. Estimation of vertical profiles of raindrop size distribution from the VHF wind profiler radar Doppler spectra. Indian J Radio and Space Phys, 34, October, 319-327
Mali, P., Sarkar S. & Das, J., 2003 Rain drop size distribution from radar reflectivity measurements, Indian J. Radio and Space Phys., 32, 296-300. Marshall, J. & Palmer W., 1948, The distribution of raindrop with size, J Meteorol (USA), 5, p.165-166 Reddy, K.K. & Kozu, T., 2003, Measurements of raindrop size distribution over Gadanki during south-west and north-east monsoon, Indian J. Radio and Space Phys., 32, 286-295. Sasi Kumar, V., Sampath, S. & Vinayak, P.V.S.S.K., 2003. Drop size distribution of rainfall of different intensities, Indian J. Radio and Space Phys., 32, 217-220. Verma, A. & Jha, K., 1996, Raindrop size distribution model for Indian climate, Indian J. Radio and Space Phys., 25,1, 15-21.
(Accepted 2007 February 25. Received 2007 February 20; in original form 2005 December 14) Mr. R. Harikumar is a Research Scholar in the Atmospheric Sciences Division of Centre for Earth Science Studies (CESS), Thiruvananthapuram, Kerala. He took his Masters in Physics with specialization in Electronics from Kerala University. He is pursuing his Ph.D in Physics with ‘Rain Drop Size Distribution (DSD)’ as his specific research area at Cochin University of Science and Technology (CUSAT), Kerala, India through the CESS. He has 2 research papers in the refereed journals and 6 national and inter-national seminar proceedings and presentations. He is involved in the field of characterization of tropical rainfall with special reference to Rain drop size distribution, Rain rate and Radar reflectivity factor. Dr. V. Sasi Kumar is a senior scientist in the Atmospheric Sciences Division of Centre for Earth Science Studies, Thiruvananthapuram. He is a member of the American Geophysical Union and a life member of the Indian Meteorological Society. His research interests are rainfall studies and cloud physics.
Dr. S. Sampath took his Masters in Physics with specialization in Electronics from Madras University. He took his Ph. D on the studies of equatorial electrojet from Gujarat University through the Physical Research Laboratory, Ahmedabad. He worked as a scientist in National Physical laboratory, New Delhi. Then he shifted to CESS, Thiruvananthapuram. He has about 50 papers in national and inter-national refereed journals and an equal number in seminar proceedings and presentations.
Dr.P.V.S.S.K. Vinayak after obtaining M.Sc.(Tech) in Meteorology & Oceanography, joined Centre for Earth Science Studies and has been working as Scientist since 1982. He took his Ph.D in Agricultural Meteorology from Andhra University. He has specialized in the discipline of Agroclimatology and has been carrying out his work on Climatological and Analytical studies, Rainfall variability and characteristics, Agroclimatological characterization, Soil moisture studies and in soil climate relationship. He is involved in various internally and externally funded research projects. He has guided few students for their Masc. dissertation work. He has been Secretary, IMS Cochin Chapter and presently Member, Executive Council of the IMS Cochin Chapter. He is presently on the panel of CUSAT, KAU and MGU as an Expert/Guide Examiner. 116