FROM VERTICALLY POINTING MICRO RAIN RADAR (MRR). Malte Diederich ..... an accurate drop density, which will introduce a random error. In order to get a ...
2nd Workshop of the International Precipitation Working Group
SPATIAL AND TEMPORAL VARIABILITY OF DROP SIZE DISTRIBUTION FROM VERTICALLY POINTING MICRO RAIN RADAR (MRR)
Malte Diederich, Clemens Simmer and Alessandro Battaglia Meteorological Institute of the University of Bonn, Germany
ABSTRACT The validation of rain retrieval algorithms for satellite measurements or ground based radar requires meaningful reference precipitation estimates. However, the common rain gauge is limited by its in-situ perspective, with virtually no information on the nature of the precipitation process. Errors in ground truth arise from low sensitivity and necessary integration time, losses through strong winds, drop splashing, dirt and evaporation. Weather radar yields improved hydrometeor detection and area coverage, but has remaining deficits when it comes to ground truth or quantitative precipitation estimation (QPE) due to the very variable relation between radar reflectivity (Z) and rain rate (R). Although volume measurements are possible with weather radar by performing scans at different elevation angles, characterization of the precipitation process with respect to water phase, vertical profile from the ground to higher altitudes, and in terms of rain rate or liquid water content remain ambiguous. In this article, we present the Micro Rain Radar (MRR2), which gives an alternative QPE method. This low cost Doppler radar measures vertical profiles of radar reflectivity as well as spectra of fall velocity of hydrometeors, and estimates the drop size distribution (DSD) of rain using a relation between terminal fall velocity and drop diameter for liquid precipitation.
1. THE MICRO RAIN RADAR (MRR-2) The validation of rain retrieval algorithms for satellite measurements or ground based radar requires meaningful reference precipitation estimates. However, the common rain gauge is limited by its in-situ perspective, with virtually no information on the nature of the precipitation process. Errors in ground truth through low sensitivity and necessary integration time, losses through strong winds, drop splashing, dirt and evaporation (Habib et al, 2001) are rarely considered when using gauge estimates. Disdrometers have higher sensitivity than tipping-bucket gauges but share a similarly small measurement volume. Weather radar yields improved hydrometeor detection in the radar beam and area coverage, but has remaining deficits when it comes to ground truth or quantitative precipitation estimation (QPE) due to the very variable relation between radar reflectivity (Z) and rain rate (R). Although volume measurements are possible with weather radar by performing scans at different elevation angles, characterization of the precipitation process with respect to water phase, vertical profile from the ground to higher altitudes, and in terms of rain rate or liquid water content remain ambiguous. The Micro Rain Radar (MRR-2) gives an alternative QPE method. This low cost Doppler radar measures vertical profiles of radar reflectivity as well as spectra of fall velocity of hydrometeors, and estimates the drop size distribution (DSD) of rain using a relation between terminal fall velocity and drop diameter for liquid precipitation. A detailed instrument description is given by Peters et al (2002,2003). This method allows more precise rain rate estimation than the usual Z-R relation of
2nd Workshop of the International Precipitation Working Group
weather radar and accounts for the variable nature of the DSD. The sensitivity to low rain rates (better than 0.1 mm/h in a 10 second averaging period) outclasses that of a rain gauge (0.1 mm in one hour at best), the rain rate being measurable at any height ranging from 30 meters to 3 km. The melting layer and ice phase are easily detected through the altered relation between radar reflectivity and fall velocity, although no quantitative estimates of water amounts are yet implemented for ice. The high sensitivity, high resolution in time and space, improved reflectivity to rain rate conversion, and ability to measure from ground to several kilometers height can be exploited for the following purposes: •
Operational measurements of rain rate at ground level can be supplemented with rain type characterizations like presence of melting layer/ice phase, current Z-R relation or DSD parameters, vertical extent of precipitation, evolution of rain intensity with height, and temporal variability. This will be useful to flag measurements when testing rain retrieval algorithms for satellite, weather radar or models, and could also be done in real time for weather radar or satellite now-casting to adapt to the regional weather conditions.
•
The attribution of MRR high time resolution reference measurements to other instantaneous remote sensing measurements, such as satellite overpasses/scans or weather radar scans, is more precise and representative than rain gauge estimates which are accumulations over several minutes.
•
The spatial variability of reflectivity, DSD and rain rate inside the radiometer footprint of a satellite or weather radar beam can be resolved and repercussions estimated or simulated (Fabri, 1992). A network of low cost MRRs can extend volume coverage in the horizontal plain.
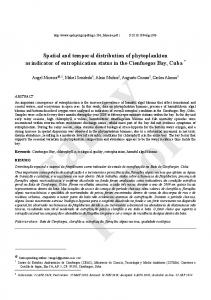
An assessment of these capabilities was made in an intensive measurement campaign. During the second Baltex Bridge Campaign (BBC-2) in May 2003, a multitude of European institutes contributed remote sensing and in-situ equipment to study clouds and precipitation at the meteorological observatory at Cabauw, the Netherlands. A network of MRRs (see Figure 1) was set up to resolve small scale variability of the DSD within a volume comparable to that of a weather radar pixel. Several rain gauges, a 2D-Video disdrometer, and the Transportable Atmospheric Radar (TARA) were used to test MRR performance. Volume scans and pCAPPI (pseudo-Constant-Altitude Plan-Position Indicator) images from the weather radar in de Bilt, measurements of the meteorological tower, two wind profilers and a pulsed 35 GHz cloud radar were also available for extensive analysis of weather situations.
2. INSTRUMENT SETUP AND GENERAL PERFORMANCE The MRRs were set up at distances of roughly 30, 200, and 600 meters from each other (Figure 1) with a vertical range of 70 to 2100 meters and resolution of 70 meters in order to cover a volume comparable to that of a weather radar pixel. The different distances allowed the determination of decorrelation of measurements as a function of range, spatial variability of rainfall, and instrument precision. During the campaign averaging time was set to 30 seconds and perfect synchronization was guaranteed by network time protocol.
2nd Workshop of the International Precipitation Working Group
Figure 1. Instrument layout.
Comparison of reflectivity measurements by all MRRs and other radars showed that large calibration errors in 2 MRRs. The origin of this constant bias is not certain but some evidence points to wrongly assessed system or antenna gain. One of them displayed slight impediment through high noise (MRR 3) levels, MRR 4 was left out in further analysis. A constant heightdependent bias against weather radar volume scans and other vertically pointing radars of -2 dB per 1000 meters altitude was discovered in all MRRs at the campaign, and afterwards confirmed by the manufacturer. The cause is believed to be an error in the FMCW transfer function, but could be compensated once discovered. Errors through noise level and attenuation of the 24 GHz MRR signal could be directly measured in comparison with the also vertically pointing TARA, its frequency of 3 GHz being virtually unattenuated and noise level well below -30 dBZ. The MRR attenuation algorithm performed moderately well when calibration of the instrument was correct since it relies on an accurate assessment of the DSDs in its beam path. However, deterioration of the signal to noise ratio through strong attenuation exaggerated the number of small drops in heavy rain, which made the rain rate estimation at high altitude unusable during extreme events. The near ground DSD estimates of the MRR showed relatively good agreement with the 2D-video disdrometer in the parameters rain rate and reflectivity. During very windy conditions with predominant small drops, the in-situ characteristics of the disdrometer and wind entrainment (Nespor et al, 2000) hampered the capturing of small drops (Figure 2). Case studies illustrating this effect (figures 4 and 7) are given in the following. Hourly accumulations of rain derived from the MRR DSDs had higher correlation with the disdrometer and gauges than any conventional Z-R relationship in the form of a power law. The agreement between MRR and rain gauge was best in medium rain rates, with higher MRR accumulations during both very low rain rates due to lower gauge sensitivity and during extreme events (figure 3). In very heavy rain, the lower gauge or higher MRR estimate may be caused partly by splashing losses or mechanical failure in the gauge. However disagreement between MRRs and contemplation of the Doppler spectra and DSD showed that an overestimation is also caused by the before mentioned exaggeration of small drop
2nd Workshop of the International Precipitation Working Group
numbers. The new software version is less vulnerable to this effect because of an improved noise correction scheme, but it was implemented only in one MRR during BBC-2.
Figure 2. Total drop densities for a 5 day period as estimated by 3 MRRs (uncorrected calibration errors) and the 2D-video disdrometer. The deviations in small drops are caused probably caused by wind losses (see case studies below).
Figure 3. Accumulated precipitation measured by the MRR between 2 rain gauge pulses(ticks) as a function of time between two ticks. One tick corresponds to 0.2 mm fallen precipitaion, so high rain rates cause a shorter interval. The larger part of the scattering is caused by arbitrary mechanical compliance times of the tipping bucket in the gauge. The MRR measures more rain in very weak events (on the right in figure) and extreme events (left).
3. CASE STUDIES The presented case studies illustrate some error sources in operational QPE methods as well as possibilities for enhanced weather radar or satellite signal interpretation. The MRR measurements alone permit the easy identification of melting layer and larger quantities of ice hydrometeors above it (vertical reflectivity profiles in Figures 4 to 9). This may be an important asset for the
2nd Workshop of the International Precipitation Working Group
validation of passive microwave rain retrieval algorithms since they rely strongly on scattering by ice particles (Weng et al 2003, Ferraro 1997). The rain type displayed in figure 7 will give underestimation of precipitated water by both in situ instruments and weather radar, while the absence of larger quantities of ice would also leave it unnoticed by satellite microwave rain retrieval.
Figure 4. Example of rain event with common Z-R behaviour. Deviations of Z/R ratios between MRR and disdrometer are caused by losses of small drops in the in-situ disdrometer through horizontal wind, thus raising the Z/R ratio. The melting layer is seen in the 'bright band' at 1800 meters. Top left: Time series of MRR vertical reflectivity profiles. The black lines limit the measurements included in the scatterplots, the colored crosses on the lines indicate the corresponding height. Top right: Z/R ratio as a function of intensity. The curve represents one of the standard Z-R relations Z=250R^1.4 used in radar meteorology. Prominence of large drops gives a high Z/R ratio, dominance of small drops gives a low Z/R ratio. The colors indicate the altitude of the measurement: blue=1500 meters, orange=800 meters, red=200 meters, black: 2Dvideo disdrometer at ground level. Deviations of the Z/R ratio from the standard power law will cause measuremen errors if this power law is applied to calculate rain rate from weathr radar data. Bottom left: horizotal wind velocity in 2 m height measured by the meteorological tower. Bottom right: logarithmic Z-R scatterplot. The line indicates the same commonly used Z-R power law for reference. Middle: weather radar scan with MRR location marked by cross.
________________________________________________________________________________ In a number of cases (Figures 4 to 9) the observed relations between Z and R stay constant for a certain time period, which together with consequences of altered Z/R ratio for QPE motivate an MRR-controlled adaptation of the Z-R relation applied to the weather radar scans for a limited
2nd Workshop of the International Precipitation Working Group
region and time period. The same may be suggested for vertical profiles in the cases of figures 7 and 8. The agreement between MRR and disdrometer is good enough to give confidence in MRR Z-R estimates, except in cases where the deviations could be traced down to horizontal wind. An automated classification to the shown rain types with respect to the needs of weather radar or satellite algorithms appears to be feasible. Still such a classification scheme will not bring improvements in all rain events, as very inhomogeneous events did not display temporary compliance to a power law. Figure 9 shows a rain event during which Z-R relation and vertical profile should give good results in weather radar QPE, but still a scan interval of 5 minutes and high variability could cause the estimate to deviate by 50% of the real value. The information given by the MRR accounts for such occurrences, while it would remain unexplainable when using only a rain gauge.
Figure 5. As previous with no drop losses through horizontal wind for the disrometer.
2nd Workshop of the International Precipitation Working Group
Figure 6. Event without visible melting layer and few large drops, leading to low Z/R ratio.
4. MEASURING SMALL SCALE VARIABILITY OF RAIN WITH COMBINED INSTRUMENTS The spatial resolution of remote sensing devices commonly used for area precipitation measurement is around 1 km for weather radar and from 8 to 30 km for satellite-based passive microwave. Significant gradients in drop density occur within these scales, which is not only a problem for validation with point measurements but also creates ambiguities for mean precipitation since its relations to the received signals are not linear. A net of MRRs can provide both statistics of typical small scale variability and high resolution coverage of the weather radar or satellite pixel for improved signal interpretation. Since neither satellite nor weather radar provide continuous temporal coverage, a high time-resolution of the validation tool will test performance in the instantaneous measurement and also put it into perspective with deviations originating from incomplete temporal sampling (figure 9). Because of displacement of the targets by wind advection, near instantaneous measurements are needed to effectively assess the spatial variability inside a volume smaller than one cubic kilometer. Another central issue for capturing small scale variability is that random measurement errors must not cloud the (seemingly) random deviations caused by true variability of rainfall. If the sampling volume is very small the contained number of raindrops will not be sufficient to calculate an accurate drop density, which will introduce a random error. In order to get a more representative sample one must either probe a larger volume containing a significant number of drops or integrate over longer time periods. For the latter, the temporal variability of rain will be smoothed out together with the random errors, and systematic measurements errors may be the only remaining effect to contemplate (Miriovski et al, 2004). For the MRR data of BBC-2, observations in 30 second and 1 minute time intervals were representative enough to attribute
2nd Workshop of the International Precipitation Working Group
Figure 7. Drizzle event with no visible melting layer. The bottom left shows accumulated precipitation calculated from radar reflectivity with the power law Z=250R^1.4 (dashed lines), from the DSD (bold lines) in several heights (color coding, disdrometer in black). Strong horizontal wind of about 10 m/s (not shown) and the dominance of small drops led to underestimation of total precipitation and overestimation of Z/R ratio by the in situ-disdrometer. Weather radar would also strongly underestimate total precipitation because the vertical reflectivity profile decreases with height and the Z/R ratio stays far below commonly used Z-R power laws. Satellite passive microwave rain retrieval algorithms for land strongly depend on scattering in the ice phase, and would also have trouble recognizing this sort of rain because of the absence of larger ice quantities. The MRR estimate near ground (bold red line) should be considered to be the best estimate in this case, with gross underestimation by in-situ (black line) and weather radar (dashed orange or blue) measuring modes. ______________________________________________________________________________ deviations between synchronous drop densities to decorrelation with range and spatial variability over the distance of 600 meters. While the size of the volume in the MRR beam may still give estimates meaningful enough to identify spatial variability at smaller distances, typical horizontal wind velocities clouded the variability below 200 meters (Figures 11a and 11b). In order to make true use of the capability to deliver high resolution DSD estimates in higher altitudes, a more elaborate way of combining MRR data with other volume estimates than simple geographical collocation is desirable. For this purpose a model that interpolates MRR drop size distributions back into time and space was developed. For a chosen moment in time, the drops’ Doppler falling velocity and horizontal wind vector measured by MRR and wind-profilers are used to project the closest 30-second averaged drop populations into space according to the estimated motion vector (Figure 12). As a first test of applicability the location of the illuminated volume of individual weather radar pixels from the de Bilt weather radar (beam and pixel width at Cabauw: 300 meters, pixel length 1 km) was calculated with regard to height above ground, antenna gain, and pixel orientation. If a weather radar pixel contained enough MRR estimates, the weather radar
2nd Workshop of the International Precipitation Working Group
Figure 8. Here weather radar would give overestimation of precipitation at ground level, and a passive microwave scattering algorithm would probably respond to the ice above the well defined melting layer.
measurement was simulated by calculating radar reflectivity from the spatially interpolated DSD and correlated with the real volume scan measurements from de Bilt. The highest correlation achieved in this way was 0.94 (with worse correlation for low weather radar elevations because of clutter signals produced by the meteorological tower in Cabauw), as opposed to 0.89 between conventionally collocated and synchronized measurements. This result gives the perspective of measuring the DSD inside the pixel of a polarimetric weather radar, which may hopefully lead to significant advances in this field particularly in very inhomogeneous rain. However it should be pointed out that the volume drop size distribution given by the model is still an averaged and interpolated estimate, and does not reflect the true spatial variability if MRR averaging time and horizontal wind velocity are large. This was made evident by the fact that the degree to which a virtual weather radar pixel was filled with MRR estimates (depending on wind velocity and direction) did not significantly affect the correlation between real and simulated weather radar measurements. This could not be expected also because the precision of the de Bilt time stamp (not better than 20 seconds) and wind advection (sometimes more than 300 meters in 20 seconds) could not allow for perfect collocation of interpolated and real reflectivity values. The correlation length (at which correlation has dropped to 1/e) of the weather radar pixels for the considered timeframe was around 4 km. We have come closer to measuring DSD and weather radar reflectivity of the same drop population, but there is still much room for improvement.
2nd Workshop of the International Precipitation Working Group
Figure 9. While the vertical reflectivity profile is nearly constant , the DSD producing a standard power law, the measurements well below the melting layer,the accumulated sums from weather radar may still contain a random error through high temporal variability: The dotted orange line in the bottom left plot show precipitation sums derived from 5 minute interval instantaneous sampling at 10 30-second phase shifts, giving a spread of over 80 %. Similar dotted lines are included in figures 7 and 8, but the effect is less pronounced because of lower variability.
Figure 10. Correlation between drop densities measured by different 2 instruments as a function of drop diameter. Densities were averaged over 1 minute (purple), 5 minutes (blue), 30 minutes
2nd Workshop of the International Precipitation Working Group
(green), 1 hour (yellow),and 6 hours (red). For the 1 minute values spatial variability and distance (approximately 200 meters between MRR 1 and 3, 600 meters to MRR 2) cause the lower correlation with MRR 2, random errors through electronic noise are the probable cause of the lower correlation for small drops. The lower correlation with the disdrometer is explained by the need for a larger sampling volume or longer integration time to give representative drop numbers.
Figure11a. Correlation between MRR measurements (left), vectors of wind advection for 30 seconds relative to MRR positions as measured by wind-profiler (top right) and weather radar scan during a spatially homogenous event . Correlation between drop densities measured by 2 MRRs as a function of Doppler bin number (~drop diameter). 30 second MRR estimates in 70 meters (blue) to 2100 meters (red) height are shown. The low correlation in low Doppler bins (small drop diameters), like the decrease of correlation with height is the result of electronic noise (highest in MRR 3).
2nd Workshop of the International Precipitation Working Group
Figure 11b: As above in Figure 10a, but for spatially inhomogeneous event with numerous small rain cells. The larger part of decorrelation is caused by distance and spatial variability. The advection distances and averaging times still cause fairly similar (highly correlated) values for MRR 1 and 3.
2nd Workshop of the International Precipitation Working Group
Figure 12. Volume rendering of MRR measurements. The MRR estimates are interpolated into space by using the known fall velocities of drop classes and horizontal advection vectors. The wind profile (raw wind profiler measurements given as green and orange lines, smoothed profile given by red lines) forms the slices of estimated volume-DSD. A weather radar measurement is simulated from these slices by performing a linear weighted average of volume reflectivity. The weighting system consists of assumed antenna gain of the weather radar (example given in purple) and weight 0 for no data.
5. CONCLUSIONS, SUGGESTIONS, AND FUTURE PLANS During the BBC-2 campaign the fairly new instrument MRR has been subjected to evaluation in many respects. The first results showed inadequate performance when accumulating precipitation over longer periods due to calibration errors and signal degradation in heavy rain. Still other capabilities such as resolving small scale variability and providing extensive analysis of individual precipitation events, in particular quantities independent of calibration such as Z/R ratio, mean fall velocity, and vertical profile give way to other applications than only measuring total precipitation. Instrumental inadequacies such as miscalibration and the constant height dependent bias did not decorrelate measurements, and their magnitude was small relatively to spatial gradients occurring in showery weather. The relatively simple model for MRR value interpolation showed some success but leaves room for improvement with better resolution and coverage. The extensive instrument comparisons as well as the possibility for complete analysis of weather situations at BBC-2 have brought a great gain of knowledge on potential, error sources, and feasibility of MRR applications. MRR measurements at Cabauw continued until October 2003, giving more case studies and data than could be fully analyzed till now. Some suggested applications can be directly tested with existing satellite and weather radar data. More MRR data is
2nd Workshop of the International Precipitation Working Group
currently being recorded at the Meteorological Institute of the University of Bonn, and an experimental real-time combination of X-Band weather radar and MRR, validated by a surrounding net of rain gauges, is being set up within the next weeks. The experience gained at BBC-2 has laid the ground for confidence in the success of a larger experiment combining a network of 10 MRRs and polarimetric weather radar. A denser MRR network, a more reliable weather radar timestamp, consolidated MRR software versions and prior calibration should address all problems encountered in the pre-experiment. The MRR DSDs will then be used directly for comparison with measurements from 2 weather radars, one of them polarimetric with high resolution. Multiple error sources known in radar meteorology (variable DSD, attenuation, vertical reflectivity profile, ice phase, incomplete temporal sampling) will be monitored with even greater proficiency than BBC-2 and complemented with polarimetric weather radar measurements.
6. REFERENCES Fabry, F.,G.L. Austin, D. Tees, 1992: The accuracy of rainfall estimates by radar as a function of range, Quarterly Journal, Royal Met Soc, 118 pp 435-453 Ferraro, R.R., 1997: Special Sensor microwave imager derived global rainfall estimates for climatological applpications, J. Geoph. Res, Vol 102, No D14, pp 715-735 Habib, E., W.F. Krajewski, A. Kruger, 2001: Sampling Errors of Tipping-Bucket Rain Gague Measurements, J. Hyd. Eng,159-166. Miriovski, B.J, A. Bradley, W. E. Eichinger, W.F. Krajewski, A. Kruger, B.R. Nelson, 2004: An Experimental Study of Small-Scale Variability of Radar Reflectivity Using Disdromter Observations, J. Appl. Meteor. Nespor, V., W.F. Krajewski, A. Kruger, 2000: Wind-induced error of raindrop size distribution using a two-dimensional video disdrometer, J. Atmos. Ocean Technol. 17, p 1483-1492 Peters, G., B. Fischer, H. Münster: Micro physical rain parametrs with a vertically looking Micro Rain Radar (MRR), Boreal Environment Research, V. 7 2002 Peters, G. B. Fischer, H. Münster: Micro physikal rain parameters between surface and melting layer as observed by a micro rain radar, University of Hamburg, 2003 Weng, F., L Zhao, R. Ferraro, G. Poe, X. Li, N.C. Grody: Advanced microwave sounding unit cloud and precipitation algorithms, Radio Science, Vol 38, No 4, 2003