Noname manuscript No. (will be inserted by the editor)
Alvaro Fuentes Cabrera · Dario Farina · Kim Dremstrup
Comparison of Feature Selection and Classification Methods for a Brain-Computer Interface Driven by Non-Motor Imagery
Received: date / Accepted: date
Abstract The aim of the study was to compare methods for feature extraction and classification of EEG signals for a Brain-Computer Interface (BCI) driven by auditory and spatial navigation imagery. Features were extracted using autoregressive modeling and optimized discrete wavelet transform. The features were selected with exhaustive search, from the combination of features of two and three channels, and with a discriminative measure (r2 ). Moreover, Bayesian classifier and support vector machine (SVM) with Gaussian kernel were compared. The results showed that the two classifiers provided similar classification accuracy. Conversely, the exhaustive search of the optimal combination of features from two and three channels significantly improved performance with respect to using r2 for channel selection. With features optimally extracted from three channels with optimized scaling filter in the discrete wavelet transform, the classification accuracy was on average 72.2%. Thus, the choice of features had greater impact on performance than the choice of the classifier for discrimination between the two non-motor imagery tasks investigated. The results are relevant for the choice of the translation algorithm for an on-line BCI system based on non-motor imagery. Keywords Brain-Computer Interface · Auditory Imagery · Spatial Navigation Imagery · Autoregressive Modeling · Wavelets · r2 · Bayesian Classifier · Support Vector Machine 1 Introduction A Brain-Computer Interface is a system that provides an output channel for the brain that do not depend Alvaro Fuentes Cabrera · Dario Farina · Kim Dremstrup Center for Sensory-Motor Interaction (SMI), Department of Health Science and Technology Aalborg University, Aalborg 9220, Denmark Tel.: +45-99402411 Fax: +45-99404008 E-mail:
[email protected]
on peripheral muscles and nerves [26]. The applications of BCIs range from augmentative communication and movement restoration to entertainment [27]. Based on the neurophysiologic principles used to extract control signals, BCI technologies are grouped into techniques that make use of potentials evoked by stereotyped sensory stimuli, e.g. steady state-visual evoked potentials [5] and P300 [9] and methods based on spontaneous mental activity, e.g. Event Related Desynchronization (motor imagery) [1] [18] [21], Slow Cortical Potentials [14] and non-motor imagery [8][4]. Among the latter systems, some adopt an operant conditioning approach, according to which the user trains the control by choosing the most effective mental tasks [7]. Other strategies use cognitive tasks, such as motor imagery, Auditory Imagery (AI), and Spatial Navigation Imagery (SNI). Although motor imagery tasks are effectively used in many BCI systems, they may be difficult to perform for persons who have been paralyzed or amputated for several years. An alternative method to extract control signals for operating BCI systems is the use of non-motor imagery tasks. For example, the user may associate a command to mental calculation or spatial navigation. We have previously shown that two non-motor imagery tasks can be discriminated on a single-trial basis with classification accuracy of approximately 70% in healthy subjects [4]. These results are promising for the implementation of an online two-class BCI system. However, in [4] we analyzed the results obtained by only one classifier and exhaustive search for the best features extracted from up to two channels. In this study, the same paradigm investigated in [4] and [8] is analyzed with the aim of exploring a larger set of combinations of feature extraction strategies and classification approaches. In particular, we hypothesized that increasing the number of channels for feature extraction would lead to an improvement in performance and that a support vector machine classifier would provide better results than a Bayesian classifier for high dimensionality of the feature space. The aim of the study was thus to explore the impact of the feature extraction and classifica-
2
tion method on the discrimination of non-motor imagery from single-trial EEG traces. The results provide an indication on the best choices for a translational algorithm in a non-motor imagery BCI system.
2 Methods Nineteen naive healthy subjects (11 males and 8 females, aged 21-34 years) participated in the experiment. Subjects suffering from any neurological disorder/head injury or with previous BCI training were excluded from the experiments. Subjects were asked not to consume alcohol for 24 hours prior the experiment. The EEG data were acquired using the Quick-Cap EEG positioning system, the Nu-Amp digital amplifier and the Scan 4.3 Data Acquisition Software (Neuroscan). Data were sampled at 500 Hz using a band-pass filter set to 0.1-100 Hz and a sampling resolution of 32 bit. The skin impedance was kept below 5 kOhms during the experiments. The experiment was carried out in an electromagnetic shielded room, using a laptop working on batteries, to avoid electromagnetic artifacts. Both hemispheres of Temporal and Parietal lobes were partly covered by 18 electrodes according to the modified expanded 10-20 system. The chosen locations were FT7, T3, TP7, C5, FT8, T4, TP8, C6, P5, CP3, PO3, P3, P1, P6, CP4, PO4, P4 and P2, referenced to linked ear lobes. Two EOG electrodes positioned vertically 1 cm above and below the left eye were used to record eye movements. Subjects were instructed to stay still during the EEG recordings, avoiding muscle activity. Oral and written instructions were given to them regarding imaginary tasks. Each task was performed for 10-s and repeated 15 times by subjects 7-9-10-11-12-13-14-16-1819 (150 1-s observations per task), 20 times by subjects 1-2-4-5-6-8-15-17 (200 1-s observations per task) and 25 times by subject 3 (250 1-s observations per task). The inter-trial interval was 10-s. The 10-s duration of each task was chosen in order to ensure a proper performance; since the imaginary tasks require a considerable time to be executed [4][8]. The order of the tasks was randomized and the experiment was divided into two parts, each of them with equal number of trials, with 5 min of interval between the two parts. A digital clock cued the subject before the start of each trial with a 5-s countdown. At time zero, instructions regarding which cognitive task to perform appeared on the computer screen. No feedback related to the performance of the tasks was given to the subjects.
2.1 Imaginary tasks Two non-motor imaginary tasks were performed in this experiment. The instructions were given to the subjects as follows:
– Spatial Navigation: The subject was instructed to imagine being in a familiar environment, scanning the surroundings noticing details while going from room to room and around furniture. The importance that the imagination involved examining the rooms rather than walking around them was stressed, as the latter could cause motor activity. This task was inspired by [17]. – Auditory Imagery: The subject was asked to think of a familiar tune. They were instructed to listen to it in their head, without mouthing the words or melody [14]. Well known popular melodies were presented to the subjects who chose the most familiar one. Both tasks were previously used in [8] and [4].
2.2 Data Analysis Data were analyzed in MATLAB on a Sun Fire X4600 Server running GNU/Linux Ubuntu. The server has 8x2.6 GHz Dual Core AMD Opteron 8218 CPUs and 32GB RAM. Features were extracted from 1-s EEG segments. Spectral analysis was also carried on the 1-s epochs and then the results were averaged over all epochs. The maximum entropy method was used for the calculation of AR spectra.
Autoregressive Analysis The Burg-Lattice method was used to compute the reflection coefficients (RFC) associated to an AR model of order 6. The model order was chosen based on the results obtained in [4]. In this study model orders 4, 6, 8, 10 and 13 were used. A two-way ANOVA, factors being model order and number of channels and the dependent variable being the classification results, showed that the model order did not affect the classification results. Since no statistical differences were found, we relied on the average classification results of this previous study to choose the model order. The EEG signal epochs used for feature extraction were assumed wide sense stationary after detrending of the segments [4].
Wavelet Coefficients The discrete wavelet transform (DWT) represents a signal as its projection onto a set of spaces, which are generated from translations and scaling of the mother wavelet Ψ (t) and the scaling function φ(t). These two functions are respectively related to the high pass and low pass filters, g(n) and h(n), by equations (1) and (2). For orthogonal wavelets, the coefficients of the filter g are related to the coefficients of the filter h by (3) [17], thus the
3
mother wavelet Ψ can be derived from the coefficients of h. φ(t) =
√ X 2 h[n]φ(t − n)
(1)
√ X 2 g[n]φ(t − n)
(2)
n
Ψ (t) =
n
g(n) = (−1)(1−n) h(1 − n)
(3)
To select the optimal mother wavelet for class discrimination, the filter h was parameterized as described in previous studies [4][10]. The number of parameters was 4 and 6 and the levels of decomposition was 8. The coefficients from each decomposition level are partly localized in time and scale. However, localization in time may be a problem for comparison due to the lack of time alignment of the signals. In order to make the representation space insensitive to time alignment the features for classification were extracted using the marginal of each detail space [10]. Marginals were calculated as follows: |dx (j, k)| mx (j) = PJ PN/2j −1 |dx (j, k)| j=1 k=0
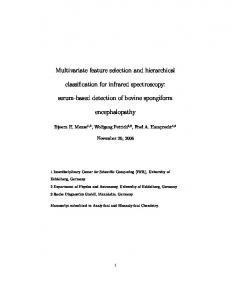
Fig. 1 Flow diagram of the signal processing methods applied to the EEG signals. In the first stage, features are extracted from 1-s EEG segments, using AR reflection coefficients and two Optimized Wavelets modules, whose output are marginals from the wavelet spaces. Each of these DWT modules is linked to an adaptive module which changes the parameters α and β (6 taps) and α (4 taps), to generate several filters h. The next stage is a feature selection module, which applies two exhaustive search approaches, which are linked to an adaptive module which switches between all possible combinations of 2 and 3 channels, and r 2 . The last stage is a classification module, based on two classification methods: Bayesian Classifier and Support Vector Machine.
Support Vector Machine j = 1, ..., J
(4)
where J = log2 N is the deepest level of decomposition (in this study 8), N is the number of samples of the signal (in this study the signal was zero padded to 256) and dx (j, k) = hx(t), Ψ (t)i, where j is related to scale or frequency and k to translation or time, as described in Ψj,k = 2−j/2 Ψ (2−j t − k). 2.3 Classification The classification results were evaluated with the classit fication accuracy, defined as A = ∗ 100, where t is the n number of 1-s EEG segments correctly classified, and n is the total number of 1-s EEG segments.
Bayesian Classifier (BC) The classifier is represented as a set of two discriminant functions: g1 (x) and g2 (x). The feature vector x is assigned to class ω1 if g1 (x) > g2 (x). Assuming that the covariance matrices of the features, Σi , are different between classes, the discriminant functions are defined as 1 gi (x) = xti Wi x + wit x + wi0 , where Wi = − Σi−1 , wi = 2 1 t −1 1 −1 Σi µi and wi0 = µi Σi µi − ln|Σi |, where µi is the 2 2 mean of x for class ωi .
For a two-classes problem (ω+1 and ω−1 ), a classification rule corresponds to a discriminant function f , which for the training set verifies the following: f (Mx ) negative (positive) if Mx belongs to ω+1 (ω−1 ). A more robust decision rule includes a margin so that the discriminant function verifies: f (Mx ) < −1(> +1) if Mx belongs to ω+1 (ω−1 ). The training set is used to estimate f from the pairs (Mx , δ). Since this problem deals with a functional space of dimension infinity and is ill-posed, a penalization term on the norm of the function is introduced, leading to the following functional minimization problem: X f = arg minf ∈H min[δ − f (Mx ), 0] + λkf k2H (5) Mx
where λ is the regularization parameter of the discriminant function to avoid an over-learning phenomenon. Moreover, in order to include non-linear classification functions, the data are transformed by a Mercer reproducing kernel K [6]. A common choice for K is a Gaussian kernel defined by its width σ. In this new space, the solution of the optimization problem in Eq. (5) has a closed form written as a function of a subset of the training elements (support vectors), of the kernel width σ, and of the regularization parameter λ. λ and σ are optimized in the learning process. SVM has been previously used in other BCI system, like [4], [11], [12], [23] and [13]. The two classification methods presented in this study correspond to a linear (BC) and a non-linear (SVM) ap-
4
proach to classification. These two classifiers are only a small part of the wide range of methods used in BCI technology. For a detailed review of classification methods for BCI systems refer to [30]. 2.4 Supervised Optimization The misclassification rate was estimated using a 5-fold cross-validation technique. In a first step, two optimization procedures were performed to find the best feature vector for each feature space produced by the mother wavelet set and the AR analysis on a single subject basis. The same procedures were later applied to the set of feature vectors to find the optimal mother wavelet. These two methods are described as follows: – r2 : The r2 values give a measure of the separability of two classes. In this study the r2 values represent the correlation between the features and the desired imaginary task. It has been shown that the r2 value of the EEG feature that controls an online application is a good predictor of system performance [24] [19] and [16]. For detailed information about r2 see [28]. The r2 algorithm was applied to the feature space (18 channels and all marginals/coefficients from each channel) to find the N features with highest r2 values, with N=1,2,3,4,7,14,21. Different numbers of features have been selected in order to find out how the increment of the number of features selected with r2 influence the classification results. To obtain the optimal feature vector Of v of a feature space F (ch, f, w) of dimensions channelsXf eaturesXf ilter, the r2 matrix R(ch, f, w) was sorted from highest to lowest absolute values for each filter, resulting in the matrix R′ (r, w), of dimensions (channels∗f eatures)Xf ilter. Then the Of v of length N was defined as: Of v = max(V (w))
(6)
with V (w) =
PN
r=1
|R′ (r, w)| N
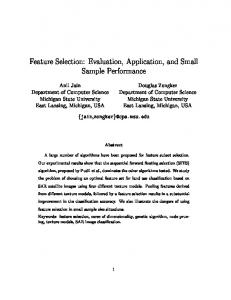
Fig. 3 R2 values for the marginals of the wavelet spaces (approximation space not included) corresponding to a representative subject. The frequency bands for each wavelet space are: 1 (0.8-1.7 Hz), 2 (1.7-3.9 Hz), 3 (3.9-7.8 Hz) 4 (7.8-15.6 Hz), 5 (15.6-31.2 Hz), 6 (31.2-62.5 Hz) and 7 (62.5-125 Hz).
of three channels were classified using the features from the three channels (816 classification procedures). The optimal mother wavelet was then obtained by selecting the feature vector with the highest classification rate for the training set among all feature spaces. In addition to the selection methods described above classification results are also provided for the case of selection of the entire feature space (all channels). The flow diagram in Figure 1 depicts the four stages of the acquisition and processing of the EEG signals that have been described in the preceding sections. The stages in this figure, which are separated from each other by vertical dotted lines, show the different approaches compared for feature extraction, feature selection and classification.
(7)
with N=1,2,3,4,7,14,21. Eq. (7) selects the optimal feature vector for each mother wavelet and Eq. (6) selects the optimal mother wavelet. – Exhaustive search: This exhaustive search routine produces all combination of two or three channels from the feature space matrix in the training set. Each feature space produces several feature vectors, thus, several classification procedures. In the exhaustive search of a two-channel combination (ES2) strategy, all combinations of two channels were classified using the features from both channels (153 classification procedures). In the exhaustive search of a threechannel combination (ES3) strategy, all combination
3 Results 3.1 EEG Signals Characteristics The time averages over all 10-s trials showed no evoked potentials for either of the two imaginary tasks. The EEG amplitudes were canceled after the average, resulting in averaged amplitudes corresponding to ≈ 5% of the non-averaged EEG traces. The spectral analysis showed activity mainly in α and β bands as depicted in Fig. 2. Eleven out of 19 subjects elicited EEG activity centered at 10 Hz for both imaginary tasks, as seen in the upper panel of Fig. 2, while 8 subjects had a primary peak around 24 Hz (Fig. 2 C and
5
Fig. 2 FFT power spectra of four representative subjects as a function of amplitude averaged over 200 1-s EEG epochs. The solid line shows the averaged EEG spectra when the subject performed spatial navigation imagery, the dotted line when the subject performed auditory imagery. The two spectra on the upper panels are representative of 11 of the subjects, and it can be seen that there is a high activity in the α band. On the other hand the two spectra on the lower panels are representative of 8 subjects, with a primary peak in the β band, and some subjects, e.g. subject 2 on the right-bottom figure, also elicited a secondary peak in the α band.
D), with some subjects showing also a secondary peak around 10 Hz (Fig. 2D). 3.2 Classification Results Table 1 shows the classification results obtained using AR, OW4 (121 filters) and OW6 (126 filters), based on the features selected using ES2 and OW6 (3969 filters) based on the entire feature space. Table 2 shows the classification results obtained using AR and OW6 (3969 filters), based on features selected using r2 . The results from both tables were obtained using BC and SVM. Table 1 and Table 2 indicate that on average the SVM performed slightly worse than the BC, for both low and high dimensions of the feature vector (feature vectors with size N=1,2,3,4,7,14,21 and 126 have been classified using SVM and BC). This difference, of ≈ 1%, was not significant. Due to the higher computational time required by SVM in the training phase, the BC appears a more viable option for classification. On the other hand, the classification accuracies obtained with the features extracted using AR and OW4 and selected using r2 were lower than those obtained using OW6 and ES2, respectively. For these reasons the results described in the remaining parts of the paper will be those obtained using OW6, ES2 and ES3 and BC. The classification accuracies obtained using features extracted with OW6 (3969 filters), selected using ES2 and ES3 and classified with BC are shown in Table 3. 3.3 Channel in the Optimal Feature Vectors The optimal vectors obtained using r2 contained mainly features from wavelet spaces 3 (3.9-7.8 Hz), 4 (7.8-15.6
Table 2 Average classification accuracies over all nineteen subjects. These results were obtained using feature vectors selected using r 2 (see 2.4). The classification accuracy percentages are presented for feature vectors of length N, with N=1,2,3,4,7,14,21.
Hz), and 5 (15.6-31.2 Hz). Fig. 3 shows the r2 values for the marginals of the wavelet spaces for a representative subject (subject 10). In this case the highest r2 values are concentrated in the wavelet spaces 3 and 4 (3.9-15.6 Hz). In order to investigate spatial patterns, the channels were assigned to four areas, denoted as left temporal area (LT) (FT7, T3, TP7, C5), right temporal area (RT) (FT8, T4, TP8, C6), left parietal area (LP) (CP3, P5, P3, P1, PO3), and right parietal area (RP) (CP4, P6, P4, P2, PO4). Using this notation, Table 4 shows the areas involved in the optimal discrimination of AI and SNI using
6
Table 1 Classification accuracies obtained using the feature vectors (a) selected with exhaustive search in a two-channels basis (the number of generated wavelets was 121 for OW4 and 126 for OW6), and (b) entire feature space (the number of wavelets generated was 3969 for OW6).
OW6, ES3 and BC.
the percentages of true positives, which are defined as: AIi SN Ii ; T Pai (i) = (8) 2 2 and the percentages of false positives, which are defined as:
T Psni (i) =
3.4 Classification Accuracy within each Class The classification accuracies for each class are shown in Table 5. The 2nd and 3rd columns, labeled as SNI and AI, display percentages which correspond to the classification accuracies within each class. The percentages shown in 4th column, labeled as T otal, are the average of the values in the 2nd and 3rd columns, and correspond to the total classification accuracy. These results correspond to the best classification accuracies, which were obtained using OW6 (3969 filters), ES3 and BC. Each subject was presented with the same number of trials for each class, thus, from Table 5 is possible to deduce
F Psni (i) = 50−T P(sni)(i); F Pai (i) = 50−T P(ai)(i) (9) where TP=True Positive percentage FP=False Positive percentage, the sub-indexes sni and ai denote spatial navigation imagery and auditory imagery, i=1:19 is the subjects index, SN Ii is the value in the SNI column of Table 5 for subject number i, and AIi is the value in the AI column of Table 5 for subject number i. 4 Discussion Methods for feature extraction and classification have been compared for the discrimination of non-motor im-
7
Table 3 Classification accuracies obtained using features extracted with OW6 (126 and 3969 filters), selected using ES2 and ES3, and classified with Bayesian classifier. Each column containing the classification accuracy is labeled with the number of wavelets filters used in the feature extraction stage.
agery tasks from EEG signals. Because SVM performed similarly to BC, the choice of the classifier was not the main determinant for accuracy. Conversely, the use of more than one channel increased the classification accuracy. However, it was not possible to select the best channels with r2 and an exhaustive search of the best combination was necessary. The lack of a significant difference between performance of SVM and BC (BC performed slightly better than SVM), even when the feature dimensionality was large, indicates that the features of the two classes (AI and SNI) were linearly separated. Better performances of probabilistic classifiers, like BC, over SVM have been previously reported in [29], where both, Gaussian Processes and SVM were applied to a two-classes EEG data set, recorded using a synchronized BCI system based on motor imagery. These results seem to contradict [30], study that compares several classifi-
Table 4 Scalp areas containing the EEG channels that formed the optimal feature vector selected using OW6 (3969 filters), ES3 and Bayesian classifier. LT: left temporal area (FT7,T3,TP7,C5) ; RT: right temporal area (FT8,T4,TP8,C6); LP: left parietal area (CP3,P5,P3,P1,PO3); RP: right parietal area (CP4,P6,P4,P2,PO4)
cation methods for BCI systems, among them BC and SVM. This study suggest that SVM is particularly efficient for synchronized BCI system. The two classifiers assessed in this study require similar computational time when used on the test set (and thus when used during the normal operation of the BCI). However, the training phase requires more time in case of SVM because of the need of optimizing the kernel and the regularization parameter. Thus, a BC approach to classification of these two non-imagery tasks seem appropriate. A one-way ANOVA performed on the results in Table 1 (ES2 using BC) showed no statistical differences among the classification results obtained using AR, OW4 and OW6 (p=0.08). However, the results in Table 1 show that 17 out of 19 subjects obtain better performances using OW4 than using AR, and 16 subjects perform better using OW6 than using AR. Table 2 shows that OW6 performed better than AR for small number of features selected using r2 (N=1-4), but features extracted using AR provided better classification results when the num-
8
Table 5 Classification accuracies obtained using features extracted with OW6 (3969 filters), selected using ES3, and classified with Bayesian classifier. The values in columns SN and AI correspond to the percentage of 1-s trials correctly classified within each class. The values in column T otal are the average of the values in columns SN and AI, and correspond to total classification accuracy.
ber of features selected with r2 is higher (N=7, 14 and 21). The results in Tables 1 and 2 show that OW6 and OW4 outperformed AR for both classification methods. As previously observed by [10], the classification results depend greatly on the wavelet filter (mother wavelet). The results shown in Tables 1 and 3 correspond, for each subject, to the highest classification accuracy among the 3969 mother wavelets (the results ranged, e.g. for subject 10, from 48% to 91.5 %) used for feature extraction. Regarding the number of wavelet filters used in the optimization procedure, the classification accuracy improved by ≈ 3% by rising the number of filters from 126 to 3969. This increase in the number of filters, however, may make the optimal wavelet to be very specific and maybe suboptimal in other sessions, when the subject is under different emotional or physical states. In this study, we also investigated the impact of number of channels used for feature extraction. Exhaustive search of combinations of two or three channels, using
features extracted with OW6 (3969 filters) and classified with BC, provided significant improvement in performance over the use of one channel , as it can be seen comparing the results of Table 3 with those obtained in [4], where single channel classification showed an average classification accuracy of 66.8% . On the other hand, the difference in classification accuracy between ES2 and ES3 was very small in some subjects. Table 3 shows an average improvement of ≈ 2% of ES3 over ES2. The inclusion of one more channel seems to have a different influence over the classification results of different subjects. While most of the subjects showed a difference in classification accuracy of ≈ ±2% between ES2 and ES3, subject 8 showed a substantial improvement of the classification accuracy, from 67% with ES2 to 91.5% using ES3 and subject 10 showed improvement of 5% by using ES3 over ES2. The exhaustive search is computationally demanding, ES2 and ES3 required 153 and 816 classification procedures per each mother wavelet respectively, however it is limited to the training phase and thus it does not affect the speed of the BCI system during user interaction. To reduce the computational time needed for training, a strategy for a-priori selection of the channels based on a linear discrimination index (r2 ) was compared with exhaustive search. However, the results showed (Tables 1-2) that this strategy is not as effective as ES. Most features selected with r2 are marginals of wavelet spaces 3, 4 and 5 (3.9-31.2 Hz). These optimal features correspond to the frequency range that contain the main peaks elicited by AI and SNI, as described in 3.1. The poor results obtained using the features selected using r2 , which correspond to the highest spectral amplitudes, suggest that the dominant frequencies in the EEG activity elicited by AI and SNI are not sufficiently discriminant for an optimal classification result, and that other features corresponding to lower spectral amplitudes contain relevant information that improves the performance of the classifier. Some of the alternative and more advanced methods to those presented in this manuscript for feature selection are SEPCOR [3], Distinction Sensitive Learning Vector Quantizer (DSLVQ) [22][20], Recursive Channel Elimination (RCE) [15][25], Zero Norm Optimization [15] and Independent Component Analysis (ICA) [16]. The optimal feature vector selected using OW6, ES3 and BC contained features from three channels. It was not possible to identify a set of three channels which were part of the optimal feature vector for more than one subject. For this reason the EEG channel were assigned to four areas; left temporal, right temporal, left parietal and right parietal. The optimal feature vectors were distributed as follows: – In 16 subjects the three optimal channels corresponded to left and right hemispheres; in 3 of these subjects
9
–
–
–
–
–
the optimal channels were exclusively in the left hemisphere whereas in none of the subjects the optimal channels belonged exclusively to the right hemisphere. In 15 subjects the optimal three channels corresponded to the temporal and parietal areas; in 2 of the subjects the optimal channels were exclusively in the temporal area and in 2 subjects the optional channels were exclusively in the parietal area. In 15 subjects at least one of the three optimal channels corresponded to the left temporal area; in 5 of these subjects, 2 of the optimal channels were in this area. In 13 subjects at least one of the three optimal channels corresponded to the left parietal area; in 3 of these subjects, 2 of the optimal channels were in this area. In 11 subjects at least one of the three optimal channels corresponded to the right temporal area; in 2 of these subjects, 2 of the optimal channels were in this area. In 7 subjects at least one of the three optimal channels corresponded to the right parietal area; in 3 of these subjects, 2 of the optimal channels were in this area.
The spatial location of optimal channels revealed that the discriminative information was located in both hemispheres and in both temporal and parietal areas. Moreover, the left temporal area seems to have a substantial impact in the discrimination since in 15 out of the 19 subjects, at least one optimal channel corresponded to this area. These results are in accordance with a previous study [4]. The information gathered in this study and in [4] suggests that the left temporal area contain information that is highly discriminative for non-verbal auditory imagery and spatial navigation imagery. In [4] we showed that the use of two optimal electrodes chosen among a total of 18, significantly improves the classification accuracy compared to the fixed T4-P4 used in [8]. The average classification accuracies obtained using the T4-P4 electrodes was 64.4%, while the optimal two electrodes chosen using ES2 showed a classification accuracy of 70 %. The results of the present study show that the classification accuracies obtained using OW6, ES3 and BC are higher than those obtained in [4] using OW6, T4-P4 and BC, which indicate that multi-channel EEG recording is necessary for the optimization of the feature selection and classification procedures, which is in accordance with [4]. Moreover, the results of [4] and the present study indicate that in a practical BCI application based on the two investigated tasks, the optimal channels should be selected for each individual during a training phase, since the optimal channels selected using ES2 and ES3 differed among subjects. Curran et al. [8] obtained a classification accuracy of 74 % for a BCI based on SN and AI. This percentage correspond to the average over 10 subjects. The best results
shown in the present study indicate an average of 72.2 % of classification accuracy over 19 subjects. It is difficult to compare the current study with [8] since results on individual subjects were not presented in [8] and different signal processing techniques were used in the two studies. In conclusion, this study indicates that a feature strategy based on optimal DWT and optimal selection of three channels and a linear classification approach provide the best performance among the tested approaches, in single-trial classification of two non-motor imagery tasks. This information is relevant for the choice of the translation algorithm for an on-line BCI system based on non-motor imagery.
Acknowledgements The authors would like to thank M.Sc. Magnus Svavarsson for his valuable help running the Matlab algorithms in the Linux multi-processor server.
References 1. Babiloni, F., Cincotti, F., Lazzarini, L., Millan, J., Mourino, J., Varsta, M., Heikkonen, J., Bianchi, L., Marciani, M.: Linear classification of low-resolution EEG patterns produced by imagined hand movements. IEEE TRANSACTIONS ON REHABILITATION ENGINEERING 8(2), 186–188 (2000) 2. Birch, G., Bozorgzadeh, Z., Mason, S.: Initial oh-line evaluations of the LF-ASD brain-computer interface with able-bodied and spinal-cord subjects using imagined voluntary motor potentials. IEEE TRANSACTIONS ON NEURAL SYSTEMS AND REHABILITATION ENGINEERING 10(4), 219–224 (2002). DOI 10.1109/TNSRE.2002.806839 3. Cabrera, A.F., Lund, M.E., Christensen, D.M., Nielsen, T.N., Skov-Madsen, G., Nielsen, K.D.: Brain computer interface based on non-motor imagery. Proceedings of the 3rd International Brain-Computer Interface Workshop and Training Course, Verlag der Technischen Universitat Graz 68–69, (2006) 4. Cabrera, A., Nielsen, K.: Auditory and Spatial Navigation Imagery in Brain Computer Interface using Optimized Wavelets. Journal of Neuroscience Methods 174, 135–146 (2008) 5. Cheng, M., Gao, X., Gao, S., Xu, D.: Design and implementation of a brain-computer interface with high transfer rates. IEEE TRANSACTIONS ON BIOMEDICAL ENGINEERING 49(10), 1181–1186 (2002). DOI 10.1109/TBME.2002.803536 6. Cristianini, N., Shawe-Tailor, J.: An introduction to support vector machines and other kernel-based learning methods. Cambridge University Press (2000) 7. Curran, E., Stokes, M.: Learning to control brain activity: A review of the production and control of EEG components for driving brain-computer interface (BCI) systems. BRAIN AND COGNITION 51(3), 326–336 (2003). DOI 10.1016/0278-2626(03)00036-8 8. Curran, E., Sykacek, P., Stokes, M., Roberts, S., Penny, W., Johnsrude, I., Owen, A.: Cognitive tasks for driving a brain-computer interfacing system: A pilot study. IEEE TRANSACTIONS ON NEURAL SYSTEMS AND REHABILITATION ENGINEERING 12(1), 48–54 (2004). DOI 10.1109/TNSRE.2003.821372
10
9. Donchin, E., Spencer, K., Wijesinghe, R.: The mental prosthesis: Assessing the speed of a P300-based braincomputer interface. IEEE TRANSACTIONS ON REHABILITATION ENGINEERING 8(2), 174–179 (2000) 10. Farina, D., Nascimento, O., Lucas, M., Doncarli, C.: Optimization of wavelets for classification of movementrelated cortical potentials generated by variation of forcerelated parameters. Journal of Neuroscience Methods 162, 357–363 (2007) 11. Blankertz, B. ,Curio, G. , Muller, K. R.: Classifying single trial eeg: Towards brain computer interfacing. Advances in Neural Information Processing Systems (NIPS 01) 14, 157–164 (2002) 12. Garrett, D., Peterson, D. A., Anderson, C. W., Thaut, M. H.: Comparison of linear, nonlinear, and feature selection methods for eeg signal classifcation. IEEE Transactions on Neural System and Rehabilitation Engineering 11, 141–144 (2003) 13. Lal, TN., Schroder, M., Hinterberger, T., Weston, J., Bogdan, M., Birbaumer, N., Scholkopf, B.: single trialdiscrimination of type and speed of wrist movements from eeg recordings. CLINICAL NEUROPHYSIOLOGY 120(8), 1596–1600 (2009) 14. Hinterberger, T., Kubler, A., Kaiser, J., Neumann, N., Birbaumer, N.: A brain-computer interface (BCI) for the locked-in: comparison of different EEG classifications for the thought translation device. CLINICAL NEUROPHYSIOLOGY 114(3), 416–425 (2003). DOI 10.1016/S1388-2457(02)00411-X 15. Gu, Y., Dremstrup, K., Farina, D.: Support vector channel selection in BCI. IEEE TRANSACTIONS ON BIOMEDICAL ENGINEERING 51(6), 1003–1010 (2004) 16. Lou, B., Hong, B.,Gao, X., Shangkai, G.: Bipolar electrode selection for a motor imagery based brain-computer interface. Journal of Neural Engineering 5(3), 342–349 (2008) 17. Mallat, S.G.: A Theory for Multiresolution Signal Decomposition: The Wavelet Representation. IEEE Transactions on Pattern Analysis and Machine Intelligence 11(7), 674–693 (1989) 18. McFarland, D., McCane, L., David, S., Wolpaw, J.: Spatial filter selection for EEG-based communication. ELECTROENCEPHALOGRAPHY AND CLINICAL NEUROPHYSIOLOGY 103(3), 386–394 (1997) 19. McFarland, D., Sarnacki, W., Vaughan, T., Wolpaw, J.: Brain-computer interface (BCI) operation: signal and noise during early training sessions. CLINICAL NEUROPHYSIOLOGY 116(1), 56–62 (2005) 20. Pfurtscheller, G., Flotzinger, D., Pregenzer, M., Wolpaw, J.R., McFarland, D.: OEEG-based brain computer interface (BCI). Search for optimal electrode positions and frequency components. Med Prog Technol 21(3), 111– 121 (1995) 21. Pfurtscheller, G., Kalcher, J., Neuper, C., Flotzinger, D., Pregenzer, M.: On-line EEG classification during externally-paced hand movements using a neural network-based classifier. ELECTROENCEPHALOGRAPHY AND CLINICAL NEUROPHYSIOLOGY 99(5), 416–425 (1996) 22. Pregenzer, M., Pfurtscheller, G., Flotzinger, D.: Selection of electrode positions for an EEG-based brain computer interface (BCI). Biomed Tech 39(10), 264–269 (1994) 23. Rakotomamonjy, A., Guigue, V., Mallet, G., Alvarado, V.: Ensemble of svms for improving brain computer interface p300 speller performances. International Conference on Artifcial Neural Networks (2005) 24. Sheikh, H., McFarland, D., Sarnacki, W., Wolpaw, J.: Electroencephalographic(EEG)-based communication: EEG control versus system performance in humans. NEUROSCIENCE LETTERS 345(2), 89–92 (2003)
25. Schrder, M., Lal, T.N., Hinterberger, T., Bogdan, M., Hill, N.J., Birbaumer, N., Rosenstiel, W., Schlkopf, B.: Robust EEG Channel Selection across Subjects for Brain-Computer Interfaces. EURASIP Journal on Applied Signal Processing 2005(19), 3103–3112 (2005) 26. Wolpaw, J., Birbaumer, N., Heetderks, W., McFarland, D., Peckham, P., Schalk, G., Donchin, E., Quatrano, L., Robinson, C., Vaughan, T.: Brain-computer interface technology: A review of the first international meeting. IEEE TRANSACTIONS ON REHABILITATION ENGINEERING 8(2), 164–173 (2000) 27. Wolpaw, J., McFarland, D., Neat, G., Forneris, C.: An EEG-Based Brain-Computer Interface For Cursor Control. ELECTROENCEPHALOGRAPHY AND CLINICAL NEUROPHYSIOLOGY 78(3), 252–259 (1991) 28. Wonnacott, T., Wonnacott, R.: Introductory Statistics. Wiley, New York (1990) 29. Zhong, M., Lotte, F., Girolami, M., Lecuyer, A.: Classifying EEG for Brain Computer Interfaces Using Gaussian Processes. Pattern Recognition Letters 29(3), 354–359 (2008) 30. Lotte, F., Congedo, M., Lecuyer, A., Lamarche, F., Arnaldi, B.: A review of Classification Algorithms for EEGbased Brain Computer Interfaces. Journal of Neural Eng. 4(2), R1–R13 (2007)