temple runway black sea beach smoke cactus hills shore branch house display market sculpture city desert head closeup walls statues horizon recall precision.
Comparison of Feature Sets using Multimedia Translation 2 ¨ ¨ Pınar Duygulu1 , Ozge Can Ozcanlı , and Norman Papernick1 1
2
School of Computer Science, Carnegie Mellon University, Informedia Project, Pittsburgh, PA, USA {pinar, norm}@cs.cmu.edu Dept. of Computer Engineering, Middle East Technical University, Ankara, Turkey {ozge}@ceng.metu.edu.tr
Abstract. Feature selection is very important for many computer vision applications. However, it is hard to find a good measure for the comparison. In this study, feature sets are compared using the translation model of object recognition which is motivated by the availablity of large annotated data sets. Image regions are linked to words using a model which is inspired by machine translation. Word prediction performance is used to evaluate large numbers of images.
1
Introduction
Due to the developing technology, there are many available sources where images and text occur together: there is a huge amount of data on the web, where images occur with a surrounding text; with OCR technology it is possible to extract the text from images; and above all, almost all the images have captions which can be used as annotations. Also, there are several large image collections (e.g. Corel data set, most museum image collections,the web archive) where each image is manually annotated with some descriptive text. Using text and images together helps disambiguation in image analysis and also makes several interesting applications possible, including better clustering, search, auto-annotation and auto-illustration [4, 5, 9]. In the annotated image collections, although it is known that the annotation words are associated with the image, the correspondence between the words and the image regions are unknown. There are some methods that are proposed to solve the correspondence problem [4, 12, 14]. We consider the problem of finding such correspondences as the translation of image regions to words, similar to the translation of text from one language to another [9, 10]. As in many problems, feature selection plays an important role in translating image regions to words. In this study, we investigate the effect of feature sets on the performance of linking image regions to words. Two different feature sets are compared. One is a set of descriptors chosen from MPEG-7 feature extraction schemes, since it is mostly used for content based image retrieval tasks; and the other one is a set obtained by combining most of the descriptive and helpful features chosen heuristically for their adequacy to the task.
2
¨ Ozcanlı, ¨ P. Duygulu, O. N. Papernick
In Section 2, the idea of translating image regions to words will be explained. The features used in the experiments will be described in Section 3. Section 4 will present the measurement strategies for comparing the performences. Then, in Section 5 experimental results will be shown. Section 6 will discuss the results.
2
Multimedia translation
Learning a lexicon from data is a standard problem in machine translation literature [7, 13]. Typically, lexicons are learned from a type of data set known as an aligned bitext. Assuming an unknown one-to-one correspondence between words, coming up with a joint probability distribution linking words in two languages is a missing data problem [7] and can be dealt by application of the Expectation Maximization (EM) algorithm [8]. There is an analogy between learning a lexicon for machine translation and learning a correspondence model for associating words with image regions. Data sets consisting of annotated images are similar to aligned bitexts. There is a set of images, consisting of a number of regions and a set of associated words. We vector-quantize the set of features representing an image region. Each region then gets a single label (blob token). The problem is then to construct a probability table that links the blob tokens with word tokens. This is solved using EM which iterates between the two steps: (i) use an estimate of the probability table to predict correspondences; (ii)then use the correspondences to refine the estimate of the probability table. Once learned, the correspondences are used to predict words corresponding to particular image regions (region naming), or words associated with whole images (auto-annotation) [10, 4]. Region naming is a model of object recognition, and auto-annotation may help to organize and access large collections of images. The details of the approach can be found in [9, 10].
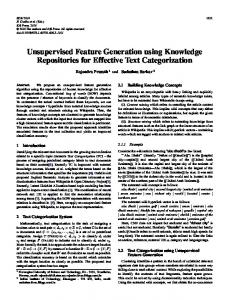
tiger cat grass Fig. 1. In the annotated image collections (e.g., Corel stock photographs), each image is annotated with some descriptive text. Although it is known that the annotation words are associated with the image, the correspondence between the words and the image regions are unknown. With the proposed approach, image regions are linked to words with a method inspired by machine translation. Left: an example image with annotated keywords, right: the result where image regions are linked with words.
Comparison of Feature Sets using Multimedia Translation
3 3.1
3
Feature sets compared Feature set 1
The first set is a combination of some descriptive and helpful features selected from the features used in many applications: size (1 feature);position (2 features);color (6 features); and texture (12 features). Therefore, a feature vector of size 21 is formed to represent each region. Size is represented by the portion of the image covered by the region. Position is represented by the coordinates (x, y) of the region’s center of gravity in relation to the image dimensions. Color is represented using the mean and variance of the RGB color space. Texture is represented by using the mean of twelve oriented energy filters aligned in 30 degree increments. 3.2
Feature set 2 - MPEG-7 feature extraction schemes
MPEG-7 [3] is a world-wide standardization attempt in representing visual content. It provides many descriptors to extract various features from multimedia data and it aims efficient, configurable storage and access tools. In this study, we chose the following descriptors from the visual content description set of MPEG-7: edge histogram (80 features); color layout (12 features); dominant color (4 features); region shape (35 features); and scalable color (64 features) descriptors. As a result, a feature vector of size 195 is formed to represent each region. The dominant color descriptor is the RGB values and the percentage of the dominant colors in each region. The scalable color descriptor is a color histogram in the HSV color space, which is encoded by a Haar transform. The number of coefficients is chosen to be 64 in this study. Color layout descriptor specifies the spatial distribution of colors in the Y, Cr, Cb color space and all 12 features of it are put into the feature vector. The Region shape descriptor utilizes a set of ART (Angular Radial Transform) coefficients which is a 2D complex transform defined on a unit disk in polar coordinates. Lastly, edge histogram descriptor represents the spatial distribution of four directional edges and one non-directional edge, by encoding the histogram in 80 bins. The feature extraction schemes of each descriptor are explained in detail in [11].
4
Measuring the performance
Correspondence performance can be measured by visually inspecting the images. However, it requires human judgment and this form of manual evaluation is not practical for large number of images. An alternative way is to compute the annotation performance. Using annotation performance, it is not known whether the word is predicted for the correct blob. However, it is an automatic process allowing the evaluation of large number of images. Furthermore, if the annotations are incorrect, the correspondences will not be correct either. Therefore, annotation performance is a plausible proxy.
4
¨ Ozcanlı, ¨ P. Duygulu, O. N. Papernick
Annotation performance is measured by comparing the predicted words with the words that are actually present as an annotation keyword in the image. Two measures are used to compare the annotation performance over all of the images. The first measure is the Kullback Liebler divergence between the target distribution and the predicted distribution. Since the target distribution is not known, to compute KL divergence it is assumed that in the target distribution the actual words are predicted uniformly, and all the other words are not predicted. The second measure is the word prediction measure which is defined as the ratio of the number of words predicted correctly (r) to the number of actual keywords (n). For example, if there are three keywords, sky, water, and sun, then n=3, and we allow the model to predict 3 words for that image. The range of this score is from 0 to 1. The results are also compared as a function of words. For each word in the vocabulary, recall and precision is computed for comparison. Recall is defined as the number of correct predictions over number of actual occurence of the word in the data, and precision is defined as the number of correct predictions over all predictions.
5
Experimental Results
In this study, the Corel data set, [1] which is a very large collection of stock photographs, is used. It consists of a diverse set of real scene images, and each image is annotated with a few keywords. In this study, we use 3175 images for training and 1081 images for testing. Each image is segmented using Normalized Cuts segmentation [15]. Then, the features of each region are extracted using both sets. In order to map the feature vectors onto a finite number of blob tokens, first the feature vectors of the regions obtained from all the images in the training set are shifted and scaled to have zero mean and unit variance. Then, these vectors are clustered using the k-means algorithm, with the total number of clusters k = 500. The translation probability table is initialized with the co-occurrences of words and blobs. Then EM algorithm is applied to learn the final translation table. For region naming, the word with the highest probability is chosen for each blob. Figure 2 shows some example results from the test set. As explained in Section 4, it is very hard to measure the correspondence performance on a large set. Visually inspecting every image and counting the number of correct matches is not feasible. Also, it is not easy to create a ground truth set, since one region may correspond to many words (e.g., both cat and tiger) or due to segmentation errors, it may not be possible to label a region with a single word. Therefore, we use annotation performance as a proxy. To annotate an image, the word posteriors for all the blobs in the image are merged into one, and the first n words with the highest probability (where n is the number of actual keywords) are predicted. The predicted words are
Comparison of Feature Sets using Multimedia Translation
5
Fig. 2. Predicted words for some example images. Top: using Feature set 1, bottom using Feature set 2. Table 1. Comparison of annotation measures for two different feature sets. Left: feature set 1, right: feature set 2. The results are compared on training and test sets using Kullback Liebler divergence between the target distribution and the predicted distribution (KL) and using the word prediction measure (PR). For KL smaller numbers are better, for PR larger numbers are better. Feature set 1 training test PR 0.3802 0.2719 KL 2.7488 4.6267
Feature set 2 training test 0.3679 0.2663 2.7934 4.6529
compared with the actual keywords to measure the performance of the system as explained in Section 4. Table 2 shows the word prediction measure and KL divergence between the target distribution and predicted distribution on training and test sets for both feature sets. Results show that Feature set 1 have better annotation performance than Feature set 2. Figure 3 compares the feature sets using recall and precision values on training and test sets. A can be seen from the figure Feature set 1 predicts more words with higher recall and/or precision values. We also experiment with the effect of each individual feature. Table 2 compares the features using prediction measure and KL divergence and Figure 4 uses recall and precision values for comparison. The results show that energy filters give the best results. Although MPEG-7 uses more complicated color features, mean and variance of RGB values give the best results among the color features.
6
Discussion and future directions
Feature set selection is very important for many computer vision applications. However, it is hard to find a good measure for the comparison. In this study, feature sets are compared using the translation model of object recognition. This approach allows us to evaluate large number of images.
¨ Ozcanlı, ¨ P. Duygulu, O. N. Papernick
6
headherd
1
branches
0.9 close−up crystal
0.8
0.8
0.7
sun leaves walls market smoke black saguaro gardens vegetables birds plants forest clouds stone nest flowers pillars windows manejet street food waves snow ocean fungus plane mushrooms boats mountain templecoast cougar grass lion elephants cat people wolf buildings city sea columns reefs sunset fish cactus ground icebears woman beachflight shadows desert sculpture gun hills rock sand helicopter trunk closeup branch runway field house statues light shore hunter display horizon
0.5
0.4
0.3
0.2
0.1
0
0.1
0.2
0.3
close−up texture
0.6
0.4
0.5 recall
0.6
0.7
precision
precision
crystal
0.7 texture pattern
background polar textile car coral
0.6
0
sculpture
1
0.9
pattern cactus polar
0.5
mane
sky water
0.4
plane plants
tree
0.1
0
1
0
0.1
(a) Feature set 1 - training
0.3
0.4
0.5 recall
0.6
0.7
0.8
0.9
1
0.8
0.9
1
0.9
0.8
0.8 close−up crystal
shadows
texture pattern
pillars
background restaurant coral sea
vegetables sand car sculpture saguaro reefs oceanstone textile gardens sun lion clouds flowers food display flight street woman statues ice jet forest plants fish sunset fungus snow buildings leaves mane reflection waves formation polar mushrooms plane cat helicopter ground beach windows boats people cougar walls coast elephants mountain shop horizon grass house head black hunter trunk rock zebra wolf hills birds cliff shore nest bears
0.5
0.4
0.3
0.2
0
0.1
0.2
close−up
jet
crystal
0.6
cactus
0.6
0.7
0.3
0.4
0.5
0.6
0.7
precision
0.7
precision
0.2
tree
branch
1
0.9
0.1
sky water
(b) Feature set 1 - test
smoke roofs columns ships detail
1
sun nest food gardens
clouds flowers snow vegetables grass forest textile hunter cat people mushrooms ocean elephants boats wolf birds fungus leaves reefslion buildings ice sand sunset background street shore rock fish bears coast trunk mountain helicopter
0.2
0.9
stone
gun field cougar
0.3
0.8
pillarsjet
shore
0.5
sky
0.3
0.2
0.1
0.8
recall
(c) Feature set 2 - training
0.9
1
0
saguaro pillars
stone
texture pattern
gardens fungus sun plants flowers waves mane coral sunset leaves mushroomsclouds people lion tree shadows coast woman ocean buildings snow grass boats beach hillsfood fish forest plane ice street rock reefs catflight mountain elephants house wolf vegetables ground trunk birds
water
tree
road
nest cactus
0.4
0
0.1
0.2
0.3
0.4
0.5 recall
0.6
water sky
0.7
(b) Feature set 2 - test
Fig. 3. Comparison of feature sets using recall and precision values on training and test sets. Recall is the number of correct predictions over number of actual occurence of the word in the data, and precision is the number of correct predictions over all predictions.
Table 2. Comparison of annotation measures for different color features. The features are sorted in descending order according to their prediction measures.
Energy filters RGB mean and variance Scalable Color Dominant Color Color Layout Edge histogram
Prediction Measure KL Divergence 0.3991 2.6290 0.3630 2.8342 0.3520 2.8595 0.3455 2.8924 0.3441 2.9215 0.3151 3.0577
Comparison of Feature Sets using Multimedia Translation
black dog tables
1
head cliff city fence entrance bridge smoke
1
0.9
0.9
0.8
0.8
crystal
sun cougarvegetables fungus mushrooms pillars branch plants sunset lion elephants jet stone clouds leaves light cat mountain flowers coral mane plane coastnest grass street fish ocean snow city cardisplay sand hunter buildings bears birds gardens reefs helicopter statues polar woman trunk rock wolf temple flightboats palace forest hills house field cactus sculpture desert ships ice beach ground closeup market walls shore shop windows zebra horizon ruins
0.5
0.4
0.3
0.2
0.1
0
0.1
0.2
0.3
0.4
0.5 recall
sky people
0.5
0.4
water
tree 0.3
0.2
0.1
0.6
0.7
0.8
0.9
0
1
branch mane
closeup
0.6
food
precision
textile background
pattern vegetables nest pillars background sun textile lion food cougar formation gardens stone windows cloudsflowers cat flight plants elephantsstreet sunset fungus plane grass sea light trunk mushrooms boats birds leaves ocean hats cactus people snow reefs buildings desert market waves shadows palace statues herd beach coast bears woman wolf fish shore field ground mountain sand helicopter coral house rock forest ice horizon car display hills columns shop hunter walls zebra sculpture temple black island
texture pattern
sea precision
jet
0.7
0.6
0
0.1
0.2
0.3
(a) RGB mean and average
0.6
0.7
0.8
0.9
1
0.9
1
0.9 polar
sea
0.8
crystal
0.8 close−up
close−up
reflection
crystal 0.7
0.7
0.6
closeup herd city branch background
0.5
gardens sun plane stone flowers plants vegetables sunset black lion clouds elephants field flight cat pillarsfood grass leaves fungus snow cliff sculpture road beach cactus house reefs boats street birds fish carcoast market templemountain woman mane wolf buildings walls display island dog ocean mushrooms bears rock nest sea helicopter cougar hills statues ice hunter shop coral head columns restaurant smoke sand ground forest zebra shore trunk textile jet
0.4
0.3
0.2
0.1
0
0.1
1
restaurant
0.2
0.3
0.4
0.5 recall
mane
0.6
pattern texture precision
precision
0.5 recall
fence branch night arch f−16 tracks
1
0.9
sky people
0.6
textile ocean harbor village costume roofs castle hillssculpturedisplay background gardens lion temple pillars plants helicopter jet flight food fungus woman walls clouds vegetables sandhats mushrooms leaves stone shop sun snow cougar reefs street ice market trunk polar statues boats ground plane cat buildings elephants fish beach horizon mountain grass shore forest gun palace coast sunset nest birds house city town herd tower closeup formation windows bears shadows wolf car rock cactus field coral island
0.5
0.4
water
tree 0.3
0.2
people
skywater tree
hunter 0.7
0.8
0.9
0
1
0
0.1
0.2
0.3
0.4
0.5 recall
0.6
0.7
0.8
(d) Scalable color river restaurant fence shadows museum courtyard arch shrine smoke
1
0.9
0.9 crystal
0.8
0.8 doors textile
close−up
0.7
0.7 texture pattern
mane tower hats
hunter background
0.6 precision
0.6
0.5
texture pattern flowers
0.1
(c) Dominant color
precision
0.4
sky water tree
(b) Energy filters
1
0
crystal close−up texture
polar
close−up 0.7
0
7
jet
gun
close−up crystal sea lion suntexture pillars jet street flight plane forest catpattern sunsettrunk buildings head reflection bears field columns car island plants stone clouds coast boats beach saguaro nest house icehills food helicopter waves grass cactus woman vegetables walls displayhorizon flowers elephants fish birds cougarmushrooms rock gardens snow town ground leaves temple reefs statues windows mane fungus wolf mountain closeup shore sand
0.5
sun textile waves pillars sunset shop palace nest 0.4 flight background snow stone mushrooms elephants clouds sea cat sculpture woman beach mountain closeup cactus temple polar sand leaves flowers grass coralvegetables plane lion street icecougar buildings boats rock 0.3 plants birds coast fish ground ocean horizon wolf shoresaguaro fungusfood hunter car house field trunk bears reefs herd entrance zebra 0.2 forest gardens gun statues windows hills black helicopter 0.1 0 0.1 0.2 0.3 0.4 0.5 0.6 recall
(e) Color layout
0.4 sky water people
0.3
tree
0.2
0.1
sky tree
people
water
ocean 0.7
0.8
0.9
1
0
0
0.1
0.2
0.3
0.4
0.5 recall
0.6
0.7
(f) Edge histogram
Fig. 4. Comparison of features using recall and precision values.
0.8
0.9
1
8
¨ Ozcanlı, ¨ P. Duygulu, O. N. Papernick
In [6] subsets of a feature set, which is very similar to Feature set 1, are compared. In this study, we extend this approach to compare two different feature sets. One of the goals was to test MPEG-7 features that are commonly used in content based image retrieval applications. However, it is seen that the selected MPEG-7 features were not very successful in the translation task. One of the reasons may be the curse of dimensionality, since the length of the feature vector for MPEG-7 set was large. This study also allows us to choose a better set of features for our feature studies. Our goal is to integrate the translation idea with the Informedia project [2], where there are terrabytes of video data in which visual features occur with audio and text. It is better to apply a simpler set of features to a large volume of data. The results of this study show that simple features used in Feature set 1 are sufficient to catch most of the characteristics of the images.
References 1. Corel Data Set. http://www.corel.com/products/clipartandphotos. 2. Informedia Digital Video Understanding Research at Carnegie Mellon University. http://www.informedia.cs.cmu.edu/. 3. MPEG-7 . http://www.darmstadt.gmd.de/mobile/MPEG7/index.html. 4. K. Barnard, P. Duygulu, N. de Freitas, D. A. Forsyth, D. Blei, and M. Jordan. Matching words and pictures. Journal of Machine Learning Research, 3:1107–1135, 2003. 5. K. Barnard, P. Duygulu, and D. A. Forsyth. Clustering art. In IEEE Conf. on Computer Vision and Pattern Recognition, volume 2, pages 434–441, 2001. 6. K. Barnard, P. Duygulu, R. Guru, P. Gabbur, and D. A. Forsyth. The effects of segmentation and feature choice in a translation model of object recognition. In IEEE Conf. on Computer Vision and Pattern Recognition, 2003. 7. P.F. Brown, S. A. Della Pietra, V. J. Della Pietra, and R. L. Mercer. The mathematics of statistical machine translation: Parameter estimation. Computational Linguistics, 19(2):263–311, 1993. 8. A. P. Dempster, N. M. Laird, and D.B. Rubin. Maximum likelihood from incomplete data via the em algorithm. Journal of the Royal Statistical Society, Series B, 1(39):1–38, 1977. 9. P. Duygulu, K. Barnard, N.d. Freitas, and D. A. Forsyth. Object recognition as machine translation: learning a lexicon for a fixed image vocabulary. In Seventh European Conference on Computer Vision (ECCV), volume 4, pages 97–112, 2002. 10. P. Duygulu-Sahin. Translating Images to words: A novel approach for object recognition. PhD thesis, Middle East Technical University, Turkey, 2003. 11. Int. Org. for Standardization. Information technology, multimedia content description interface, part 3 visual. Technical report, MPEG-7 Report No:N4062, 2001. 12. O. Maron and A. L. Ratan. Multiple-instance learning for natural scene classification. In The Fifteenth International Conference on Machine Learning, 1998. 13. I. D. Melamed. Empirical Methods for Exploiting Parallel Texts. MIT Press, 2001. 14. Y. Mori, H. Takahashi, and R. Oka. Image-to-word transformation based on dividing and vector quantizing images with words. In First International Workshop on Multimedia Intelligent Storage and Retrieval Management, 1999. 15. J. Shi and J. Malik. Normalized cuts and image segmentation. IEEE Transactions on Pattern Analysis and Machine Intelligence, 22(8):888–905, 2000.