GIS represent a powerful tool in landslide susceptibility assessment. To assess ...
statistical approaches are also relatively easy to apply for land-use planning.
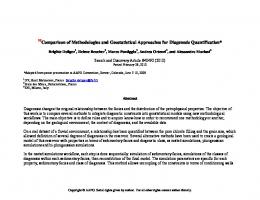
Geoinformatica DOI 10.1007/s10707-008-0063-2
Comparison of GIS-based methodologies for the landslide susceptibility assessment Paolo Magliulo & Antonio Di Lisio & Filippo Russo
Received: 2 July 2007 / Revised: 11 February 2008 / Accepted: 23 October 2008 # Springer Science + Business Media, LLC 2008
Abstract In this paper, two simple GIS-based methodologies have been used to assess the landslide susceptibility in a basin located in Southern Italy. The methodologies at issue, based on the spatial distribution of landslides and/or of causal factors, are bivariate statistics-based and expert-based, respectively. The spatial distribution of both the landslides and the causal factors has been investigated by integrating pre-existing and original data, which have been processed using ArcView GIS 3.2 software. The obtained results, consisting of landslide susceptibility maps have been compared and discussed. The bivariate statistics-based method has provided the most satisfying results. On the contrary, the expert-based method has provided a classification of the study area in terms of landslide susceptibility which does not completely fit with the surveyed spatial distribution of the landslides. Keywords Landslide susceptibility . GIS . Geomorphology . Southern Italy
1 Introduction Landslide susceptibility is the possibility that a landslide will occur in a particular area on the basis of the local environmental conditions [2]. Most of the approaches currently used in assessing and mapping landslide susceptibility are based on an accurate evaluation of the spatial distribution of both the “causal factors”, i.e. geoenvironmental factors determining all the pre-conditions for failure, and/or of the landslides. This involves the handling, the interpretation and the graphical representation of a large amount of territorial data. Thus, GIS represent a powerful tool in landslide susceptibility assessment. To assess landslide susceptibility, in most cases numerical weighting values are assigned to each class of the considered causal factors. In assigning weighting values, different approaches can be used. A first approach is the so-called qualitative or expert-evaluation approach [15]. In this P. Magliulo (*) : A. Di Lisio : F. Russo Dipartimento di Studi Geologici e Ambientali, Università degli Studi del Sannio, via dei Mulini 59/A, 82100 Benevento, Italy e-mail:
[email protected]
Geoinformatica
approach, the expert selects and maps the factors that affect slope stability and, based on personal experience, assigns to each one a weighted value that is proportionate to its expected relative contribution in generating failure [2]. Examples of this methodology are those reported by Amadesi et al. [4], Stevenson [19], Amadesi and Vianello [3], Anbalagan [5], Abu-zeid et al. [1], Visintainer and Turrini [25], Anbalagan and Singh [6] and Gupta and Anbalagan [12]. A second approach is of quantitative type and can be based either on bivariate or multivariate statistical analysis. In bivariate statistical analysis, each causal factor map is combined with the landslide distribution map and weighting values based on landslide densities are calculated for each causal factor class [20]. Good examples of this methodology are those reported by Yin and Yan [28], Pachauri and Pant [17], van Westen [23, 24], Rautela and Lakhera [18], Uromeihy and Mahdavifar [22], Süzen and Doyuran [20, 21] and Yalcin [27]. On the other hand, in multivariate statistical analysis, the weights of causal factors controlling landslide occurrence indicate the relative contribution of each of these factors to the degree of hazard within a defined land unit [20]. One of the main advantages of all the above mentioned approaches is the easy updating of the landslide susceptibility assessment procedure. Furthermore, both the qualitative and the bivariate statistical approaches are also relatively easy to apply for land-use planning. On the contrary, the multivariate statistical approach, even if formally more rigorous [2], requires a deeper knowledge of mathematics, statistics and softwares. Süzen and Doyuran [20] have found that the two statistical methods (bivariate and multivariate) produce susceptibility maps which converge approximately in 80% of a given study area. The final result of all the above described approaches consists in Landslide Susceptibility Maps, obtained by means of overlay processes in GIS environment which allow to sum the weighting values of the classes occurring in each point of the investigated area. From the obtained values, the landslide susceptibility in each point can be inferred by means of a comparison with the values reported on pre-existing landslide susceptibility classes (e.g., [3, 20]). In this paper, a landslide susceptibility assessment has been performed by using different GIS-based methods. Namely, an expert-based and a bivariate statistics-based approach have been used. The obtained results have been compared and discussed. The study has been carried out on a 273 km2 wide area located in the Molise region (Southern Italy), between 41°37′39″N and 41°47′48″N latitude and between 14°36′13″E and 14°51′01″E longitude, and falling within the Biferno River basin (Fig. 1). The altitude ranges from 134 m a.s.l. to 965 m a.s.l.
2 Materials and methods Most part of this study has been performed using the software ESRI ArcView GIS 3.2. In the first step of the study, both elevation points and contour lines reported on 1:25,000 scale maps have been digitized, in order to produce a 30 m per pixel Digital Elevation Model, from which both an aspect map (Fig. 2) and a slope angle map (Fig. 3) have been automatically derived. The slope angle classes are those suggested by Amadesi and Vianello [3], expressed in degrees. A lithological map has then been compiled (Fig. 4). On this map, the data reported on the Geological Map of Italy at 1:100,000 scale [8, 9] and refined during the field survey have been synthesized and graphically reported. The outcropping lithotypes have been grouped into “lithological complexes”, which have been named taking into account both the occurring lithotypes and their relative abundance within each lithological complex. A land-use map (Fig. 5) has also been produced by integrating pre-existing data provided by ISPRA (www.apat.gov.it) with original data obtained by
Geoinformatica Fig. 1 Location of the study area
Fig. 2 Aspect map of the study area
Geoinformatica
Fig. 3 Slope angle map of the study area
Fig. 4 Lithological map of the study area. Legend: 1 calcareous–arenaceous–marly complex, 2 calcareous– marly complex, 3 clayey–marly–arenaceous complex, 4 clayey–silty complex, 5 landslide complex, 6 pelitic–arenaceous–calcareous complex, 7 sandy–conglomeratic complex, 8 scree–talus complex
Geoinformatica
Fig. 5 Land-use map of the study area. Legend: 1 forests, 2 permanent crops, 3 pastures, 4 channel-edge vegetation, 5 urban fabric, 6 arable lands
means of aerial photographs analysis at 1:30,000-nominal scale. Finally, an integration of aerial photographs analysis, 1:25,000-scale topographic maps analysis and field survey has allowed to detect and map the landslides occurring in the study area. For each landslide, the scars have been distinguished from the bodies using classical techniques of geomorphological analysis of the relief. The areas subject to diffuse landsliding have also been detected and mapped. These latter are areas characterized by a large number of relatively small landslides, in most cases not representable to the scale, generally of shallow earth-slide type and often entrenched each other. In some cases, these areas coincide with large detachment surfaces of older landslides. The original data have been integrated with those reported in the IFFI database of landslides (www.apat.gov.it), allowing to produce the final landslide inventory map (Fig. 6). According to Süzen and Doyuran [21], in this study it has been considered that the best undisturbed geoenvironmental conditions (i.e., conditions before landslide occurs) would have been extracted from the vicinity of the landslide scar polygons. This has been achieved by adding a buffer zone on the outside of each landslide scar. Because the landslides have been mapped on a 1:25,000 scale-map, the width of the buffer has been set at 30 m. The buffers have then been reported on a Landslide Scars Buffers Map (not shown), to which we will refer to as LSBM. The first method used to assess the landslide susceptibility in the study area is based on a simple statistical bivariate analysis. The LSBM has been combined with each thematic map. This has allowed to calculate the density of the landslide scars buffers for both each class of the considered causal factors (lithology, land-use, slope angle and
Geoinformatica
Fig. 6 Landslide inventory map of the study area
aspect) and for the whole study area. The following formula, proposed by van Westen [23], has been used to calculate the weighting value for each class: Wi ¼ ln
DensClas NpixXi=NpixNi P ¼ ln P DensMap NpixXi= NpixNi
in which: Wi=weighting value of the class i; DensClas=density of the landslides scars buffers (LSB) in the class i; DensMap=density of the LSB in the whole study area; NpixXi=number of pixels that contains a LSB in the class i; NpixNi=number of pixels within the class i; ΣNpixXi=total number of pixels that contains a LSB in the whole study area; ΣNpixNi= total number of pixels of the whole study area map. Among the different formulas reported in literature and aimed to assess the landslide susceptibility using bivariate statistics, the one proposed by van Westen [23] is still the most widely used one (e.g., [18, 24]). Furthermore, most part of the other formulas (e.g., [20, 21]) do not differ substantially from the one proposed by the above quoted Author. The weighting values obtained using the van Westen [23] formula are reported in Table 1. In the second method, of expert-based type, the weighting values have been assigned to each class according to Amadesi and Vianello [3]. In this method, the lowest weighting values are assigned to those classes determining the highest instability. We have slightly modified the method originally proposed by the Authors by considering, as causal factor, the slope aspect instead of the bedding attitude of the strata. This choice has been due to the fact that, in the study area, very few and, often, strongly contrasting data concerning the bedding attitude of the strata are available. Using these data would have probably caused an incorrect assessment of the
Geoinformatica Table 1 Spatial distribution and weighting values (Wi) of the considered causal factors classes, these latter calculated using the formula proposed by van Westen (1993) and according to Amadesi and Vianello (1978) Causal factors classes
Lithological complexes Calcareous–arenaceous–marly complex Scree–talus complex Clayey–marly–arenaceous complex Clayey–silty complex Calcareous–marly complex Landslide complex Pelitic–arenaceous–calcareous complex Sandy–conglomeratic complex Land-use classes Urban fabric Permanent crops Channel-edge vegetation Pastures Forests Arable lands Slope-angle classes 0°–6° 7°–11° 12°–19° 20°–27° >27° Aspect classes 0°N–90°N 91°N–180°N 181°N–270°N 271°N–360°N
% of the study area
Wi (van Westen, 1993)
Wi (Amadesi and Vianello, 1978)
1.9 2.0 2.4 3.6 10.0 15.7 29.8 34.6
−0.163 0.040 1.097 −0.617 −0.071 −1.628 0.090 0.197
7 5 2 4 8 5 1 2
0.6 0.6 1.5 10.2 30.5 56.6
−0.554 0.194 −0.246 0.293 0.051 −0.085
0 −2 −1 0 2 −2
16.8 44.2 33.7 4.8 0.6
−0.841 −0.117 0.281 0.458 0.778
2 1 0 −1 −2
29.5 22.8 22.6 25.1
0.025 −0.068 0.036 −0.003
0 −1 −2 1
landslide susceptibility. As regards the use of slope aspect in this study, many Authors have demonstrated that it is a very important landslide controlling factor (e.g., [7, 26, 27]), as aspect related parameters, such as exposure to sunlight and drying winds, control the concentration of the soil moisture which, in turn, may control the occurrence of landslides. Thus, slope aspect is very often used in preparing landslide susceptibility maps (e.g., [7, 10, 11, 13, 14, 16, 21, 27]). The weighting values assigned according to the expert-based method at issue are reported in Table 1. For both the above described methods, the weighting values have been summed for each point of the study area by means of overlay processes. The obtained ranges of values have been subdivided into four intervals, corresponding to the four susceptibility classes suggested by van Westen [23]. This latter step has allowed us to produce, as final results, two Landslide Susceptibility Maps of the study area (Figs. 7 and 8).
3 Results The weighting values, hereafter referred to as Wi, calculated using the formula proposed by van Westen [23], are reported in Table 1. The highest density of landslide scars buffers
Geoinformatica
Fig. 7 Landslide susceptibility map produced using the bivariate statistics-based method and distribution pie-chart of the landslide susceptibility classes (expressed as percentage of the total area) in the studied basin
Fig. 8 Landslide susceptibility map produced using the expert-based method and distribution pie-chart of the landslide susceptibility classes (expressed as percentage of the total area) in the studied basin
Geoinformatica
(LSB), highlighted by the highest weighting value (Wi), occurs in areas where the deposits of the clayey–marly–arenaceous complex crop out (Wi: 1.097), on which the land-use is pasture (Wi: 0.293), displaying a slope angle >27° (Wi: 0.778) and facing from south to west (Wi: 0.036). On the contrary, LSB density is particularly low where the deposits of the landslide complex crop out (Wi: −1.628), on which urban fabric occur (Wi: −0.554), displaying a slope gradient ranging from 0° to 6° (Wi: −0.841) and facing from east to south (Wi: −0.068). The landslide susceptibility map and the relative pie-chart illustrating the spatial distribution of the landslide susceptibility classes (Fig. 7) highlight that, using this method, the landslide susceptibility is moderate-low in the 33% of the study area, low or very low in the 26%, moderate-high in the 25% and high or very high in the 16%. The landsurfaces characterized by the highest susceptibility are scattered in the study area, even if they are mainly concentrated in the south-western sector of the basin, while in the north-eastern side moderately low susceptible areas generally predominate. A combination between the landslide inventory map (Fig. 6) and the landslide susceptibility map produced using the bivariate statistics-based method (Fig. 7) has allowed to highlight that the percentage of surface of each susceptibility class really consisting of landslide scars, i.e. areas where landslides have really triggered, increases with the degree of calculated susceptibility, as expected (Fig. 9a). The application of the expert-based method ([3], modified) has produced the Landslide Susceptibility Map reported in Fig. 8. The north-western side of the basin displays a higher degree of susceptibility than the south-eastern side. The graph of Fig. 8 highlights that, using this method, 54% of the study area displays a moderate-high susceptibility, 24% a moderate-low susceptibility, 19% a high or very high susceptibility and only 3% a low or very low susceptibility. The combination of the landslide inventory map (Fig. 6) with the landslide susceptibility map produced using the expert-based method (Fig. 8) has highlighted that the percentage of landsurfaces really consisting of landslide scars is the same for both the areas classified as moderately low susceptible and lowly or very lowly susceptible (9.3%; Fig. 9b). However, an increasing trend of the percentage at issue with the calculated degree of susceptibility has been observed for the moderate-low, moderate-high and high or very high landslide susceptibility classes.
Fig. 9 Percentage of the landsurfaces of the different susceptibility classes consisting of landslide scars
Geoinformatica
4 Discussion The preparation of a landslide inventory map is the key starting point of the bivariate statistics-based method. Thus, a very careful mapping of landslides is a key-factor in using this method. This statement is also true for all the methodologies based on the spatial distribution of landslides (e.g., multivariate statistics-based methodologies). In fact, all sorts of problems in landslide inventory maps will automatically be projected to the final susceptibility map [7]. Factors such as the quality and scale of both aerial photos and topographic maps, the degree of experience of the person and the geoenvironmental complexity of the study area affect the reliability and the completeness of landslide inventory maps [7]. The same considerations can also be made for all the thematic maps, which are fundamental for most part of the landslide assessment methods. An advantage which is common in both the methods used in this study is that they allow an easy updating of both data and landslide susceptibility assessment procedures by using GIS. Another advantage is that they are absolutely easy to apply for land-use planning and policies. Aleotti and Chowdhury [2] emphasize the importance of a simple, direct and easily understood language in landslide susceptibility maps, with the aim to make easier their practical use. Other methods, such as multivariate statistical analysis and use of neural networks, are very probably more rigorous than those used in this study, especially because they take into account the mutual interrelationships between the causal factors of landsliding. However, they require unquestionably a deeper knowledge of mathematics, statistics and softwares which, unfortunately, is not common. Furthermore, worthy to note is the fact that the bivariate statistics-based method can be considered as fully objective as it is based on a “real”, field-surveyed datum, i.e. the spatial distribution of landslides, which makes it fairly reliable. On the contrary, the expert-based method used in this study does not require such a “real” datum, but this latter can be usefully used to verify the accuracy of the method at issue by means of a combination, in GIS environment, between the Landslide Susceptibility Maps and the field-surveyed landslide inventory map. Among the methods used in this study, the bivariate statistics-based one has provided good results, as suggested by the fact that the percentage of the landsurfaces really consisting of landslide scars increases with the calculated susceptibility, as expected (Fig. 9a). Furthermore, such percentage is very low (5,0%) in areas classified as lowly or very lowly susceptible, which is a coherent datum. In the existing literature, most part of the papers dealing with landslide susceptibility assessment using bivariate statistics often calculates the weighting values on the basis of the landslide density, i.e. taking into account the number of pixels containing a landslide scar or a landslide body (e.g. [23, 24, 27]). This could be a possible shortcoming of this approach. In fact, some parts of the landslide body could be characterized by geonvironmental factors classes not prone to failure. For instance, very low slope angles generally occurs at landslide toes. This could increase the landslide density, and thus the weighting value, also in the geoenvironmental factors classes at issue (e.g., classes of very low slope angles), inducing an overestimation of the landslide susceptibility. Furthermore, considering the pixels containing a landslide in calculating the weighting values means to take into account the combinations of geoenvironmental factors classes occurring on the landslide surface, which could be very different from those really responsible for the triggering of the landslide (e.g., slope angle and aspect). Thus, a possible improvement of this method probably consists in calculating the weighting values taking into account the spatial distribution of the areas characterized by the best undisturbed geoenvironmental conditions, i.e. conditions before landslide occurs [21]. In most cases, such conditions occur in the
Geoinformatica
immediate vicinity of each landslide scar and can be easily extracted, in GIS environment, by adding a buffer zone on the outside of the polygons containing a landslide scar. As regards the expert-based method used in this study, the main shortcoming very probably lies in the high subjectivity of this method in assigning the weighting values. On the other hand, this method does not require the production of a landslide inventory map. Thus, the expert-based method is suitable in preliminarily assessing the landslide susceptibility over large areas in a relatively short time and at low expense, especially if pre-existing data are available. The verification of the landslide susceptibility map produced in this study using the expert-based method (Fig. 9a) has highlighted that the method at issue is fairly reliable in discriminating the areas characterized by a high or very high susceptibility from those moderately susceptible. On the contrary, it seems to fail in discriminating the areas falling in the low or very low susceptibility class from those characterized by a moderate-low susceptibility. The comparison of the landslide susceptibility maps obtained using, respectively, the bivariate statistics-based method (Fig. 7) and the expert-based method (Fig. 8) points out that these methods converge only in terms of total area of the landsurfaces characterized by a high-very high landslide susceptibility; however, the location of these landsurfaces differ greatly on the two maps. Very different results have also been obtained for both the total area and the location of most part of the landsurfaces falling into the other susceptibility classes. Generally speaking, the overall landslide susceptibility in the study area results higher using the expert-based method than using the bivariate statistics-based method.
5 Conclusions This study has allowed both to assess the landslide susceptibility in an area located in Southern Italy using different methods and to compare the obtained results. The used methods are based on “real”, field-surveyed data, i.e. the spatial distribution of both the landslides and/or the causal factors, and their application and updating are easy. The verification procedure, performed by comparing the produced landslide susceptibility maps with the field-surveyed spatial distribution of the landslide phenomena, highlighted that most suitable method is probably the bivariate statistics-based one. The second method, of expert-based type, even if easier and faster to apply than the previous one, has provided a classification of the study area in terms of landslide susceptibility which does not completely fit with the surveyed spatial distribution of the landslides. However, even if the degree of uncertainty is variable, the produced maps represent a first but fundamental step in land-use planning and in set-up safety measures.
References 1. Abu-zeid N, Mazzini E, Semenza P, Turrini MC (1994) Applicazione di un metodo cartograficonumerico al bacino dell’Alpago (BL) per la zonazione della pericolosità potenziale da frana. Geologia Tecnica ed Ambientale 3:45–55 2. Aleotti P, Chowdhury R (1999) Landslide hazard assessment: summary, review and new perspectives. Bull Eng Geol Environ 58:21–44 3. Amadesi E, Vianello G (1978) Nuova guida alla realizzazione di una carta di stabilità dei versanti. Mem Soc Geol Ital 19:53–60
Geoinformatica 4. Amadesi E, Vianello G, Bonfatti G, Pignone R, Preti D (1977) Guida alla realizzazione di una carta della stabilità dei versanti. Pitagora Editrice, Bologna, Italy, 72 pp 5. Anbalagan R (1992) Terrain evaluation and landslide hazard zonation for environmental regeneration and land use planning in mountainous terrain. Proceedings of VI International Symposium on Landslides, Christchurch, New Zealand 2:861–868 6. Anbalagan R, Sing B (1996) Landslide hazard and risk assessment mapping of mountainous terrains—a case study from Kumaun Himalaya, India. Eng Geol 43:237–246 7. Ayalew L, Yamagishi H, Marui H, Kanno T (2005) Landslides in Sado Island of Japan: Part II. GISbased susceptibility mapping with comparison of results from two methods and verifications. Eng Geol 81:432–445 8. Balboni A (1968) Note Illustrative della Carta Geologica d’Italia alla scala 1:100,000 – Foglio 154 – Larino. Servizio Geologico d’Italia, Roma, Italy, pp 1–41 9. Cestari A, Malferrari N, Manfredini M, Zattini N (1975) Note Illustrative della Carta Geologica d’Italia alla scala 1:100,000 – Foglio 162 – Campobasso. Servizio Geologico d’Italia, Roma, Italy, pp 1–78 10. Çevik E, Topal T (2003) GIS-based landslide susceptibility mapping for a problematic segment of the natural gas pipeline, Hendek (Turkey). Environ Geol 44:949–962 11. Dai FC, Lee CF, Li J, Xu ZW (2001) Assessment of landslide susceptibility on the natural terrain of Lantau Island, Hong Kong. Environ Geol 40:381–391 12. Gupta P, Anbalagan R (1997) Slope stability of Teri Dam Reservoir Area, India, using landslide hazard zonation (LHZ) mapping. Q J Eng Geol 30:27–36 13. Guzzetti F, Carrara A, Cardinali M, Reichenbach P (1999) Landslide hazard evaluation: a review of current techniques and their application in a multi-scale study, Central Italy. Geomorphology 31:181– 216 14. Komac M (2006) A landslide susceptibility model using the Analytical Hierarchy Process method and multivariate statistics in perialpine Slovenia. Geomorphology 74:17–28 15. Leroi E (1996) Landslide hazard-risk maps at different scales: objectives, tools and developments. In Proceedings of VII International Symposium on Landslides, Vol. 1. Trondheim, Norway, pp 35–52 16. Nagarajan R, Roy A, Vinod Kumar R, Mukherjee A, Khire MV (2000) Landslide hazard susceptibility mapping based on terrain and climatic factors for tropical monsoon regions. Bull Eng Geol Environ 58:275–287 17. Pachauri AK, Pant M (1992) Landslide hazard mapping based on geological attributes. Eng Geol 32:81– 100 18. Rautela P, Lakhera RC (2000) Landslide risk analysis between Giri and Ton Rivers in Himalaya (India). International Journal of Applied Earth Observation and Geoinformation 2:153–160 19. Stevenson PC (1977) An empirical method for the evaluation of relative landslide risk. Bull Int Assoc Eng Geol 16:69–72 20. Süzen ML, Doyuran V (2003) A comparison of the GIS based landslide susceptibility assessment methods: multivariate versus bivariate. Environ Geol 45:665–679 21. Süzen ML, Doyuran V (2004) Data driven bivariate landslide susceptibility assessment using geographical information systems: a method and application to Asarsuyu catchment, Turkey. Eng Geol 71:303–321 22. Uromeihy A, Mahdavifar MR (2000) Landslide hazard zonation of the Khorshostam area, Iran. Bull Eng Geol Environ 58:207–213 23. van Westen CJ (1993) Application of geographic information systems to landslide hazard zonation. ITC publication No. 15, International Institute for Aerospace and Earth Resources Survey, Enschede, The Netherlands, p 245 24. van Westen CJ (1997) Statistical landslide hazard analysis. ILWIS 2.1 for Windows application guide. ITC publication, Enschede, The Netherlands, pp 73–84 25. Visintainer P, Turrini MC (1995) Carta della pericolosità di eventi naturali della Val Duron (Trentino Alto Adige). Geologia Tecnica ed Ambientale 2:17–33 26. Wieczorek GF, Mandrone G, De Colla L (1997) The influence of hill-slope shape on debris-flow initiation. In: Chen CL (ed) Debris flow hazard mitigation: mechanics, prediction, and assessment. American Society of Civil Engineers, New York, pp 21–31 27. Yalcin A (2008) GIS-based landslide susceptibility mapping using analytical hierarchy process and bivariate statistics in Ardesen (Turkey): comparison of results and confirmations. Catena 72:1–12 28. Yin KJ, Yan TZ (1988) Statistical prediction model for slope instability of metamorphosed rocks. Proceedings of the V International Symposium on Landslides, Lausanne, Switzerland 2:1269–1272
Geoinformatica
Paolo Magliulo received the degrees in Earth Sciences from the University of Naples (Italy) in 1999 and the Ph.D. degrees in “Sedimentary Geology” from the same University in 2004. Currently, he is researcher at the Sannio University of Benevento (Italy). His research interests include the relationships between geomorphological processes and soil formation and, particularly, the investigation of soil erosion processes.
Antonio Di Lisio received the degrees in Environmental Sciences from the University of Molise (Italy). Currently, he is a Ph.D. student at the Sannio University of Benevento (Italy). His area of research interest is the determination of erosion rates at basin scale using GIS and quantitative geomorphological analysis.
Filippo Russo received the degrees in Earth Sciences from the University of Naples (Italy) in 1985 and the Ph.D. degrees in “Sedimentary Geology” from the same University in 1990. Currently, he is full professor of “Physical Geography and Geomorphology” at the Sannio University of Benevento (Italy). His main area of research interest is the monitoring of geoenvironmental changes in landscape units.