find the optimal location of Flexible Alternating Current Transmission System (FACTS) devices with minimum cost of installation and to improve power system ...
Venkata Padmavathi S1,*, Sarat Kumar Sahu2, A Jayalaxmi3
J. Electrical Systems 11-2 (2015): 189-202 Regular paper Comparison of Hybrid Differential Evolution Algorithm with Genetic Algorithm Based Power System Security Analysis Using FACTS
J ES Journal of Electrical Systems
This paper presents a novel stochastic hybrid differential evolutionary algorithm technique to find the optimal location of Flexible Alternating Current Transmission System (FACTS) devices with minimum cost of installation and to improve power system security and is compared with Genetic Algorithm (GA). Differential Evolution (DE) algorithm technique is a simple evolutionary search algorithm and shows better performance but greedy in space searching. Particle Swarm Optimization (PSO) converges quickly and but stuck in local optima. A novel heuristic method based on Genetic algorithm also used to find optimal location of FACTS devices to enhance the power system security and no absolute assurance of global optimum. In this paper hybrid differential evolutionary algorithm (DEPSO) is introduced to eliminate the problems of DE and PSO and solve the power system security problem with greater accuracy and compared with Genetic Algorithm. The proposed algorithm minimizes the security index, loss and the installation cost of FACTS devices in the transmission network. Security index indicates the overload level of the transmission lines. Three types of FACTS devices, Static Var Compensator (SVC), Thyristor Controlled Series Compensator (TCSC) and Unified Power Flow Controller (UPFC) are considered and the proposed algorithm is verified by standard IEEE 14 bus network.
Keywords—FACTS, TCSC, SVC, UPFC, Security Index (SI), PSO ,DE, GA, DEPSO. Article history: Received 28 October 2014, Received in revised form 29 April 2015, Accepted 15 May 2015
1. Introduction In the present scenario, the majority of the electrical power systems in the developing countries with huge interconnected networks distribute the generation reserves to increase the reliability of the power system. However, with huge interconnected power networks there are increased difficulties like hard to control the power flows, fluctuations in reliability of power supply, which results in power system instability, bus voltages and security problems that results huge number blackouts in different parts of the world. The above consequences may be due to the weak interconnection of the power system, overload of the network, systematical errors in planning and operation [1]. To overcome these problems and to provide the required power flow and bus voltages along the transmission line with better system security and reliability, FACTS devices becomes one of the alternatives [2]. FACTS furnish [3] [4] the facility to enhance the controllability and to improve the transmission system operation, stability limits with advanced control techniques in the existing power systems. FACTS devices can be classified into three types, such as shunt compensators, series and combined series-shunt compensators [2].Modelling of these FACTS devices in the power flow studies were reported in [5]. The UPFC is a combined series –shunt type FACTS device for providing reactive power, active power, and voltage control and regulates all the three variables simultaneously or combination of them without Corresponding Author: Venkata Padmavathi S, Ph.D Scholar, JNTUH & Asst Prof. EEE Dept. GITAM University, Hyderabad, Telangana, India 2 Prof., EEE Dept., M.V.G.R Engg.Col., Vizianagaram, A.P., India 3 Prof., EEE Dept., JNTU University, Hyderabad, Telangana, India Copyright © JES 2015 on-line : journal/esrgroups.org/jes
Venkata Padmavathi S et al: Comparison of Hybrid Differential Evolution Algorithm ...
violating the operating limits [5].The SVC [2], [7] is a shunt type FACTS controller and is a Static Var absorber or generator whose output is adjusted to interchange inductive or capacitive current to maintain the bus voltage. The TCSC is a series controlled FACTS device to improve the power flow by compensating the inductive reactance of the transmission line. Population based algorithms and Evolutionary algorithms are well known in recent years. Some well established algorithms like PSO was introduced by John Kennedy and Eberhart [8], is applied for solving different optimization problems. For congestion management in the power system the Genetic algorithm-based fuzzy logic multi-objective approach is attempted [9].The best location of FACTS devices to reduce generation cost using real power flow performance was introduced[10].For allocation of FACTS and to improve system security GA approach was reported in[11].For allocation of SVC in power system DE approach is reported [12].To minimise generator fuel cost with multi-type FACTS A hybrid Tabu search and simulated annealing was reported[13]. Minimization of loss and for optimal location of TCSC DE approach is reported [14].A hybrid GA is used to solve OPF in a power system using FACTS was reported [15]. A new algorithm for allocating distributed TCSC’s in power systems was reported [25]. A Comprehensive Review on Methods for Solving FACTS Optimization Problem in Power Systems was reported [26]. Heuristic methods for solution of FACTS optimization problem in power systems was reported [27]. Particle swarm optimisation applications in FACTS optimization problem was reported [28]. Optimal placement of Multi-type FACTS devices in power systems using evolution strategies was reported [29]. The organization of the paper is as follows and these sections explain about Section II Power System Security and Flexible Alternating Current Transmission Systems (FACTS) Modeling, section III Problem Formulation and Methodology, section IV Results and Discussion, and section V conclusion. In this paper by applying DE,PSO,GA,DEPSO techniques, the optimal location of the FACTS devices to get the minimum installation cost of FACTS devices ,minimum loss and to enhance the power system security by minimizing the security index(SI) ,without violating the power system constraints.Here the SVC has been modelled as the reactive source added at the bus , the TCSC is modelled as a variable reactance inserted in the transmission line and UPFC is modelled as combination of TCSC in the line and SVC at a bus connected to the same bus. These algorithms are verified by standard IEEE 14 bus networks. It is observed that power system security is increased by minimizing system loss and security index. Security index is related line power flow and bus voltage. So by minimizing the security index we can improve the security [16]. 2. Power System Security and Flexible Alternating Current Transmission Systems (FACTS) Modeling Power system security is the ability to sustain the power flow of electricity from the generators to the customers, under unexpected disturbed conditions such as electric short circuits or unanticipated loss of system elements. The measures of power system security are amounts, frequency and duration of consumer outages [17]. Reliable and secure operation of power systems is the key to the success of deregulation. The Security index will be a small value when the total real power circulated evenly in relation to the line power flow capacity of each line in the power system [16] and the index will increase as the number of overload lines increases. Minimization of both indices, JP and Jv means the maximization of security margins. Therefore it can be said that if the security index J [19], [21] increases, the system security margin will decrease.
190
J. Electrical Systems 11-2 (2015): 189-202
pij Security index = J P = ∑ ∑ Wi max i i , j =1 pij n
n
n
Security index =
JV = ∑ Wi Vi − Vref ,i
2
(1)
2
(2)
i
i, j: bus numbers Wi : weighing factor
pij : Active power flow in the line between bus i and j pij max : Maximum Active power flow in line between bus i and j J P : is the security index which means the even distribution of the total active flow JV : is the security index which means how much the bus voltage nearer to the ref voltage
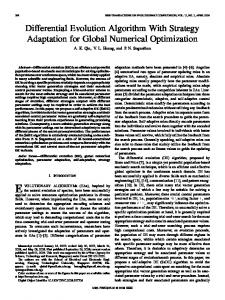
Vref ,i : Nominal voltage 2.1. Flexible Alternating Current Transmission Systems (FACTS) Modeling FACTS are composed of static equipment generally power electronics based devices. These controllers were introduced depending on the type of power system troubles [2].In this paper three types of FACTS devices are used. These are TCSC, SVC and UPFC which are shown in fig.1, fig.2, fig.3.
Fig. 1: Model of TCSC
Vk Isvc
Bsvc
Fig. 2: SVC Equivalent [20] variable Susceptance model
191
Venkata Padmavathi S et al: Comparison of Hybrid Differential Evolution Algorithm ...
Fig. 3: Model of UPFC
SVC is a shunt type device and can be used for both inductive and capacitive compensation. In this paper SVC is modeled as an ideal reactive power injection at bus i.
∆Qi = Qsvc In the case of TCSC the power flow through the line i-j named Pij . Pij =
VV i j Xij
sin(δi −δj )
(3)
(4)
So the power flow [21] in the line depends on the line reactance Xij, the bus voltage magnitudes Vi and Vj and phase angle between sending end bus and receiving end bus δi and δj.SVC can control the bus voltage by changing reactive power at the connected bus. The TCSC can control the line power flow by changing the line reactance.UPFC control parameters are the bus voltage, line impedance and phase angle, by changing these parameters the power flow can be controlled. 3. Problem Formulation and Methodology The main aim of this paper is to minimize the power system loss, cost of installation of FACTS devices and security index. By joining all these functions an objective function (Obj fn) is formed.
Objfn = a1 ( J p ) + a2 ( Jv ) + a3 (Total Investment Cost) + +a4 ( Losses )
(5)
Using the database of [2], the cost function of TCSC, SVC, and UPFC are shown in equations (6)-(8). For TCSC CTCSC =0.0015S2-0.713S+153.75 (US$/KVAR)
(6)
For SVC CSVC = 0.0003S2-0.3051S+127.38 (US$/KVAR)
(7)
For UPFC CUPFC=0.0003S2-0.2691S+188.22(US$/KVAR)
(8)
Where S is the operating range of the FACTS devices in MVAR.
S = Q2 − Q1
192
(9)
J. Electrical Systems 11-2 (2015): 189-202
Where Q2 is the reactive power flow in the transmission line after installing FACTS device in MVAR and the reactive power Q1 is before installing FACTS device. And The JP, JV are discussed in section II. The coefficients a1 to a4 will be obtained by trial and error method. The used values are 0.2665, 0.5714, 0.1421 and 0.02. The cost functions [21] graph is obtained by using MATLAB software for the three FACTS devices are shown in fig.4. 180 UPFC 160
Inv es tm e nt c os t U S $ /K v a r
140 TCSC
120
100
80
SVC
60
40
20
0
100
200 Operating Range MVar
300
400
Fig.4 Cost function of FACTS Devices
The fitness or objective function is optimized with the following constraints. Bus voltage limits: 0.9 ≤ Vb ≤1.1, Where Vb is the bus voltage Line thermal limits: Pij ≤Pijmax Where Pij is the line power flow between the busses i and j. Pijmax is the line thermal rating. FACTS devices constraints:
−0.7 X L ≤ X TCSC ≤ 0.2 X L 0.3 p.u ≤ Qsvc ≤ 1 p.u
(10) (11)
Equations (10) and (11) for UPFC. Where XTCSC is the reactance added in the line by introducing TCSC.XL is the transmission line where the TCSC is placed and QSVC is the injected reactive power at the bus by connecting SVC. Power flow constraints: F (V, θ) =0 Where
Pi (V , θ ) − Pi net For each PQ bus i net F (V , θ ) = Qi (V ,θ ) − Qi P (V , θ ) − P net For each PV bus j j j
(12)
Pi is real power calculated for PQ bus,Pj is the real power calculated for PV bus,Qi is the reactive power calculated for PQ bus, Pinet is the specified real power for PQ bus, Qinet is the specified reactive power for PQ bus,Pinet is the specified real power at PV bus, V is the voltage magnitudes at different busses, θ is the phase angles of voltages at different busses. 3.1. Overview of DE and its implementation The DE was first introduced by Storn and price at Berkely in the year 1994-1996.It is a population based stochastic search algorithm[21].It is similar to the population based search algorithms like GA but the main distinction between DE and GA are the GA concentrates on crossover, while the evolutionary algorithms like DA use mutation as primary search
193
Venkata Padmavathi S et al: Comparison of Hybrid Differential Evolution Algorithm ...
mechanism. In each generation NP population vectors have been generated. The first member of population is “individual 1” is set as the target vector. To generate noisy random vector three individuals are selected randomly from the population size. The weighted difference between the two individuals is added to the third randomly chosen vector to generate noisy random vector. The obtained noisy random vector does a cross over with the target vector to generate trail vector. The fitness or objective functions of the two vectors are compared and the vector corresponding to the best fitness is taken as “individual 1” for the next generation.
X ij = x1,i ,G, x2,i ,G , ........xD ,i ,G
(13)
For i=1, 2…………., NP Where G is the generation number and D is the dimension of the problem.
Vi = X r1,G + F × ( X r 2,G − X r 3,G )
(14)
Where Vi is the noisy random vector. F is the weighting factor chosen as 0.8, which has a direct effect on convergence rate. The three vectors Xr1,G ,Xr2,G and Xr3,G are selected randomly. Then to get the trail vector the crossing operation is used and the trail vector ui is given by
v j ,i,G +1 u j ,G +1 = x j ,i ,G +1
If randj,i ≤CR
(15)
If rand j,i >CR
Where the randj,i is a randomly generated number between(0,1).CR is called as crossing factor, which is a user defined number between (0,1). The fitness functions of the target vector xi,G+1 and trail vector ui,G+1 are compared and the vector corresponding to the best fitness taken for the next generation.
ui ,G +1 if xi ,G +1 = xi ,G
f ( ui ,G +1 ) ≤ f ( xi ,G ) otherwise
(16)
The mutation, crossover and selection will be continued until the convergence criterion is satisfied. 3.1.1. Initialisation The initial population of particles is generated randomly between the given constraint range. The variable corresponding to the FACTS device is their location and setting. For TCSC, SVC uses two variables (i.e. setting and location). UPFC is modeled as combination of shunt and series device, so uses 3 variables (series setting, shunt setting, location). 3.1.2. Fitness function calculation The fitness function is shown in equation (5).it consists of four terms. The first 2 terms corresponding to security indices, third term corresponds to FACTS investment cost, fourth term corresponds to power system loss. For each vector, the transmission line data is updated according to its TCSC setting and the location and the power system bus data is updated according to its SVC setting and the location. For UPFC combination of both. Then the N-R load flow is performed to calculate the bus voltages, line flows. By using these values fitness function is calculated. The procedure is repeated until the maximum number of iterations is reached.
194
J. Electrical Systems 11-2 (2015): 189-202
3.2. Overview of PSO and its implementation PSO is population based optimization technique [8], it simulates birds flocking, which optimizes a certain objective function. Each particle knows its best value so far is called Pbest, in group is called Gbest among all Pbest. Each particle tries to change their position by considering its current positions Xi , current velocities Vi,the individual intelligence Pbest and the group intelligence Gbest[5][25]. The equations (17),(18) are used to compute the positions and velocities.
Vi
j +1
(
= W × V i j + C 1 × r a n d 1 × P b e s ti − X
(
+ C 2 × rand 2 × G best − X X
j+1 i
= X
j i
+ Vi
j i
)
j+1
j i
)+
(1 7 ) (1 8 )
Where Vij+1 is the velocity of the ith particle in (j+1)th iteration.C1 and C2 are the learning factors and taken between (0, 2.5).W is the inertia weight.rand1 and rand2 are the random numbers generated between (0,1).Pbesti is the best position of the ith individual. Gbest is the group best value.Xij is the position of ith individual in jth iteration. The inertia weight W is changed in each iteration by using the equation (19).
W − W m in W = W m ax − m ax × ite r ite r m ax
(1 9 )
Where Wmax is the initial value of the inertia weight taken as 0.9,Wmin is the final value of the inertia weight taken as 0.4,iter max is the maximum number of iterations and iter is the current iteration [18]This algorithm can be implemented like the procedure explained in sub-section 3.1.1, 3.1.2. 3.3. Overview of Genetic Algorithm and its implementation. Genetic Algorithm is one of the most famous heuristic optimization technique which is based on natural selection and genetics [11] [30].It is usually used to get the near optimal solution. In each generation a new set of chromosomes with an improved fitness is generated by using the following genetic operators. i) Selection ii) Cross Over iii) Mutation The initialisation of chromosome structure of GA uses the rating and location of FACTS devices. i) Selection : In this method tournament selection is used for the selection.In this metod tournment size chosen is 4. ii) Cross Over : It selects genes from the parent chromosomes and generates a new offspring. Cross over is the process of taking two parents and generating from them an offspring. iii) Mutation : It is performed after the cross over.It is used to prevent falling of all solutions into the local optimum. In the case of binary encoding a few randomly chosen bits from 1 to 0 or from 0 to 1. This algorithm can be implemented like the procedure explained in sub-section 3.1.1, 3.1.2. Simple Genetic Algorithm : Step 1 : Start Step 2 : Initialize the population Step 3 :Calculate the fitness function.
195
Venkata Padmavathi S et al: Comparison of Hybrid Differential Evolution Algorithm ...
Step 4 :while the fitness value is not optimal value do the selection,Cross over,Mutation. If it is equal stop Step 5 : Calculate the fitness function. Step 6 : Go to step 4. 3.4. Proposed DEPSO Algorithm In the hybrid differential evolution, which introduces one-to-one competition will provide faster convergence speed towards optimum. It uses less number of populations in the evolutionary process to get the global solution [22], [23]. To eliminate the problems in DE and PSO and to get the advantages of both the DEPSO algorithm is developed. The procedure is as follows. � Initially generate a set of random values of population (NP).This initial set of population is considered as parent vector. � Calculate the fitness value F1(i) for each of the particle in the parent vector; For i=1,2,3……….NP � Now perform the operations like mutation, cross over and selection .The resultant vector is the Target vector. � Calculate the fitness value F2(i) for each particle in the target vector. � Obtain the overall best particle Gbest up to this iteration and Pbest is the set of best particles at that iteration. � Evaluate each particle velocity in the parent vector using these Pbest and Gbest values. � Now update the positions of each particle in the parent vector using these velocities using PSO. � By using these values evaluate the fitness value F3(i). � By comparing the fitness values F1(i), F2(i) and F3(i);now select the best particles either from parent vector or target vector or PSO vector. � Now these selected set of particles become parent vector for next iteration and repeat the steps for fixed number of iterations. 4. Results and Discussion The solutions for minimization of power system loss, total investment cost of the FACTS devices, security indices were obtained. Here the IEEE 14 bus system is taken as test system for the case study. The simulation studies are carried out in the MATLAB environment. The flow chart for best fit of FACTS is shown in fig.5 4.1. IEEE 14 bus Test system The line data and bus data are taken from [24] and contain 20 lines. The setting of FACTS device, optimal installation cost, minimum loss, best security indices are obtained by using the DE, PSO, GA, DEPSO algorithms. It is observed that the FACTS devices improve the transmission line power flows, voltages nearer to its thermal and voltage ratings. The FACTS devices are located in order to reduce the loadings of active and reactive powers by forcing the power flows in other directions. This can be proved by reduction of security indices Jp, Jv. if line powers and bus voltages nearer to the limits then automatically Jp, Jv will be reduced. The performance of the proposed hybrid differential evolution technique is compared with GA,DE and PSO.The parameters of DE, PSO and GA are shown in table 1, 2 and 3 respectively and combination of both tables 1,2 for DEPSO. Since the variables such as location of FACTS device are integer, their denormalized value is rounded to nearest integer to get the actual value. The normalized value of each variable (Xnorm) in the particle is first denormalized to actual value (Xactual) according to the equation Xactual =Xmin+ (Xmax-Xmin)*Xnorm . 196
J. Electrical Systems 11-2 (2015): 189-202
Table 1: DE Parameters NP
D
F
CR
Iterations
50
2
1.2
0.5
100
Table 2: PSO Parameters C1,C2
1.5
Wmax
0.9
Wmin
0.4
No.of swarm beings
50
No.of iterations
100
Table 3 : GA Parameters Tournament size
4
Pop Size
30
Maximum Generations
50
No.of off spring per pair of parents
01
Cross over random number
0.01-0.3
Mutation random number
0.01-0.1
Table 4: FACTS allocation and the size of the device with DE SVC
TCSC
UPFC
Device Type
Size (MVA)
Location Bus no:
Size (MVA)
Location Bus no-Bus no
Size (MVA)
Location Bus no-Bus no:
TCSC SVC UPFC
80 -
13 -
228 -
2-3 -
223
-3-4
Table 5: FACTS allocation and the size of the device with PSO SVC Device Type TCSC SVC UPFC
TCSC
UPFC
Size (MVA)
Location Bus no:
Size (MVA)
Location Bus no-Bus no
Size (MVA)
Location Bus no-Bus no:
108 -
9 -
218 -
9-10 -
210
6-12
Table 6. FACTS allocation and the size of the device with DEPSO SVC
Device Type TCSC SVC UPFC
TCSC
UPFC
Size (MVA)
Location Bus no:
Size (MVA)
Location Bus no-Bus no
Size (MVA)
Location Bus no-Bus no:
90 -
4 -
224 -
6-11 -
164
2-5
197
Venkata Padmavathi S et al: Comparison of Hybrid Differential Evolution Algorithm ...
Start
Get the bus data,line data,load data.
Run NR.find Power Flow, Bus Voltage Calculation
Calculation of Security Index (JPref/JVref) is base case
TCSC/ SVC/UPFC Placement
Generate initial values of population using/DE/PSO/GA/DEPSO
Update line and bus data and run the load flow
Cal fitness for each particle.find best values
Create new population No Is max iter
Yes Change Location Of TCSC/ SVC/UPFC
Cal fitness and JP/JV
YES
JPref/JVref > JP/JV NO
Best Fit of TCSC/SVC/UPFC Fig.5. Flow chart representation of Best fit of TCSC/SVC/UPFC
198
J. Electrical Systems 11-2 (2015): 189-202
Table 7. FACTS allocation and the size of the device with GA SVC Device Type
TCSC
UPFC
Size (MVA)
Location Bus no:
Size (MVA)
Location Bus no-Bus no
Size (MVA)
Location Bus no-Bus no:
110 -
5 -
220 -
3-4 -
200
6-12
TCSC SVC UPFC
Table 4, 5, 6, 7 shows the optimal locations, sizes of the FACTS devices using DE, PSO, DEPSO, GA algorithm techniques. Table 8: Security Indices and installation costs using DE Device Without FACTS TCSC SVC UPFC
Jp
Jv
Cost$
10 9.9 9.1 8.5
4.0 3.7 3.4 2.8
1935000 1225700 1861382
Losses(MW) 13.6 12.2 12.3 12.0
By observing the table 8 the security indices are improved in case of TCSC the values improved form 10 ,4.0 to 9.9 and 3.7,in case of SVC the values improved form 10 ,4.0 to 9.1and 3.4, in case of UPFC the values improved form 10 ,4.0 to 8.5 and 2.8. Among these devices the security index using UPFC is less. Table 9: Security Indices and installation costs using PSO Device
Jp
Jv
Cost$
Losses(MW)
Without FACTS TCSC SVC UPFC
10 8.5 7.9 7.5
4.0 3.9 3.3 3.1
1426596 1225473 1880456
13.6 12.24 12.10 11.8
By observing the table 9 the security indices are improved in case of TCSC the values improved form 10, 4.0 to 8.5 and 3.9, in case of SVC the values improved form 10, 4.0 to 7.9 and 3.3, in case of UPFC the values improved form 10, 4.0 to 7.5 and 3.1. Among these devices the security index using UPFC is less. Table 10: Security Indices and installation costs using GA Device Without FACTS TCSC SVC UPFC
Jp
Jv
Cost$
10 8.7 8.0 7.4
4.0 3.9 3.4 3.1
1526296 1323443 1890446
Losses(MW) 13.6 12.3 12.10 11.9
By observing the table 10 the security indices are improved in case of TCSC the values improved form 10, 4.0 to 8.7 and 3.9, in case of SVC the values improved form 10, 4.0 to 8.0 and 3.4, in case of UPFC the values improved form 10, 4.0 to 7.4 and 3.1. Among these devices the security index using UPFC is less.
199
Venkata Padmavathi S et al: Comparison of Hybrid Differential Evolution Algorithm ...
Table 11: Security Indices and installation costs using DEPSO Device
Jp
Jv
Cost$
Losses(MW)
Without FACTS
10
4.0
-
13.6
TCSC
7.9
3.8
1444476
12.21
SVC
7.6
3.4
1089289
12.10
UPFC
7.4
2.9
1796304
11.50
By observing the table 11 the security indices are improved in case of TCSC the values improved form 10, 4.0 to 7.9 and 3.8, in case of SVC the values improved form 10, 4.0 to 7.6 and 3.4, in case of UPFC the values improved form 10, 4.0 to 7.4 and 2.9. Among these devices the security index using UPFC is less. By observing these tables the values obtained by DEPSO are more accurate than the other methods. By observing the tables 8,9,10 the security indices are reducing with reference to base case security index and losses also reduced with reference to base case. The graphs shown in fig.6, 7, 8 are fitness variation in every iteration using DE, PSO, GA, DEPSO. It is clear that the convergence is accurate using DEPSO. Ite ra tio n v s . F itn e s s S v c 4 .5
4
3 .5 ss e tn i 3 F
2 .5
2
1 .5
0
5
10
15
20
25 Ite r a tio n
30
35
40
45
50
Fig.6 Fitness variation in every iteration using SVC Iteration vs Fitness TCSC 5
4.5
Fitness
4
3.5
3
2.5
2
1.5 0
5
10
15
20
25 30 Iteration
35
40
Fig.7 Fitness variation in every iteration using TCSC
200
45
50
J. Electrical Systems 11-2 (2015): 189-202
Iteration vs Fitness UPFC 4 3.9 3.8 3.7
Fitness
3.6 3.5 3.4 3.3 3.2 3.1 3
0
2
4
6
8
10 12 Iteration
14
16
18
20
Fig.8 Fitness variation in every iteration using UPFC
5. Conclusion In this paper a novel stochastic optimization algorithm called hybrid differential evolution algorithm (DEPSO) has been proposed to achieve a better result and to eliminate the problems of DE and PSO to solve the power system security problem with a greater accuracy. The efficacy of the proposed algorithm is tested on IEEE 14-bus system. The test results of proposed algorithm are compared with the well-known heuristic search methods DE, PSO and GA. From the test results, it is observed that, the proposed algorithm converges to best solution compared to differential evolution (DE), Particle Swarm Optimization (PSO) techniques and Genetic Algorithm. By using DE, PSO, GA, DEPSO algorithms the security indices reduced compared to the base case security indices. Among these algorithms there is better improvement of system security by using the proposed (DEPSO) algorithm. Thus, the proposed hybrid differential evolution algorithm is more effective for the security analysis. Acknowledgement The authors express sincere thanks to the management of GITAM University Hyderabad, JNTU Hyderabad, and M.V.G.R. Col of Engg Vizianagarm for providing necessary facilities.
References [1] Salah Kamel, Mamdouh Abdel-Akher, and Mohamed K. El-nemr, Direct Modeling of UPFC in Newton Raphson Power flow Analysis Based on Current Injections, International Middle East Power Systems, Paper ID 281,770-774, 2010. [2] N.G.Hingorani &L. Gyugyi New York: IEEE, 2000, Understanding FACTS, Concepts & Technology of Flexible AC Transmission Systems. [3] A.K.Chakraborty S. Majumdar , Active Line Flow Control of Power System Network with FACTS Devices of choice using Soft Computing Technique, International Journal of Computer Applications (0975 – 8887), Volume 25– No.9, July 2011. [4] D.J.Gotham, G.T.Heydt, Power flow control and power flow studies for systems with FACTS devices, IEEE Trans on power systems, Vol. 13, No. 1, 60-65, February 1998. [5] M.Saravanan,S.Mary Raja Slochanal, P.Venkatesh,J.Prince Stephen Abraham, Application of particle swarm optimization technique for optimal location of FACTS devices considering cost of installation and system loadabilit, Electric Power Systems Research 77 (2007) 276–283,Elsevier. [6] Ghamgeen I. Rashed, Yuanzhang Sun, H. I. Shaheen , Optimal TCSC Placement in a Power System by Means of Differential Evolution Algorithm Considering Loss Minimization, IEEE 2011
201
Venkata Padmavathi S et al: Comparison of Hybrid Differential Evolution Algorithm ...
[7] H. Amhriz-PBrez, E. Acha, and C. R. Fuerte-Esquivel , Advanced SVC Models for Newton-Raphson Load Flow and Newton Optimal Power Flow Studies, IEEE transactions on power systems. Vol. 15. NO. 1, February 2000. [8] James Kennedy and Russell Eberhart, Particle Swarm Optimization, IEEE Conf, 1942-1948, 1995. [9] Mohsen Gitizadeh, Mohsen Kalantar, Genetic algorithm-based fuzzy multi-objective approach to congestion management using FACTS devices, Springer,Electric engineering,539-549,2009. [10] S.N. Singh, A.K. David, A new approach for placement of FACTS devices in open power markets, IEEE Power Eng. Rev. 21 (9), 58–60, 2001. [11] H. R. Baghaee, M. Jannati, B. Vahidi, Senior Member IEEE, S.H.Hosseinian and S. Jazebi ,Optimal Multitype FACTS Allocation using Genetic Algorithm to Improve Power System Security, IEEE Conference proceedings,162-166,2008. [12] M.M. Farsangi H. Nezamabadi-Pour, Differential Evolutionary Algorithm for Allocation of SVC in a Power System, IJTPE journal, Vol.1,15-22, Dec 2009. [13] P. Bhasaputra,W. Ongsakul, Optimal power flowwith multi-type of FACTS devices by hybrid TS/SA approach, IEEE Proceedings on International Conference on Industrial Technology, vol. 1, 285–290, December 2002,. [14] Ghamgeen I. Rashed, Yuanzhang Sun, H. I. Shaheen, Optimal TCSC Placement in a Power System by Means of Differential Evolution Algorithm Considering Loss Minimization, IEEE Conference proceedings, 2209-2215, 2011. [15] T.S. Chung, Y.Z. Li , A hybrid GA approach for OPF with consideration of FACTS devices, IEEE Power Eng. Rev. 21 (2) 47–50, 2001. [16] A. Kazemi, H. A. Shayanfar, A. Rabiee, and J. Aghaie, Power System Security Improvement Using the Unified Power Flow Controller (UPFC), IEEE Conference proceedings 2006. [17] Rajiv K. Varma, Introduction to FACTS Controllers, IEEE conference proceedings 2009. [18] A.R.Jordehi, J.Jasni, Parameter selection in particle swarm optimization, a survey, Journal of Experimental & Theoretical Artificial Intelligence, 25 (2013), 527-542. [19] Omid Ghanaati, Vahid Reza Seirafian, Iman Naderpour, Jalal Teymouri, Power System Security Improvement with Optimal Placement of FACTS Devices Using Genetic Algorithms, International Conference on Computer applications and Industrial Electronics , 126-131, 2011. [20] T.Venegas, C.R. Fuerte-Esquivel, Steady-state Modeling of Thyristor controlled series compensator for Phase Domain Load flow analysis of electric analysis, International conference on Power system Technology1998, POWERCON '98. vol.1. 344-348,1998. [21] Baghaee, H. R., Vahidi, B.,Jazebi, S., Gharehpetian, G. B. , & Kashefi, A Power System Security Improvement by Using Differential Evolution Algorithm Based FACTS Allocation, Power System Technology and IEEE Power india conferece 2008,POWERCON,joint international conference,1-6 2008. [22] K.Gnanambal,N.S.Marimuthu,C.K.Babulal, A hybrid differential evolution to solve power flow problem in rectangular coordinate,Journal of Electrical systems,395-406,2010. [23] Chao-Lung Chiang , Chia-An Wang , Hybrid Differential Evolution for Cogeneration Economic Dispatch Problem, Proceedings of the Ninth International Conference on Machine Learning and Cybernetics, Qingdao, 11-14, July 2010. [24] Sameh Kamel Mena Kodsi, Claudio.A ,Modeling and Simulation of IEEE 14 Bus System with FACTS Controllers, Technical Report, 1-46,2003. [25] A.R.Jordehi,J.Jasni,N.Abd Wahab,M.Z.Kadir,M.S.Javadi, Enhanced leader PSO (ELPSO): A new algorithm for allocating distributed TCSC’s in power systems, International Journal of Electrical Power & Energy Systems, 64 (2015) 771-784. [26] A.R.Jordehi, J.Jasni, A Comprehensive Review on Methods for Solving FACTS Optimization Problem in Power Systems, International Review of Electrical Engineering, 6 (2011). [27] A.R.Jordehi, J.Jasni, Heuristic methods for solution of FACTS optimization problem in power systems, IEEE Student Conference on Research and Development, 2011, 30-35. [28] A.R.Jordehi, J.Jasni, Particle swarm optimisation applications in FACTS optimization problem, Power Engineering and Optimization Conference (PEOCO), IEEE 7th International, 2013, 193-198. [29] A.R.Jordehi, M.Joorabian,Optimal placement of Multi-type FACTS devices in power systems using evolution strategies, Power Engineering and Optimization Conference (PEOCO), 5th International, IEEE, 2011, 352-357. [30] David E. Goldberg, 19th impression, Pearson publication, 2014, Genetic Algorithms in Search, Optimization, and Machine Learning.
202