IEEE TRANSACTIONS ON VISUALIZATION AND COMPUTER GRAPHICS, TVCG-0144-1104
1
Comparison of Path Visualizations and Cognitive Measures Relative to Travel Technique in a Virtual Environment Catherine Zanbaka, Benjamin Lok, Sabarish Babu, Amy Ulinski, Larry F. Hodges Abstract— We describe a between-subjects experiment that compared four different methods of travel, and their effect on cognition and paths taken in an immersive virtual environment (IVE). Participants answered a set of questions based on Crook’s condensation of Bloom’s taxonomy that assessed their cognition of the IVE with respect to knowledge, understanding and application, and higher mental processes. Participants also drew a sketch map of the IVE and the objects within it. Users’ sense of presence was measured using the Steed-Usoh-Slater Presence Questionnaire. Participants’ position and head orientation were automatically logged during their exposure to the virtual environment. These logs were later used to create visualizations of the paths taken. Path analysis, such as exploring the overlaid path visualizations and dwell data information, revealed further differences among the travel techniques. Our results suggest that for applications where problem solving and interpretation of material is important or where opportunity to train is minimal, having a large tracked space so that the participant can walk around the virtual environment provides benefits over common virtual travel techniques. Index Terms—Evaluation, information visualization, navigation, virtual reality.
—————————— ——————————
1 INTRODUCTION
N
UMEROUS techniques have been implemented in Virtual Environments (VEs) to allow a participant to move about a virtual space. In general they can be categorized as either techniques that try to replicate the energy and motions of walking, or as purely virtual travel techniques. Examples of the former include treadmills [1], [2] and walking in place schemes [3], [4], [5]. Examples of the latter usually use a joystick to “fly” though a space in a direction specified by either head orientation or a handheld pointer [6]. All of these approaches assume that the physical tracked space available to the user is smaller than the virtual space that is to be experienced. However, recent advances in wide area position tracking technology now enable us to track a user’s movement through spaces that are much more expansive than the 2-3 meter diameter spaces normally tracked by electromagnetic tracking devices [7]. This upgrade in available technology allows us to create virtual environments that a user can experience by simply walking around in the environment in the same way she would walk around a physical space. It also provides us the opportunity to measure the relative efficacy of experiencing a space via normal walking versus any of the simulated walking metaphors. Our goal was to investigate the differences on cognition and understanding of a virtual environment when explored using common joystick-based travel techniques versus walking about the space in a natu————————————————
• C. Zanbaka, S. Babu, A. Ulinski, and L. F. Hodges are with the Department of Computer Science. University of North Carolina at Charlotte, NC 28223. E-mail: {czanbaka, sbabu, aculinsk, lfhodges}@uncc.edu. • B. Lok is with the Department of Computer and Information Science and Engineering, University of Florida, Gainesville, FL32611. E-mail:
[email protected]. For information on obtaining reprints of this articles, please send email to:
[email protected], and reference IEECS Log Number XXXXX.
ral manner. This paper is an extension of previous paper published at the IEEE VR 2004 [8].
2 PREVIOUS WORK Navigation is the most common user action in virtual environments and is divided into a motor component called travel and a cognitive component called wayfinding [9]. Bowman defines wayfinding as the cognitive process of defining a path through an environment, thereby using and acquiring spatial knowledge to build up a cognitive map of the environment. Travel, on the other hand, refers to the movement of the viewpoint from one location to another. Wayfinding issues have been the subject of studies by many [10], [11], [12], [13], [14], [15]. In this study, however, we focus on the travel component of navigation. In the next section we discuss different travel techniques.
2.1 Travel Techniques in IVEs Immersive virtual environments (IVEs) attempt to have the user believe they are within the virtual environment. Some IVEs, such as architecture walkthroughs, use a first person perspective [1]. To improve the level of immersion, some virtual environments systems use a tracking system to allow the user to control the viewpoint. Immersion “describes the extent to which the computer displays are capable of delivering an inclusive, extensive, surrounding, and vivid illusion of reality to the senses of a human participant” [16]. View-point control is usually accomplished by a combination of head motion and by some travel technique that may be entirely virtual (such as a joystick) or that may try to replicate real-world modes of travel such as walking or riding in a vehicle.
xxxx-xxxx/0x/$xx.00 © 200x IEEE
2
IEEE TRANSACTIONS ON VISUALIZATION AND COMPUTER GRAPHICS, TVCG-0144-1104
Tracking systems used in IVEs report the position and/or orientation of some device (typically attached to the user’s head) within some tracking area. Welch and Foxlin provide a comprehensive overview of current tracking systems [17]. We generalize indoor tracking systems for head tracking into three major categories: 1. 3DOF Orientation Only – System reports only the orientation of the device. Examples include: Intersense InertiaCube. 2. 6DOF Limited Area – System reports position and orientation, restricted to some distance (about 6 feet) from an emitter [19]. Electromagnetic and acoustic based trackers fall in this category. Examples include: the Ascension Flock of Birds and the Polhemus Fastrak. 3. 6DOF Wide Area – System reports position and orientation in a large area, typically room sized. These systems typically require substantial infrastructure (such as fiducal markers). Examples include: 3rdTech HiBall, Intersense IS-900, and the WorldViz PPT. With any of these tracking systems, if the physical tracked space is smaller than the virtual space, navigation is typically controlled through the use of tracked mice, joysticks, or gloves. But does this misregistration between the real and virtual world (e.g. user presses a button to simulate running) hamper the applicability of the virtual environment for learning and training? There have been surprisingly few analytic comparisons reported in the literature of the relative effectiveness of different travel modalities for different types of tasks. The next section outlines some previous studies in VE locomotion.
2.2 Studies in IVEs Previous studies suggest certain tasks and applications benefit from immersive virtual environments. Pausch showed that search tasks could be done faster in a tracked head mounted display (HMD) versus an untracked HMD [18]. Ruddle found that navigating large-scale virtual environments was significantly faster in a tracked HMD versus a desktop display [20]. VEs are useful in evaluating product designs and assembly verification [21], [22]. Bowman, Koller and Hodges [6] have conducted experiments on virtual joystick-based travel in immersive virtual environments that indicate that “pointing” techniques are advantageous relative to “gaze-directed” steering techniques for a relative motion task. They also report that motion techniques which instantly teleport users to new locations are correlated with increased user disorientation. In the evaluation of systems that try to replicate the energy and motions of walking, reported sense of presence has been rated higher in real walking and walking in place compared to joystick ‘flying’ conditions [23]. In studies that compared actually walking through a virtual maze to virtual travel, Chance et al. [24] found a significant difference between walking as compared to joystick controlled travel in participants’ ability to indicate the direction to unseen target objects from a terminal location in the maze. A secondary finding of this study was that the degree of motion sickness depended upon travel mode, with the lowest incidence occurring in the real walking mode. Mental maps and basic navigation are also improved by real walking [25]. Mania et al. compared recall of different shaped objects in
a photorealistic VE displayed on an HMD in mono or stereo, with or without head tracking, and on a desktop monitor with the real world task situation [26]. They found variations in the distribution of participants’ memory awareness states across conditions while, in certain cases, task performance failed to reveal any differences. In addition, they found that experimental conditions which incorporated head tracking were not associated with visually-induced recollections.
3 USER STUDY Cognition is defined as the process of receiving, processing, storing, and using information [27]. As opposed to perceptual motor tasks (e.g., pick up a pen), cognitive tasks require problem-solving decisions on actions (e.g., pick up a red pen). In this study, we asked the following question: Is there an effect on cognition if we explore a virtual space by walking around in a natural manner as compared to using a virtual travel technique? To investigate this question, we designed a study comparing common travel techniques to actually walking in a large tracked area. The task was to explore a virtual room for five minutes. Participants were told that they would be asked questions about the room at the end of their exploration.
3.1 Study Design and Methods 3.1.1 Participants The participants were 49 students from the University of North Carolina at Charlotte. Volunteers were recruited summer school courses, fliers, and by word-of-mouth. We discarded data from three participants who failed to complete a minimum of 66% of the cognition questionnaire, possibly due to loss of interest in the study. In addition, due to procedure failures, cognition questionnaire data from two participants was not collected. This left us with 44 participants’ data to be included in the analysis of the cognition questionnaires (eleven from each condition), and 46 in the remainder of the questionnaires, sketch maps, and debriefing. 3.1.2 Design The experiment was a between-subjects design. The independent variable was the travel technique. The dependent variables were performance on a cognition questionnaire and sketch map accuracy. The participants were randomly assigned to one of the four conditions described in the following section. 3.1.3 Conditions and Rationale One of the most commonly implemented methods of locomotion in a virtual environment is to use a handheld button device that moves the user in the direction that she is looking when a button is pressed. There are several variations to this approach. We can simulate “flying” if we allow the user to move in her look-at direction with no constraints. Virtual “walking” is usually implemented by moving the user in a 2D plane parallel to the ground plane of the environment.
ZANBAKA ET AL.: COMPARISON OF PATH VISUALIZATIONS AND COGNITIVE MEASURES RELATIVE TO TRAVEL TECHNIQUE IN A VIRTUAL ENVIRONMENT
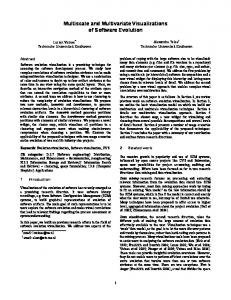
Fig. 1. Top left: Participant in Monitor condition. Bottom Left: Participant in Real Walking condition. Right: Participant in Virtual Walking condition.
The most common tracking technologies are either sixdegrees of freedom (position and orientation) trackers with a limited effective range or three-degrees of freedom (orientation-only) tracking devices. With the former the user can use normal body motion, such as squatting down or moving the head side-to-side, as she experiences a VE. With the latter approach, the user can change her view of the world by turning her head in a natural way, but her position can only be changed via virtual techniques such as button pushes on a hand-held device. For this study we compared the following four conditions: 1. Real Walking (RW) – Participant position and orientation are tracked in a physical tracked space the same size as the virtual room (4.5m x 4.6m x 2.6m). The participant walks around the virtual room in a natural manner (Figure 1). 2. Virtual Walking using Six-Degrees-of-Freedom Tracking (VW6) – Participant’s head position and orientation are tracked but the physical tracked space is smaller than the virtual room. The participant uses a wireless joystick to navigate about the room. When a button is pressed, the participant is translated forward or backward (depending on the button) along the participant’s look-at vector in a plane parallel to the floor. The participant stands within a 1.2m by 1.2m enclosure that both gives them something to hold on to for balance, and simulates the reduced tracking volume of common electromagnetic and acoustic tracking devices (Figure 1). 3. Virtual Walking using Three-Degrees-of-Freedom Tracking (VW3) – Participant head orientation is tracked. A joystick is used to implement virtual walking. The participant’s viewpoint is moved in a plane parallel to the floor of the room. The viewpoint can also be moved up and down relative to the floor of the room with a different set of buttons. The participant stands within the same 1.2m by 1.2m enclosure used in the VW6 condition. 4. Joystick with a Monitor (M) – The participant sits in front of a 17-inch flat panel display at a distance such that the field-of-view is equal to the HMD conditions (Figure 1). She navigates about the room in a manner identical to the VW3 condition (button arrangement, etc.) except that the joystick is now used to control the view direction.
3
One way to view our choices of what to test in this experiment is as a comparison of cost and capability versus performance. Large area six-degrees-of-freedom (RW) tracking systems are expensive in both monetary and space requirements as compared to orientation-only tracking (VW3). Limited range six-degrees-of-freedom trackers (VW6) are somewhere in between with respect to cost and space. The inclusion of the monitor condition (M) was to give us a degree of “ground truth” for the comparative usefulness of an immersive VE for the tasks that we evaluated. All conditions had a 60 degree diagonal field of view. Table 1 summarizes the salient properties of each condition. TABLE 1 CONDITION PROPERTIES
3.2 The Environment and Equipment 3.2.1 Equipment For the RW, VW6, and VW3 conditions, participants wore a stereoscopic V8 HMD (640 X 480 resolution in each eye) that was tracked by a 3rdTech HiBall 3100 tracking system. The HiBall updates position and orientation at approximately 1.5 kHz. Our HiBall system has a tracked volume of 4.5m x 4.6m x 2.6m. For condition M, we used a 17 inch flat screen monitor. We used a Logitech Wireless Joystick. All the conditions ran on a Pentium 4 Dell PC with an nVidia GeForce4 Ti 4200 graphics card. Condition M ran at 60 FPS, while the three HMD conditions ran between 24-30 FPS in stereo. 3.2.2 Training VE Immediately before exploring the testing VE, participants practiced navigation in a training virtual environment. The training VE had four different colored cubes at different locations in a single room. We asked the participants to locate and travel to each of these cubes. 3.2.3 Testing VE The testing VE was a single room measuring, 4.5 x 4.6 x 2.6 meters. The experimental VE matched the physical space of the tracking area in our lab. One of the virtual doors was mapped to match the physical door in the tracking area. We populated the room with furniture, pictures, books, magazines, etc (Figures 2a and 2b). Several objects in the testing VE were grouped into themes: the books were all by Steven King, the pictures were all of nature, and the magazines were all about golf. In addition, there were several sports items distributed throughout the room.
3.3 Measures We used the following measures: a cognition questionnaire (CQ) based on a condensed version of Bloom’s Taxonomy
4
IEEE TRANSACTIONS ON VISUALIZATION AND COMPUTER GRAPHICS, TVCG-0144-1104
of the Cognitive Domain [28], a sketch map [29], and the Steed-Usoh-Slater (SUS) Presence Questionnaire [30]. Additional measures were used to help determine if there were any confounding factors affecting the results between the different conditions.
Fig. 2a. Top down view of testing VE
The questions focused on objects evenly distributed about the room, such that roughly the same number and category of questions were asked about each part of the room. The following are example questions from each category: 1. Knowledge: How wide was the couch? How many darts were in the dartboard? 2. Understanding and Application: What was the common theme of the paintings? How many people are coming to eat? How did you come to your answer? 3. Higher Mental Processes: Name all the objects made out of wood. Given the genre of books in the room, name a book that the residents might buy. Each question was worth 1 point, for a maximum score of 27. Most of the questions (19) had a single answer for a possible score of either a 0 (wrong) or a 1 (correct). The remaining questions were posed such that an answer could be partially correct or approximately the correct answer. Answers were ranked by how close each participant’s response was to the correct answer. We quantized the rankings to these questions and gave scores of 0, 0.25, 0.5, 0.75, or 1.
Fig. 2b. First person view of testing VE
3.3.1 Cognition Questionnaire (CQ) We created a set of 27 questions to assess the participants’ cognition of the VE. These questions were selected and modified from an original set of 37 questions used in a pilot study conducted on 12 participants. The questions were based on Bloom’s taxonomy [28]. Bloom’s original taxonomy describes six cognitive categories arranged in a hierarchy from simple to complex: Knowledge, Comprehension, Application, Analysis, Synthesis, and Evaluation. We followed Crook’s condensation of the six categories into three [31]: Knowledge: the recall or recognition of specific information Understanding and Application: combines comprehension (understanding of facts and principles, interpretation of material) and application (solving problems, applying concepts and principles to new situations) Higher Mental Processes: combines analysis (recognition of unstated assumptions or logical fallacies, ability to distinguish between facts and inferences), synthesis (integration of learning from different areas or solving problems by creative thinking), and evaluation (judging and assessing).
Fig. 3. Sample Sketch Map
3.3.2 Sketch Maps Participants were asked to draw a top-down view, a sketch map, of the testing VE and the objects within it (Figure 3). Then, each participant’s sketch map was given a set of goodness and object positioning scores. Maps were ranked for goodness on a scale of 1 (poor) to 5 (excellent) by three graders who were blind to subject identity as was done by [29]. The map goodness rating is a subjective measure of how useful the map would be as a navigational VE tool. The graders ignored drawing ability and concentrated on overall room layout accuracy. The final goodness score for a map was an average of the scores given by the three graders. Maps were also graded on the relative position of the objects within the VE. Each map was given two scores: A total object position score based on how many objects in the room were correctly positioned in the
ZANBAKA ET AL.: COMPARISON OF PATH VISUALIZATIONS AND COGNITIVE MEASURES RELATIVE TO TRAVEL TECHNIQUE IN A VIRTUAL ENVIRONMENT
5
sketch. There were a total of 63 objects in the room. A significant object position score based on the five most commonly drawn objects. The significant objects were the sofa, dining table, divider, TV, and the coffee table. An object was counted if its relative position to other objects in the sketch map was correct. The specific object position was not important.
ences while determining if there were mean differences among the travel techniques on the CQ categories [35]. A univariate analysis of covariance (ANCOVA) was used for the sketch map scores, controlling for both spatial ability and visual memory. Finally, a one-way-between-subjects analysis of variance (ANOVA) was used for analysis of the remainder of our data [36]. An alpha level of 0.05 was used for significance on all measures.
3.3.3 Other Measures We measured sense-of-presence using the Steed-UsohSlater Presence Questionnaire (SUS) [30], spatial ability using Guilford-Zimmerman Aptitude Survey Part 5: Spatial Orientation [32], simulator sickness using the Kennedy – Lane Simulator Sickness Questionnaire (SSQ) [33], and visual memory using the Kit of Factor-Referenced Cognitive Test Factor MV-1: Shape Memory Test [34]. In addition, each participant was video taped and his/her position and orientation were automatically logged during the experimental session in the VE.
4.1 Cognition Questionnaire
3.4 Experiment Procedures The pre-testing, experiment session, and post-testing took each participant approximately one hour to complete. 3.4.1 Pre-Experiment The participant first read the Participant Information Sheet and was asked if she had any questions. She then read and signed the Informed Consent Form. Next, the participant filled out questionnaires about demographics, computer use, computer anxiety, and simulator sickness. She then took the Guilford-Zimmerman (GZ) Spatial Ability test. 3.4.2 Experiment Next, the participant entered a different area of the lab where the experimenter showed and explained to her the equipment particular to her condition. The participant then was fitted with the equipment and practiced navigation in the training environment. After the training session, the testing VE was loaded. The participant was asked to explore the environment for five minutes. 3.4.3 Post-Experiment The participant filled out another simulator sickness questionnaire and the SUS Presence Questionnaire. Next, the participant filled out the cognition questionnaire. She also filled out the visual memory test. She was then asked to draw a top-down sketch map of the VE. Finally the participant was interviewed by the experimenter to elicit qualitative reactions to the experiment.
4 RESULTS A multivariate analysis of covariance (MANCOVA) was first conducted on the three categories of the cognition questionnaire, using travel technique as the independent variable and controlling for visual memory. We intended on also using spatial ability as a covariate, but this measure was not correlated with the CQ scores. MANCOVA was deemed appropriate because it accounted for prior differ-
Although the difference in the total score on the CQ was not statistically significant, the results become interesting when broken down by categories: Knowledge (K), Understanding and Application (UA), and Higher Mental Processes (HMP). The MANCOVA across conditions for the three CQ categories, with visual memory as the covariate, revealed a significant multivariate effect of travel technique, Wilk’s Lamda = 0.56, F(9, 90) = 2.66, p < 0.01. This means that travel technique had a significant effect on the participants’ performance on the cognition questionnaire. Univariate follow-ups indicated significant group effects on scores of both the UA, F(3,39) = 3.63, p < 0.05, and HMP, F(3,39) = 3.12, p < 0.05, but not on the knowledge portion of the CQ, F < 1. TABLE 2 – ADJUSTED MEANS FOR UA AND HMP BY TRAVEL TECHNIQUE Condition
UA
HMP
RW VW6 VW3 M
4.60 2.78 3.23 2.96
3.69 2.36 3.04 2.84
Planned contrast tests (α planned = 0.05/3 = 0.016) showed that, after adjustment by the covariate, the CQ scores for RW were significantly higher than VW6 and M. The difference between RW and VW3 was (F (3, 37) = 2.44, p = 0.079). Scores on the UA and HMP portions of the CQ for RW were significantly higher than those for VW6 (F(1, 39) = 8.76, 9.01, respectively, p < 0.005). Scores on the UA and HMP portions for RW were also significantly higher than those for M (F(l, 39) = 7.69, p < 0.01, and F(l, 39) = 3.93, p < 0.05, respectively). Scores on the UA portion for RW were also significantly higher than those for VW3 (F(l, 39) = 5.19, p < 0.05). The adjusted means for UA and HMP by travel technique are shown in Table 2. The differences on the knowledge portion of the CQ was not significant among groups, which indicates that travel technique does not have an effect on the simple recall of objects within a VE.
4.2 Sketch Maps Analysis of the sketch maps revealed that travel technique had a significant effect on sketch map goodness scores. Table 3 shows the adjusted means for the sketch map scores by travel technique. The ANCOVA across conditions for sketch map goodness, with spatial ability and visual mem-
6
IEEE TRANSACTIONS ON VISUALIZATION AND COMPUTER GRAPHICS, TVCG-0144-1104
ory as covariates, revealed a significant multivariate effect of travel technique, F(3, 40) = 4.60, p < 0.01. Planned contrast tests, using α = 0.05 for significance, showed that the map goodness scores for RW were significantly higher than those in VW3 and M. Table 4 shows the results of these planned contrast tests. TABLE 3 – ADJUSTED MEANS FOR SKETCH MAP SCORES BY TRAVEL TECHNIQUE Condition
Map Goodness
Map Sig. Object
3.71 2.97 2.38 2.27
5.15 4.09 4.21 4.01
RW VW6 VW3 M
Map Object 31.27 23.07 23.18 21.52
also significant, p