Republic, GLOS s.r.o., Semily Czech Republic, Praha 2001. 15. Rosovsky,D.V.: Structural Reliability. Part of publ. W.Chen, The Civil Engineering. Handbook ...
Konference ANSYS 2009
Comparison of Probabilistic Methods to Solve the Reliability of Structures in ANSYS J. Králik Faculty of Civil Engineering, Slovak University of Technology in Bratislava Abstract: This paper describes some experiences from the deterministic and probabilistic analysis of the reliability and safety of the building structure. There are presented the methods and requirements of Eurocode EN 1990, standard ISO 2394 and JCSS. On the example of the probability analysis of the reliability of the high rise building is demonstrated the affectivity of the probability design of structures using SFEM. The influence of the various input parameters (material, geometry, soil, masses,…) is considered. The deterministic and probability analysis of the seismic resistance of the structure was calculated in the ANSYS program. Keywords: Probability, sensitivity, high rise building, earthquake, Eurocode, ANSYS.
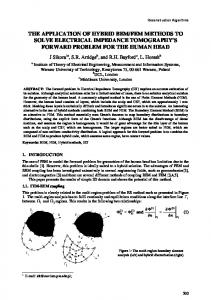
1. Introduction Recent advances and the general accessibility of information technologies and computing techniques give rise to assumptions concerning the wider use of the probabilistic assessment of the reliability of structures through the use of simulation methods [5], [6], [7], [9], [10], [11], [12], [13] and [14]. Much attention should be paid to using the probabilistic approach in an analysis of the reliability of structures [1], [8], [15], [16] and [17]. Most problems concerning the reliability of building structures are defined today as a comparison of two stochastic values, loading effects E and the resistance R, depending on the variable material and geometric characteristics of the structural element. The variability of those parameters is characterized by the corresponding functions of the probability density fr(x) and fee(x). In the case of a deterministic approach to a design, the deterministic Fig.1. Traditional reliability condition (nominal) attributes of those parameters Rd and Ed are compared. The deterministic definition of the reliability condition has the form
Rd ≥ Ed
(1)
TechSoft Engineering & SVS FEM
and in the case of the probabilistic approach, it has the form
RF = R − E ≥ 0
(2)
where RF is the reliability function, which can be expressed generally as a function of the stochastic parameters X1, X2 to Xn, used in the calculation of R and E.
RF = g ( X 1 , X 2 ,..., X n )
(3)
The failure function g(X) represents the condition (reserve) of the reliability, which can either be an explicit or implicit function of the stochastic parameters and can be single (defined on one cross-section) or complex (defined on several cross-sections, e.g., on a complex finite element model). The most general form of the probabilistic reliability condition is given as follows: p f = P ( R − E < 0) ≡ P ( RF < 0) < pd
(4)
where pd is the so-called design (“allowed“ or “acceptable“) value of the probability of failure. From the analytic formulation of the probability density by the functions fR(x) and fE(x) and the corresponding distribution functions ΦR(x) and ΦE(x), the probability of failure can be defined in the general form: pf =
∞
∫
dp f =
−∞
∞
∫
−∞
f E ( x)Φ R ( x) dx =
∞
∫Φ
E
( x) f R ( x)dx
(5)
−∞
This integral can be solved analytically only for simple cases; in a general case it should be solved using numerical integration methods after discretization. The index of reliability β is used to define reliability of the structures on the base of the linearised failure function g(X). In the case of the normal (e.g. lognormal) distribution we have following
β=
µRF , σ RF
(6)
where µRF and σRF are the mean values and the standard deviation of the reliability in the form
µ RF = µ R − µ E ,
2 σ RF = σ R2 + σ E2
(7)
2. Types and Methods of The Reliability Analysis The reliability analyses of the structures are differentiated from the point of view of design quantities as the deterministic and stochastic analyses [13]. On the base of stochastic methodology the following analyses can be realized:
� Stochastic analysis – the mean values and the standard deviation of the variable quantities are calculated analytically or numerically using Monte Carlo simulation, which gives us the more accurate results than deterministic values,
Konference ANSYS 2009
� Sensitivity analysis – the dominant impact to the output quantities is calculated using the sensitivity analysis, � Probabilistic analysis – the probability of the failure is defined in comparison with the simulated quantities. On the base of the evaluated input quantities the methodologies can by divided following: � Method of the allowed stresses (comparison of the maximum stresses), � Method of the safety factor (capacity is defined by one factor), � Method of the partial factor (action and capacity are defined by more factors). Empirical methods Traditional
Calibration
Level II
Level III
FORM
Full probabilistic
Calibration
Calibration
Level I Semiprobabilistic methods
Partial factor methods
Fig.2. Overview of reliability methods by Eurocode 1990 In the present the method of the partial factor is favorable in the practice. The Eurocode 1990 [3] and [5] recommends the use of three levels of the reliability analysis: I. level - all base input quantities Xi are taken in the calculation by one (design) value. This quantity is calculated from its characteristic value and partial factors, II. level - all base input quantities Xi are described by two statistical parameters (usually mean value and standard deviation). The probability of failure Pf (using the method FORM or SORM) can be used for comparison. The level II methods make use of certain well defined approximations and lead to results which for most structural applications can be considered sufficiently accurate. III. level – all base input quantities Xi are calculated using the theoretical model of the probabilistic density. Value Pf is determined by calculation using simulation methods on the Monte Carlo base. Full probabilistic methods give in principle correct answers to the reliability problem as stated. Level III methods are seldom used in the calibration of design codes because of the frequent lack of statistical data.
TechSoft Engineering & SVS FEM
In both the Level II and Level III methods the measure of reliability should be identified with the survival probability Ps = (1 - Pf), where Pf is the failure probability for the considered failure mode and within an appropriate reference period. If the calculated failure probability is larger than a preset target value Po, then the structure should be considered to be unsafe. Limit state
Target reliability index βd 50 years 3,8 (pf ≈ 10-4) 1,5-3,8*) (pf ≈ 10-1÷10-4) 1,5 (pf ≈ 10-1)
Ultimate Fatigue Serviceability
1 year 4,7 (pf ≈ 10-6) 3,0 (pf ≈ 10-3)
Tab.1. Target probability and reliability index by Eurocode 1990 [3] The measure of reliability in Eurocode 1990 [3] is defined by the reliability index β (Table 1). The reliability index depends on the criterion of the limited state. The standard JCSS [8] required the measure of reliability in dependency on the safety level (Table 2). Costs
Target reliability index βd Minor consequences 3,1 (pf ≈ 10-3) 3,7 (pf ≈ 10-4) 4,2 (pf ≈ 10-3)
(A) Large (B) Normal (C) Small
Moderate consequences 3,3 (pf ≈ 5.10-4) 4,2 (pf ≈ 1.10-5) 4,4 (pf ≈ 5.10-5)
Large consequences 3,7 (pf ≈ 1.10-4) 4,4 (pf ≈ 5.10-6) 4,7 (pf ≈ 1.10-6)
Tab.2. Target probability and reliability index by JCSS [R44] The measure of reliability depends on the lifetime of the structure and its importance (Table 2). In the case of the normal distribution of the probability failure the relation between the probability and the reliability index is defined in the form
p f = Φ ( −β f Design working life category
)
(8)
Indicative design working life Td (years)
1
Object
10
Temporary structures
2
10 to 25
Replaceable structural parts, e.g. gantry girders, bearings
3
15 to 30
Agricultural and similar structures
4
50
Building structures and other common structures
100 and more
Monumental building structures, bridges, and other civil engineering structures
5
Tab.3. Indicative design working life by ENV 1990 [3] When the main uncertainty comes from actions that have statistically independent maxima in each year, the values of β for a different reference period can be calculated using the following expression
pn = 1 − (1 − p1 )
n
and
Φ ( β n ) = Φ ( − β1 )
n
(9)
Konference ANSYS 2009
where βn is the reliability index for a reference period of n years, β1 is the reliability index for one year.
3. Uncertainties of Input Data The uncertainties of the input data – action effect and resistance are for the case of the deterministic calculation of the reliability of structure, defined in Eurocode 1990 [3]. For the case of the probabilistic access to define the reliability of structure, the requirements stated in European standard JCSS 2000 [8] and American standard ASCE 7-95 are used. One possible access to the definition of the load uncertainties is defined in book [14], where is described the philosophy of the method SBRA based on the Monte Carlo simulations and combination of the three components of load – dead (D), live (L) and sort (S). First complex information about the application of the standard Eurocode 1990 and ISO 1998 from the point of view of the probabilistic methods to analyze the reliability of structures is publication [5] with the examples in program MathCAD and MATLAB. The requirements of the standards ASCE 7-95 and JCSS 2000 to define the statistical input data for probabilistic analysis are presented in the Table 4. The distribution functions of the input data can be used for the characteristic values of the defined quantities. In the case of load combination the calibration of this parameters must be used [5], [6] and [13]. Category Load
Quantity Type
Dead Live (50years) Wind (50years) Snow (50years) Earthquake Strength Yield steel strength Ultimate steel strength Concrete strength Yield reinfor.strength Geometry IPE profile steel profile L profile, bar Geometry Dimension of section concrete Conrete covers profile Accident excentricity Model Action effect uncertainties Resistance
JCSS 2000 Symbol Distribu Mean tion µX G N 1 Q GU 0,6 W GU 0,7 S GU 1,1 AE N 1 fay LN 1+2σ
Stand.dev. σX 0,03-0,1 0,35 0,35 0,33 0,20 0,07-0,1
ASCE 7-95 Symbo Distribu Mean l tion µX D N 1,05 L Typ I 1 W Typ I 0,78 S LN 0,2 AE Typ II 0,5-1,0 fay LN 1,05
Stand.dev. σX 0,10 0,25 0,37 0,87 0,5-1,4 0,11
fau
LN
κ.µfay
0,05
fau
LN
fc
LN
1+2σ
0,1-0,18
fc
LN
1,05
0,11
1,03-1,11 0,11-0,14
fsy
LN
1+2σ
0,08-0,1
fsy
LN
1,11
0,13
A,J A,J
N N
0,99Xn 1,02Xn
0,01-0,04 0,01-0,02
A,J A,J
LN LN
1 1
0,05 0,05
b,h
N
1
0,005-0,01
b,h
-
-
-
a e
BET N N N
1 0 1 1-1,25
0,005-0,015 0,003-0,01 0,05-0,10 0,05-0,20
a e
LN LN
1 1,05
0,05-0,10 0,11
θE θR
θE θR
Tab.4. Comparison of the base parameters for the probabilistic design
TechSoft Engineering & SVS FEM
4. Reliability Criteria for Seismic Resistance of Structure Reliability of the bearing structures is designed in accordance of standard requirements STN 731201 and ENV 1998-1-1 to 3 [4, 13 and 15] for ultimate and serviceability limit state. Horizontal reinforced plane structures are designed on the bending and shear loads for ultimate limit state function (10) in the next form
g (M ) = 1 − M E M R ≥ 0 ,
g (V ) = 1 − VE VR ≥ 0
(10)
where ME, VE are design bending moment and design shear force of the action and MR, VR are resistance bending moment and resistance shear force of the structure element. Vertical plane reinforced concrete structures are designed to the tension or pressure and shear resistance for function of failure [13] in the form
g(N ) = 1− NE NR ≥ 0 ,
g (V ) = 1 − VE VR ≥ 0
(11)
where NE, VE are normal and shear design forces of action and NR, VR are resistance normal and shear forces to unit length. In the case of the combination of the action of the normal forces and bending moments the yield function F(.) must be used as follows
g(N , M ) = 1− F ( NE , M E ) / F ( NR , M R ) ≥ 0
(12)
Damage limitation of the reinforced concrete structures depend on the criterion of the maximum interstorey drifts. The standard ENV 1998 defines the function of failure in the form g (d ) = 1 − d E d R ≥ 0
(13)
where dE is interstorey horizontal displacement, dR is limit value of interstorey horizontal displacement defined (for non-structural elements of brittle materials attached to the structure) in the form
d R = 0, 005.h / ν
(14)
where h is storey height ( h = 3m ) and ν is reduction factor to take into account the lower return period of the seismic action associated with the damage limitation requirement (ν = 0,4).
Konference ANSYS 2009
5. Simulation Methods From the point of view of one’s approach to the values considered, structural reliability analyses can be classified in two categories, i.e., deterministic analyses and stochastic analyses. In the case of the stochastic approach, various forms of analyses (statistical analysis, sensitivity analysis, probabilistic analysis) can be performed. Considering the probabilistic procedures, Eurocode 1 recommends a 3-level reliability analysis. The reliability assessment criteria according to the reliability index are defined here. Most of these methods are based on the integration of Monte Carlo (MC) simulations. Three categories of methods have been presently realized [13]:
� Straight methods (Importance Sampling - IS, Adaptive Sampling - AS, Direct Sampling DS)
� Modified methods (Conditional, Latin Hypercube Sampling - LHS) � Approximation methods (Response Surface Method - RSM) A) Straight Monte Carlo methods are based on a simulation of the input stochastic parameters according to the expected probability distribution. The accuracy of this method depends upon the number of simulations and is expressed by the variation index:
νp = f
1 Np f
(15)
where N is the number of simulations. If the required probability of failure is pf = 10-4, then by the number of simulations N=106, the variation index is equal to 10%, which is an acceptable degree of accuracy. Advantages of the method: • the final values of the reliability reserves can be continuously displayed in the form of a histogram or cumulative function; the simulations are independent, • the method is easily understandable and transparent, • the method enables the estimation of the statistical discrepancy of the estimation on a particular relevance level. Drawbacks of the method:
• large number of simulations for small probability values, • slow calculations of complex problems (for Finite Element Method models, the calculations are expensive and ineffective). B) The Modified LHS method is based on the same number of simulations of the function g(X) as in the Monte Carlo method; however the zone of the distributive function Φ(Xj) is divided into N intervals with identical degrees of probability. This method provides good assessments of the statistical parameters of the structural response when compared to the Monte Carlo method. Using the LHS strategy, we get values like the reliability reserve parameter – the mean value Z , the standard deviation σz, the slant index αz, the sharpness index ez, or the empirical cumulative distribution function.
TechSoft Engineering & SVS FEM
The reduction of the number of simulations (tens to hundreds of simulations) means a valuable benefit from this method compared to the straight Monte Carlo method (thousands to millions of simulations). C) Approximation methods - Response Surface Methods are based on the assumption that it is possible to define the dependency between the variable input and the output data through the approximation functions in the following form: NRV
NRV NRV
Yˆ = co + ∑ ci X i + ∑ ∑ cij X i . X j i =1
i =1
(16)
j =1
where co is the index of the constant member; ci are the indices of the linear member and cij the indices of the quadratic member, which are given for predetermined schemes for the optimal distribution of the variables (Montgomery, Myers) or for using regression analysis after calculating the response (Neter).
a) Central Composite Design b) Box-Behnken Matrix Fig.3 Distribution schemes of the stochastic numbers of the RSM method for three input variables Approximate polynomial coefficients are given from the condition of the error minimum, usually by the "Central Composite Design Sampling" (CCD) method or the "Box-Behnken Matrix Sampling" (BBM) method. Advantages of the method:
• considerably less number of simulations than with the straight Monte Carlo method, • it is possible to define dependencies using the "design experiments" method or regression analysis from the defined points in the case of improper approximation functions,
Konference ANSYS 2009
• Particular simulations are independent from each other – parallel calculations can be used here. Drawbacks of the method:
• The number of simulations depends on the number of variable input parameters; in the case of a large number of input parameters, the method is ineffective, The method is unsuitable in the case of discontinuous changes in the dependencies between the input and output values (e.g., the method is not suitable for resolving the stability of ideal elastoplastic materials beyond the failure limit...). Central Composite Design Number of stochastic variables
1 2 3 4 5 6 7 8 9 10
Number of quadratic function coefficients 3 6 10 15 21 28 36 45 55 66
Box-Behnken Design
Number of factorials f
Number of stochastic numbers
N/A 0 0 0 1 1 1 2 2 3
N/A 9 15 25 27 45 79 81 147 149
Number of quadratic function coefficients 6 10 15 21 28 36 45 55 66
Number of stochastic numbers N/A N/A 12 25 41 49 57 65 121 161
Tab.5. Summary of the stochastic numbers depending on the number of stochastic input variables
6. Probabilistic Postprocessor in ANSYS Program For reliability analysis of the complicated structures the displacement-based FEM is favorable to use with the one from defined simulation methods. In this work the licensed program ANSYS [13] with probabilistic postprocessor was utilized for probability analysis of the reliability of NPP structures for various action effects. The ANSYS Program belongs among the complex programs for solving potential problems. It contains a postprocessor, which enables the execution of the probabilistic analysis of structures. In Figure 4, the procedural diagram sequence is presented from the structure of the model through the calculations, up to an evaluation of the probability of structural failure. The postprocessor for the probabilistic design of structures enables the definition of random variables using standard distribution functions (normal, lognormal, exponential, beta, gamma, weibull, etc.), or externally (user-defined sampling) using other statistical programs like AntHILL or FReET. The probabilistic calculation procedures are based on Monte Carlo simulations (DS, LHS, user-defined sampling) and "Response Surface Analysis Methods (RSM)" (CCD, BBM, user-defined sampling).
TechSoft Engineering & SVS FEM
Fig.4. Procedural diagram of probabilistic calculations using the ANSYS
7. Probabilistic Analysis of NBS in ANSYS In the case of the design of high rise buildings in the seismic active locality and in the complicated geological conditions the engineer must to consider the various action and resistance uncertainties. The variable material and geometric properties of the structural elements determine the resistance of the structures. The soil stiffness can be variable through to depth below foundation base and during the seismic even too. Bratislava locality is known for complicated hydrogeological conditions due to flood along the Danube river. The seismic hazard in Bratislava locality is determined by the source of the earthquake excitation in Austria ( design acceleration ag = γf.ar = 1,1.0,41 = 0,451ms-2). One from the interesting high rise building in Bratislava is the building of the Slovak National Bank (NBS). On the example of this building the importance of the probabilistic analysis of the seismic resistance of building will be presented.
Konference ANSYS 2009
The NBS building has 32 floors and the height is equal to 98,3m. The structure in plan is in the form of the quarter-circle with radius of 41,5m. The building has 3 underground floors with the foundation base on the level -11,5 m. The structural wall system is in the form L. The system is symmetrical about to diagonal axis. The plane dimension is variable through the building height. The structural system is composed from the coupling walls, flooring plates and the composite steel concrete columns. Building is based on the concrete foundation plate with the thickness of 2,3m. The calculation model is composed from the beam elements (BEAM44), shell elements (SHELL43) and solid elements (SOLID45) – number of the element is equal to 5.580 and nodes 3.464 (Fig.5).
Fig.5. Calculation model of NBS
7.1 Loading and Load Combination
Spectrum acceleration [m/s^2]
The loading and load combination in the case of the deterministic as well as the probabilistic calculation is different due to requirements of Eurocode 1990 [3] and JCSS 2000 [8], too. The seismic load was taken in accordance with ENV 1998 [4] as a design acceleration response spectrum for B type of soil and design acceleration ag = 1,0ms-2. 4 Sah Sav
3.5 3 2.5 2 1.5 1 0.5 0
0
5
10
15
20
25
30
35
Frequency [Hz]
Fig.6. Response spectrum acceleration In the case of deterministic calculation and the ultimate limit state of the structure the load combination is considered according to ENV 1990 as follows: � Seismic design situation – deterministic method
Ed = Gk +ψ 2.Q Qk ± AEd
(7)
TechSoft Engineering & SVS FEM
where Gk is the characteristic value of the permanent loads, Qk - the characteristic value of the variable loading, AEd (=γ1 AEd.k) - the design value of the seismic loading, AEd.k - the characteristic design value of the seismic loading, γI – importance factor (of the building structure), ψ2.Q - the combination factor according to ENV 1990 (ψ2.Q = 0,3). In the case of probabilistic calculation and the ultimate limit state of the structure the load combination we take following: � Seismic design situation– probability method
E = G + Q + AE = g var Gk + qvar Qk + avar AE .k
(8)
where gvar, qvar, avar are the variable parameters defined in the form of the histogram calibrated to the load combination in compliance with Eurocode [3]. 7.2 Spectrum analysis The seismic analysis of the high rise building structure was realized using the linearized response spectrum method. This method allows an approximate determination of the maximum response of an MDOF system without performing a time history analysis. The response spectrum of the displacements and forces from the excitation in direction a=1, 2, 3 is calculated from the modal response by method square root of sum of squares mode (SRSS). The total response spectrum is calculated from three base acceleration spectra (in space) alternatively from the combination SRSS or standard combination rule Rtot=R1+0,3R2+0,3R3 or Rtot=0,3R1+0,3R2+R3 or
Rtot=0,3R1+R2+0,3R3
where Ri (i=1,2,3) are response values from the acceleration excitation in the direction 1, 2, 3. The modal analysis of these two models of buildings was realized on the software ANSYS using Lanczos method. 7.3 Uncertainties of input variables The stiffness of the structure is determined with the characteristic value of Young’s modulus Ek and variable factor evar. A load is taken with characteristic values Gk, Qk, AE,k and variable factors gvar, qvar and avar. The effect of soil-structure interaction can be investigated in the case of probabilistic assessment by sensitivity analysis of the influence of variable properties of soil. A soil stiffness variability in the vertical direction is defined by the characteristic stiffness value kz from the geological measurement and the variable factor kz.var. The variability of the soil stiffness in the horizontal plane is determined by the variability of the global rotation kxx.var, kyy.var . The random distribution of the soil stiffness under foundation plate is approximated with bilinear function on the slab plane in dependency on three parameters kz.var, kxx.var, kyy.var
(8)
Konference ANSYS 2009
( x − xo ) ( y − yo ) k ( x, y ) = k z. var + 2 k yy. var + 2 k xx.var k z , k Lx Ly
(14)
where kz.k is characteristic value of soil stiffness, xo, yo are coordinates of foundation structure gravity centre, Lx and Ly are the plane dimensions of the slabs in directions x and y. Characteristics
Character. values Variable Histogram type Mean value Stand. deviation Min. value Max. value
translation in axis Z kz,k kz_var Normal 1 0,200 0,148 1,867
Soil stiffness rotation about X kxx,k kxx_var Normal 1 0,033 0,851 1,163
Rotation about Y kyy,k kyy_var Normal 1 0,033 0,853 1,135
permanent dead load Gk g_var Normal 1 0,033 0,569 1,385
Actions variable live wind load load Qk1 Wk q_var w_var Beta (T. I) Weibul (T.III) 0,57 0,37 0,28 0,18 0,858 0,021 1,127 1,335
accidental seismic load AEd,.k a_var Beta (T. I) 0,67 0,14 0,40 1,20
Tab.6. Probabilistic model of input parameters The uncertainties of the calculation model are considered by variable model factor θ R (Mu.var) for Beta distribution ( µ = 1, 05; σ = 0,1 ) and variable load factor θ E for Gauss‘s normal distribution ( µ = 1; σ = 0, 05 ). In the case of the probabilistic analysis the variability of the building stiffness and masses has non neglected influences to the building frequency characteristics. The principal frequencies in the direction X (e.g. Y) are in the interval from 0,50HZ to 0,78Hz. This interval of the eigenfrequencies impacts to the seismic input accelerations from the design response spectrum acceleration (Fig.6). 7.4 Sensitivity Analysis Sensitivity analysis of the influence of the variable input parameters to the reliability of the structures depends on the statistical independency between input and output parameters. Matrix of the correlation coefficients of the input and output parameters is defined by Spearman. The figures 8 and 9 show you the results of the sensitivity analysis of the interstorey drift and the shear forces in models RSM2 and LHS2 in the case of the seismic action. The variability of the seismic actions is dominant. The influency of the other input parameters is different in the method RSM and LHS. In the case of RSM method the other influencies are the variability of the stiffness (Evar) and the masses (Gvar) for the maximum displacement. In the case of the LHS method is the variability of the soil stiffness (kz.var). The same situation is in the case of the shear forces. The variability of the soil stiffness is in the fourth (e.g. second) place in the case of the RSM (e.g. LHS) analysis. These differencies results from the differencies of the algorithms LHS and RSM described in the chap.5. The sensitivity analysis gives the valuable information about the influence of uncertainties of input variables (load, material, model,) to engineer for optimal design of the structures.
TechSoft Engineering & SVS FEM
Fig.7. The results from the sensitivity analysis of the Dmax and Vmax in the model RSM2
Fig.8. The results from the sensitivity analysis of the Dmax and Vmax in model LHS2 7.5 Comparison of Deterministic and Probabilistic Analyses Deterministic calculation of the seismic resistance of the high rise building NBS was realized on two models different in dependency on the soil stiffness. From the point of view of probabilistic analysis, type and number of the variable input data the probabilistic analysis were realized by methods RSM and LHS for 100 simulations. On examples of the free models - RSM1, LHS1 (5 var.data - kz, Gk, Qk, Ak, θR ), RSM2, LHS2 (8 var.data - kz, kxx, kyy, Gk, Qk, Ak, θR, θE) and RSM3, LHS3 (10 and 11 var.data - kz, kxx, kyy, Gk, Ak, Ek, qz.k, qxx.k, qyy.k ,θR, θE) were realized the differences in the reliability conditions and the time of calculations were analyzed. The results of the deterministic and probabilistic analysis are described in the table 7. The results from the deterministic analysis are more conservative as probabilistic. This fact is related to the various combination rule for action impact in the case of the deterministic and probabilistic solution. The
Konference ANSYS 2009
results from the RSM analysis for 81 and 149 simulation give us the simile results than in the case of the LHS method for 100 simulations. From the point of view of the time and space calculation requirements the RSM method is more effective than LHS (see Tab.7 ) for the small number of the input parameters . Model
Extreme interstorey drifts [mm] Min
Mean
MKP
5,72
5,73
RSM1 RSM2 RSM3
2,14 1,79 1,79
2,19 3,99 4,08
LHS1 LHS2 LHS3
2,90 2,80 2,50
4,40 4,32 4,08
2,72
4,21
MC2
Max St.dev Deterministic 5,74 Probabilistic – RSM 3,92 0,83 7,28 0,86 7,46 0,88 Probabilistic – LHS 7,01 0,89 6,89 0,88 6,38 0,86 Probabilistic – MC 6,21 0,90
Number of the variable input data
Number cykl.
CPU
-
3
147
5 8 10
27 81 149
891 2670 4805
5 8 11
100 100 100
3145 4852 4965
8
100
2777
[sec]
Tab.7. Comparison of the analysis for maximum interstorey drift The efficiency and demandingness of the probabilistic methods is compared in the Tab.8. The time demands up to 8 input parameters evidently increase in the method RSM. The method LHS is more demanding to calculation time than the MC for the same number of the input variables. In the case of the same number of simulations the differences of the mean values of the interstorey drift is maximum equal to 2,5% between the LHS and MC. The differences in the output data for the 4 time more simulations are 15% for LHS method and 11% for the MC method (see Tab. 8). From the comparison of the probabilistic methods (Tab. 8) results, than the RSM method is the most effective fro the number of the input parameters less than 8. Model
Extreme of the interstorey drift [mm] Min
Mean
MKP
5,72
5,73
RSM2
1,79
3,99
LHS2a LHS2b LHS2c
2,80 2,22 2,00
4,32 3,68 3,68
MC2a MC2b MC2c
2,72 2,16 2,08
4,21 3,59 3,75
Max
St.dev
Deterministicky 5,74 Pravdepodobnostne – RSM 7,28 0,86 Pravdepodobnostne – LHS 6,89 0,88 6,76 0,82 5,43 0,80 Pravdepodobnostne – MC 6,21 0,90 6,21 0,85 7,55 0,83
Number of the variable input data
Number cykl. Min
CPU Mean
-
3
147
8
81
2670
8 8 8
100 200 400
4852 15243 30403
8 8 8
100 200 400
2777 8741 17567
Tab.8. Comparison of the probabilistic method efficiency If we have the results from experimental measurements of the material and geometric properties of the system, the method MC is more effective and accurate solution of the structural reliability. The
TechSoft Engineering & SVS FEM
sensitivity analysis of the influencies of the variability of the input parameters give to engineers the tools to design the optimal structures.
8. Conclusion This paper presented the methodology of the seismic analysis of the high rise building structure on the base of deterministic and probabilistic assessment. This analysis was realized on the example of the one symmetrical structure of the NBS in Bratislava. There were presented the advantages and disatvanges of the probabilistic methods to solve soil- structure interaction. Three probabilistic methods (MC, LHS and RSM) were investigated from the point of the accuracy and affectivity in comparison with the deterministic methods. On the example of this building the sensitivity analysis of the influence of the variable input parameters were considered. From these analysis results than the RSM method is the most effective method in the case of limited input variable parameters. In the case of the experimental input data the MC analysis is the most credible method for solution of the structural reliability.
Acknowledgement The project was realized with the financial support of the Grant Agency of the Slovak Republic (VEGA). The project registration number is VEGA 1/0849/08.
9. References 1.
Bolotin,V.V.: Použití metód teórie pravděpodobnosti a teorie spolehlivosti při navrhování konstrukcí, SNTL, Praha, 1978.
2.
Chopra, A.N., 2001, Dynamics of Structures, 2nd ed., Prentice-Hall, New York.
3.
EN 1990, Eurocode – Basis of structural design. CEN Bruxelles. 2002.
4.
Eurocode 8, Design of structures for earthquake resistance, Part 1: General rules, seismic actions and rules for buildings, CEN may 2000.
5.
Hanbook 2, Implementation of Eurocodes Reliability Backgrounds. Guide of the basis of structural reliability and risk engineering related to Eurocodes. Development of Skills Facilitating Implementatio of Eurocodes. Leonardo Da Vinci Pilot Project CZ/02/B/F/PP134007. Prague, CR, 10.2005.
6.
Holický,M.-Marková,J.: Základy teorie spolehlivosti a hodnocení rizik. ČVUT Praha 2005.
7.
Janas,P,-Krejsa,M.: Numerical probabilistic calculation with cut off histograms, IIIth International conference, Reliability of structures, 2002, pp.33-38, ISBN 80-02-01489-8.
Konference ANSYS 2009
8.
JCSS-OSTL/DIA/VROU-10-11-2000, Probabilistic Model Code, Part 1 Basis of Design, Working material, http://www.jcss.ethz.ch/, 2001.
9.
Králik,J.-Králik,J.,ml.: Reliability and Sensitivity Analysis of Tall Building Structures Considering the Soil-Structure Interaction. In: International Confernce VSU 2006, Sofia, Bulgaria, May 22-23, 2006. Vol. I. pp. I- 197-203. ISBN – 10: 954-331-009-2 (TOM 1).
10. Králik,J.-Králik,J.,ml.: Deterministický a pravdepodobnostný prístup k posudzovaniu spoľahlivosti výškových stavieb. In: Stavebné a environmentálne inžinierstvo, roč. 3, 2007, č.1, s. 12-27. ISSN 1336-5835. 11. Králik,J.- Králik,J.,jr.: Probability and Sensitivity Analysis of Soil-Structure Interaction of High-Rise Buildings, Slovak Journal of Civil Engineering , Slovak University of Technology Bratislava, vol. 2006/3, pp.18-32. 12. Králik,J.: Safety and Reliability of Nuclear Power Buildings in Slovakia. Earthquake-ImpactExplosion. Ed. STU Bratislava, 2009, 305 pp. 13. Králik,J.: Reliability Analysis of Structures Using Stochastic Finite Element Method. Ed. STU Bratislava, 2009, 143 pp. 14. Marek,P.-Brozzetti,J.-Guštar,M.: Probabilistic Assessment of Structures using Monte Carlo Simulation, Background, Exercises and Software, ITAM Academy of Sciences of the Czech Republic, GLOS s.r.o., Semily Czech Republic, Praha 2001. 15. Rosovsky,D.V.: Structural Reliability. Part of publ. W.Chen, The Civil Engineering Handbook, CRC Press, W.F.Chen Ed. 1995, Clenson University, SC. 16. Sasani,M.: Probabilistic Models for Seismic Design and Assessment of RC Structural Walls, In JCSS Workshop on Reliability Based Code Calibration, March 21/22, Zurich, 2002. 17. Šejnoha,J.-Novotná,E.: Naplňování představ o pravděpodobnostním posuzování spolehlivosti systémú na základě simulace. In proc. VII.Celostátní konfernce se zahranižní účastí „Spolehlivost konstrukcí“, 5.dubna 2006, Praha, Ed. ÚTAM AV ČR, ČKAIT, ČSSI a SPS, pp.177-182.